Races in Murrieta Hot Springs, California (CA) Detailed Stats
Ancestries, Foreign-born residents, place of birth

Recent posts about races in Murrieta Hot Springs, California on our local forum with over 2,400,000 registered users:
 | Commute from Temecula to Irvine and Vice Versa (34 replies) |
| Considering move to Murrieta area, lots of questions (57 replies) |
| Considering Murrieta (Honest Facts please) (65 replies) |
| Commute from Murrieta to San Diego (2 replies) |
| Need help deciding - Murrieta (13 replies) |
| Planning on moving...questions about Temecula...Please help?! (6 replies) |
11.7% of Murrieta Hot Springs, CA residents are foreign-born (6.1% born in Europe, 3.0% born in Latin America, 1.5% born in Asia), which is 122.2% less than the foreign-born rate of 26.0% across the entire state of California.
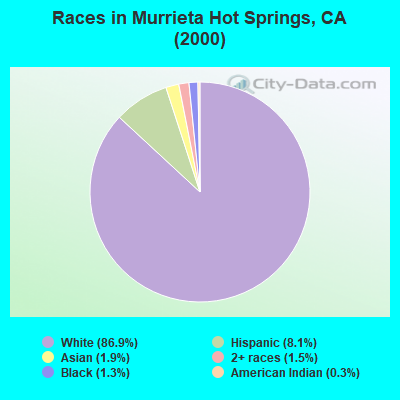
Race distribution in Murrieta Hot Springs

- 2,56186.9%White alone
- 2398.1%Hispanic
- 561.9%Asian alone
- 431.5%Two or more races
- 391.3%Black alone
- 90.3%American Indian alone
- 10.03%Native Hawaiian and Other
Pacific Islander alone
2000
2022
-
- 15,816,79046.7%White alone
- 10,966,55632.4%Hispanic
- 3,648,86010.8%Asian alone
- 2,181,9266.4%Black alone
- 903,1152.7%Two or more races
- 178,9840.5%American Indian alone
- 103,7360.3%Native Hawaiian and Other
Pacific Islander alone - 71,6810.2%Other race alone

-
- 15,732,18440.3%Hispanic
- 13,160,42633.7%White alone
- 5,957,86715.3%Asian alone
- 2,025,2185.2%Black alone
- 1,663,2224.3%Two or more races
- 251,6180.6%Other race alone
- 135,7770.3%Native Hawaiian and Other
Pacific Islander alone - 103,0300.3%American Indian alone

Income and house value in Murrieta Hot Springs
- Median household income in 2022
- $51,350White non-Hispanic householders
- $73,647Black householders
- $115,755American Indian and Alaska Native householders
- over $200,000Asian householders
- $5,052Some other race householders
- over $200,000Two or more races householders
- $53,461Hispanic or Latino race householders
- Median 2022 house value
- $652,552White Non-Hispanic householders
- $404,920Black or African American householders
- $989,806Two or more races householders
- $989,806Hispanic or Latino householders
Household income for White non-Hispanic householders

Household income for Black householders

Household income for American Indian and Alaska Native householders

Household income for Asian householders

Household income for Two or more races householders

Household income for Hispanic or Latino race householders

Foreign-born residents in Murrieta Hot Springs
345 residents are foreign born (6.1% Europe, 3.0% Latin America, 1.5% Asia).
| This city: | 11.7% |
| California: | 26.2% |
Ancestries in Murrieta Hot Springs

- 72623.1%Other
- 47115.0%German
- 39412.5%English
- 31710.1%Irish
- 1916.1%United States
- 1645.2%Italian
- 1243.9%French
- 1003.2%Scotch-Irish
- 963.1%Russian
- 752.4%Norwegian
- 722.3%Scottish
- 702.2%Swedish
- 551.7%Dutch
- 451.4%Polish
- 401.3%Czech
- 351.1%Lithuanian
- 351.1%Welsh
- 301.0%Danish
- 280.9%Hungarian
- 260.8%Swiss
- 210.7%Ukrainian
- 150.5%Portuguese
- 140.4%French Canadian

Zip codes: 92563.