Races in Naranja, Florida (FL) Detailed Stats
Data:
Races - White alone (%)
Races - White alone (% change since 2000)
Races - Black alone (%)
Races - Black alone (% change since 2000)
Races - American Indian alone (%)
Races - American Indian alone (% change since 2000)
Races - Asian alone (%)
Races - Asian alone (% change since 2000)
Races - Hispanic (%)
Races - Hispanic (% change since 2000)
Races - Native Hawaiian and Other Pacific Islander alone (%)
Races - Native Hawaiian and Other Pacific Islander alone (% change since 2000)
Races - Two or more races(%)
Races - Two or more races(% change since 2000)
Races - Other race alone (%)
Races - Other race alone (% change since 2000)
Racial diversity
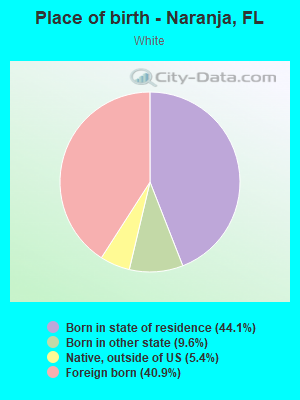
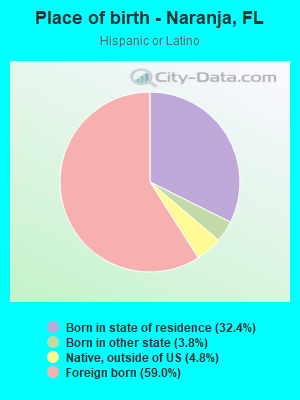
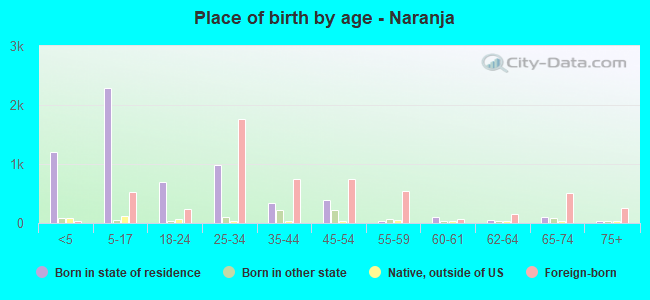
Place of birth - Born in state of residence (%)
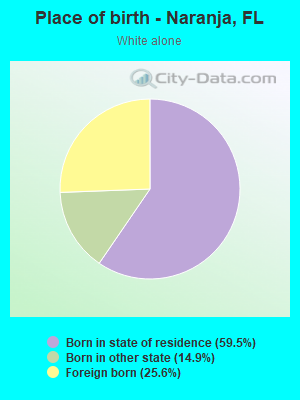
Place of birth - Born in state of residence (%) - White
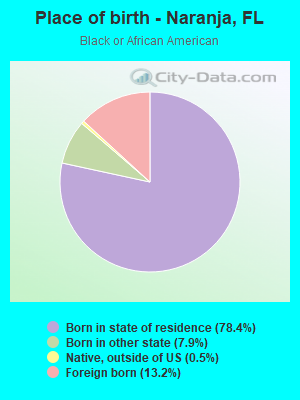
Place of birth - Born in state of residence (%) - Black or African American
Place of birth - Born in state of residence (%) - Asian
Place of birth - Born in state of residence (%) - Hispanic or Latino
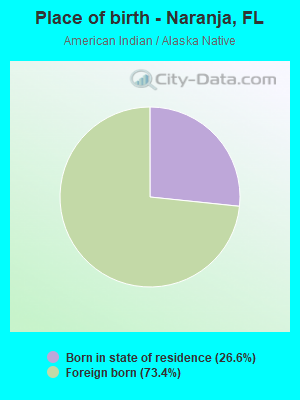
Place of birth - Born in state of residence (%) - American Indian and Alaska Native
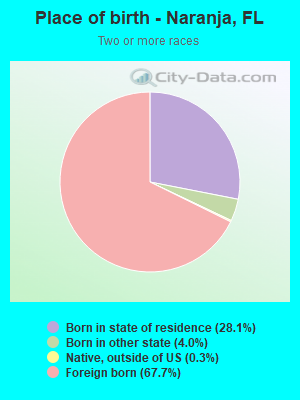
Place of birth - Born in state of residence (%) - Multirace
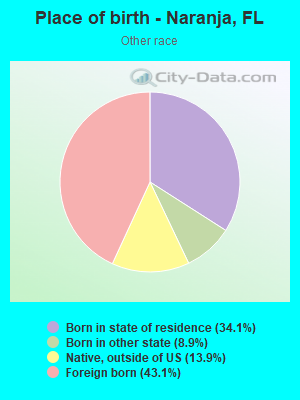
Place of birth - Born in state of residence (%) - Other Race
Place of birth - Born in other state (%)
Place of birth - Born in other state (%) - White
Place of birth - Born in other state (%) - Black or African American
Place of birth - Born in other state (%) - Asian
Place of birth - Born in other state (%) - Hispanic or Latino
Place of birth - Born in other state (%) - American Indian and Alaska Native
Place of birth - Born in other state (%) - Multirace
Place of birth - Born in other state (%) - Other Race
Place of birth - Native, outside of US (%)
Place of birth - Native, outside of US (%) - White
Place of birth - Native, outside of US (%) - Black or African American
Place of birth - Native, outside of US (%) - Asian
Place of birth - Native, outside of US (%) - Hispanic or Latino
Place of birth - Native, outside of US (%) - American Indian and Alaska Native
Place of birth - Native, outside of US (%) - Multirace
Place of birth - Native, outside of US (%) - Other Race
Place of birth - Foreign born (%)
Place of birth - Foreign born (%) - White
Place of birth - Foreign born (%) - Black or African American
Place of birth - Foreign born (%) - Asian
Place of birth - Foreign born (%) - Hispanic or Latino
Place of birth - Foreign born (%) - American Indian and Alaska Native
Place of birth - Foreign born (%) - Multirace
Place of birth - Foreign born (%) - Other Race
Residents speaking English at home (%)
Residents speaking English at home - Born in the United States (%)
Residents speaking English at home - Native, born elsewhere (%)
Residents speaking English at home - Foreign born (%)
Residents speaking Spanish at home (%)
Residents speaking Spanish at home - Born in the United States (%)
Residents speaking Spanish at home - Native, born elsewhere (%)
Residents speaking Spanish at home - Foreign born (%)
Residents speaking other language at home (%)
Residents speaking other language at home - Born in the United States (%)
Residents speaking other language at home - Native, born elsewhere (%)
Residents speaking other language at home - Foreign born (%)
Marital status - Never married (%)
Marital status - Now married (%)
Marital status - Separated (%)
Marital status - Widowed (%)
Marital status - Divorced (%)
Ancestries Reported - Arab (%)
Ancestries Reported - Czech (%)
Ancestries Reported - Danish (%)
Ancestries Reported - Dutch (%)
Ancestries Reported - English (%)
Ancestries Reported - French (%)
Ancestries Reported - French Canadian (%)
Ancestries Reported - German (%)
Ancestries Reported - Greek (%)
Ancestries Reported - Hungarian (%)
Ancestries Reported - Irish (%)
Ancestries Reported - Italian (%)
Ancestries Reported - Lithuanian (%)
Ancestries Reported - Norwegian (%)
Ancestries Reported - Polish (%)
Ancestries Reported - Portuguese (%)
Ancestries Reported - Russian (%)
Ancestries Reported - Scotch-Irish (%)
Ancestries Reported - Scottish (%)
Ancestries Reported - Slovak (%)
Ancestries Reported - Subsaharan African (%)
Ancestries Reported - Swedish (%)
Ancestries Reported - Swiss (%)
Ancestries Reported - Ukrainian (%)
Ancestries Reported - United States (%)
Ancestries Reported - Welsh (%)
Ancestries Reported - West Indian (%)
Ancestries Reported - Other (%)
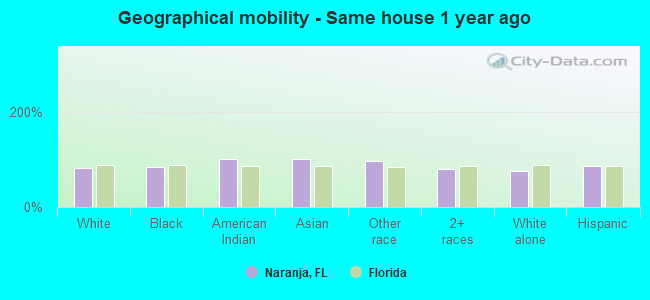
Geographical mobility - Same house 1 year ago (%)
Geographical mobility - Same house 1 year ago (%) - White
Geographical mobility - Same house 1 year ago (%) - Black or African American
Geographical mobility - Same house 1 year ago (%) - Asian
Geographical mobility - Same house 1 year ago (%) - Hispanic or Latino
Geographical mobility - Same house 1 year ago (%) - American Indian and Alaska Native
Geographical mobility - Same house 1 year ago (%) - Multirace
Geographical mobility - Same house 1 year ago (%) - Other Race
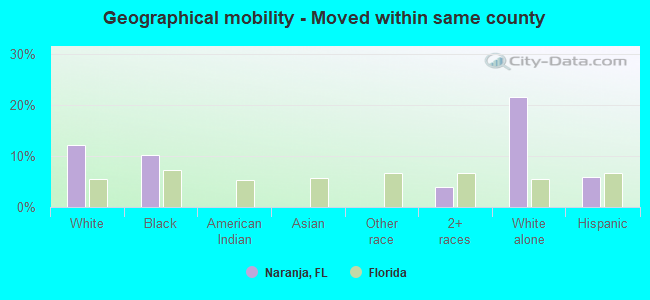
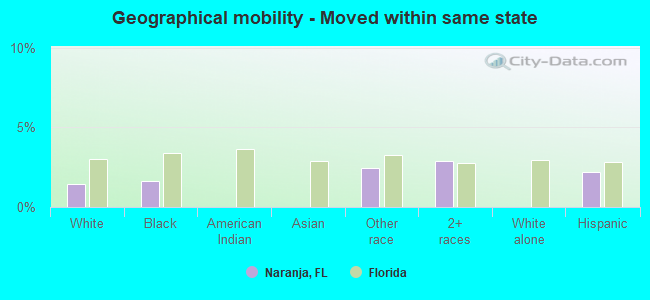
Geographical mobility - Moved within same county (%)
Geographical mobility - Moved within same county (%) - White
Geographical mobility - Moved within same county (%) - Black or African American
Geographical mobility - Moved within same county (%) - Asian
Geographical mobility - Moved within same county (%) - Hispanic or Latino
Geographical mobility - Moved within same county (%) - American Indian and Alaska Native
Geographical mobility - Moved within same county (%) - Multirace
Geographical mobility - Moved within same county (%) - Other Race
Geographical mobility - Moved from different county within same state (%)
Geographical mobility - Moved from different county within same state (%) - White
Geographical mobility - Moved from different county within same state (%) - Black or African American
Geographical mobility - Moved from different county within same state (%) - Asian
Geographical mobility - Moved from different county within same state (%) - Hispanic or Latino
Geographical mobility - Moved from different county within same state (%) - American Indian and Alaska Native
Geographical mobility - Moved from different county within same state (%) - Multirace
Geographical mobility - Moved from different county within same state (%) - Other Race
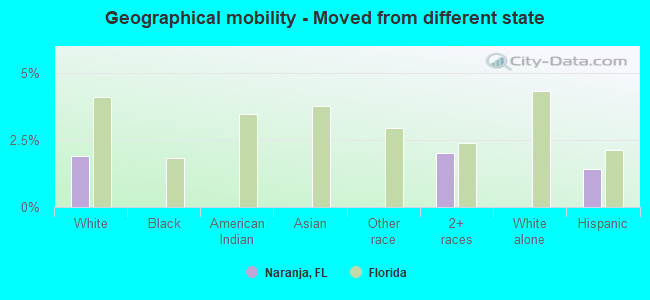
Geographical mobility - Moved from different state (%)
Geographical mobility - Moved from different state (%) - White
Geographical mobility - Moved from different state (%) - Black or African American
Geographical mobility - Moved from different state (%) - Asian
Geographical mobility - Moved from different state (%) - Hispanic or Latino
Geographical mobility - Moved from different state (%) - American Indian and Alaska Native
Geographical mobility - Moved from different state (%) - Multirace
Geographical mobility - Moved from different state (%) - Other Race
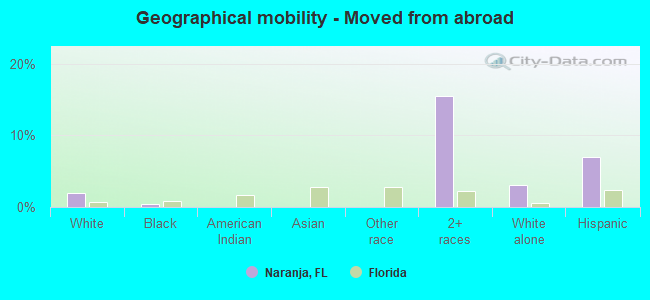
Geographical mobility - Moved from abroad (%)
Geographical mobility - Moved from abroad (%) - White
Geographical mobility - Moved from abroad (%) - Black or African American
Geographical mobility - Moved from abroad (%) - Asian
Geographical mobility - Moved from abroad (%) - Hispanic or Latino
Geographical mobility - Moved from abroad (%) - American Indian and Alaska Native
Geographical mobility - Moved from abroad (%) - Multirace
Geographical mobility - Moved from abroad (%) - Other Race
Place of birth for the foreign-born population - Ireland (%)
Place of birth for the foreign-born population - Denmark (%)
Place of birth for the foreign-born population - Norway (%)
Place of birth for the foreign-born population - Sweden (%)
Place of birth for the foreign-born population - United Kingdom (%)
Place of birth for the foreign-born population - England (%)
Place of birth for the foreign-born population - Scotland (%)
Place of birth for the foreign-born population - Other Northern Europe (%)
Place of birth for the foreign-born population - Austria (%)
Place of birth for the foreign-born population - Belgium (%)
Place of birth for the foreign-born population - France (%)
Place of birth for the foreign-born population - Germany (%)
Place of birth for the foreign-born population - Netherlands (%)
Place of birth for the foreign-born population - Switzerland (%)
Place of birth for the foreign-born population - Other Western Europe (%)
Place of birth for the foreign-born population - Greece (%)
Place of birth for the foreign-born population - Italy (%)
Place of birth for the foreign-born population - Portugal (%)
Place of birth for the foreign-born population - Spain (%)
Place of birth for the foreign-born population - Other Southern Europe (%)
Place of birth for the foreign-born population - Albania (%)
Place of birth for the foreign-born population - Belarus (%)
Place of birth for the foreign-born population - Bosnia and Herzegovina (%)
Place of birth for the foreign-born population - Bulgaria (%)
Place of birth for the foreign-born population - Croatia (%)
Place of birth for the foreign-born population - Czechoslovakia (%)
Place of birth for the foreign-born population - Hungary (%)
Place of birth for the foreign-born population - Latvia (%)
Place of birth for the foreign-born population - Lithuania (%)
Place of birth for the foreign-born population - North Macedonia (Macedonia) (%)
Place of birth for the foreign-born population - Moldova (%)
Place of birth for the foreign-born population - Poland (%)
Place of birth for the foreign-born population - Romania (%)
Place of birth for the foreign-born population - Russia (%)
Place of birth for the foreign-born population - Serbia (%)
Place of birth for the foreign-born population - Ukraine (%)
Place of birth for the foreign-born population - Other Eastern Europe (%)
Place of birth for the foreign-born population - China (%)
Place of birth for the foreign-born population - Hong Kong (%)
Place of birth for the foreign-born population - Taiwan (%)
Place of birth for the foreign-born population - Japan (%)
Place of birth for the foreign-born population - Korea (%)
Place of birth for the foreign-born population - Other Eastern Asia (%)
Place of birth for the foreign-born population - Afghanistan (%)
Place of birth for the foreign-born population - Bangladesh (%)
Place of birth for the foreign-born population - India (%)
Place of birth for the foreign-born population - Iran (%)
Place of birth for the foreign-born population - Kazakhstan (%)
Place of birth for the foreign-born population - Nepal (%)
Place of birth for the foreign-born population - Pakistan (%)
Place of birth for the foreign-born population - Sri Lanka (%)
Place of birth for the foreign-born population - Uzbekistan (%)
Place of birth for the foreign-born population - Other South Central Asia (%)
Place of birth for the foreign-born population - Burma (%)
Place of birth for the foreign-born population - Cambodia (%)
Place of birth for the foreign-born population - Indonesia (%)
Place of birth for the foreign-born population - Laos (%)
Place of birth for the foreign-born population - Malaysia (%)
Place of birth for the foreign-born population - Philippines (%)
Place of birth for the foreign-born population - Singapore (%)
Place of birth for the foreign-born population - Thailand (%)
Place of birth for the foreign-born population - Vietnam (%)
Place of birth for the foreign-born population - Other South Eastern Asia (%)
Place of birth for the foreign-born population - Armenia (%)
Place of birth for the foreign-born population - Iraq (%)
Place of birth for the foreign-born population - Israel (%)
Place of birth for the foreign-born population - Jordan (%)
Place of birth for the foreign-born population - Kuwait (%)
Place of birth for the foreign-born population - Lebanon (%)
Place of birth for the foreign-born population - Saudi Arabia (%)
Place of birth for the foreign-born population - Syria (%)
Place of birth for the foreign-born population - Turkey (%)
Place of birth for the foreign-born population - Yemen (%)
Place of birth for the foreign-born population - Other Western Asia (%)
Place of birth for the foreign-born population - Eritrea (%)
Place of birth for the foreign-born population - Ethiopia (%)
Place of birth for the foreign-born population - Kenya (%)
Place of birth for the foreign-born population - Somalia (%)
Place of birth for the foreign-born population - Uganda (%)
Place of birth for the foreign-born population - Zimbabwe (%)
Place of birth for the foreign-born population - Other Eastern Africa (%)
Place of birth for the foreign-born population - Cameroon (%)
Place of birth for the foreign-born population - Congo (%)
Place of birth for the foreign-born population - Democratic Republic of Congo (Zaire) (%)
Place of birth for the foreign-born population - Other Middle Africa (%)
Place of birth for the foreign-born population - Egypt (%)
Place of birth for the foreign-born population - Morocco (%)
Place of birth for the foreign-born population - Sudan (%)
Place of birth for the foreign-born population - Other Northern Africa (%)
Place of birth for the foreign-born population - South Africa (%)
Place of birth for the foreign-born population - Other Southern Africa (%)
Place of birth for the foreign-born population - Cabo Verde (%)
Place of birth for the foreign-born population - Ghana (%)
Place of birth for the foreign-born population - Liberia (%)
Place of birth for the foreign-born population - Nigeria (%)
Place of birth for the foreign-born population - Senegal (%)
Place of birth for the foreign-born population - Sierra Leone (%)
Place of birth for the foreign-born population - Other Western Africa (%)
Place of birth for the foreign-born population - Australia (%)
Place of birth for the foreign-born population - New Zealand (%)
Place of birth for the foreign-born population - Fiji (%)
Place of birth for the foreign-born population - Micronesia (%)
Place of birth for the foreign-born population - Bahamas (%)
Place of birth for the foreign-born population - Barbados (%)
Place of birth for the foreign-born population - Cuba (%)
Place of birth for the foreign-born population - Dominica (%)
Place of birth for the foreign-born population - Dominican Republic (%)
Place of birth for the foreign-born population - Grenada (%)
Place of birth for the foreign-born population - Haiti (%)
Place of birth for the foreign-born population - Jamaica (%)
Place of birth for the foreign-born population - St. Vincent and the Grenadines (%)
Place of birth for the foreign-born population - Trinidad and Tobago (%)
Place of birth for the foreign-born population - West Indies (%)
Place of birth for the foreign-born population - Other Caribbean (%)
Place of birth for the foreign-born population - Belize (%)
Place of birth for the foreign-born population - Costa Rica (%)
Place of birth for the foreign-born population - El Salvador (%)
Place of birth for the foreign-born population - Guatemala (%)
Place of birth for the foreign-born population - Honduras (%)
Place of birth for the foreign-born population - Mexico (%)
Place of birth for the foreign-born population - Nicaragua (%)
Place of birth for the foreign-born population - Panama (%)
Place of birth for the foreign-born population - Other Central America (%)
Place of birth for the foreign-born population - Argentina (%)
Place of birth for the foreign-born population - Bolivia (%)
Place of birth for the foreign-born population - Brazil (%)
Place of birth for the foreign-born population - Chile (%)
Place of birth for the foreign-born population - Colombia (%)
Place of birth for the foreign-born population - Ecuador (%)
Place of birth for the foreign-born population - Guyana (%)
Place of birth for the foreign-born population - Peru (%)
Place of birth for the foreign-born population - Uruguay (%)
Place of birth for the foreign-born population - Venezuela (%)
Place of birth for the foreign-born population - Other South America (%)
Place of birth for the foreign-born population - Canada (%)
Place of birth for the foreign-born population - Other Northern America (%)
Place of birth for the foreign-born population - Other (%)
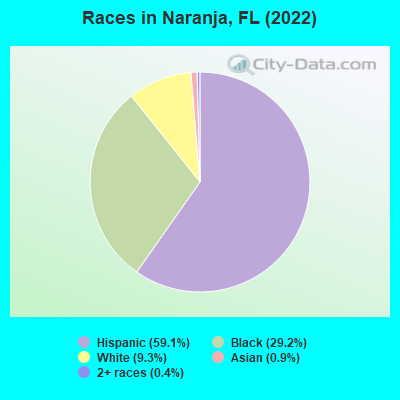
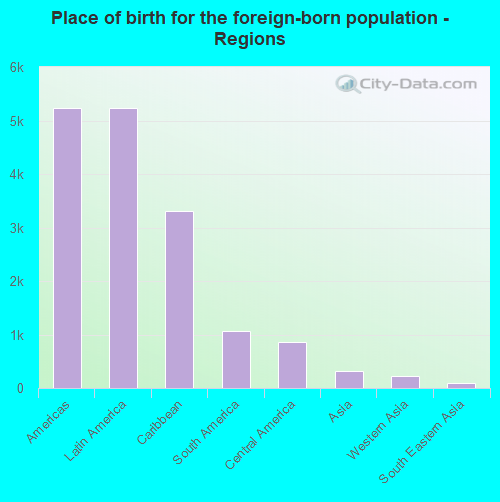
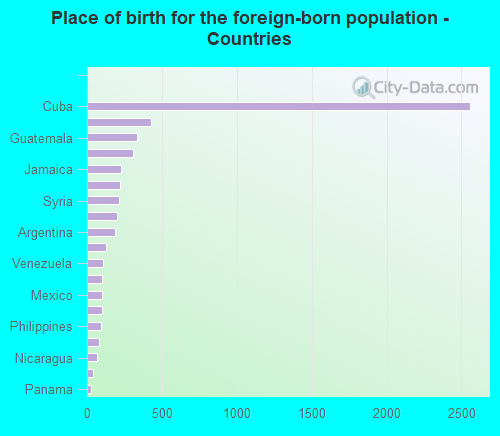
According to 2022 data, the most numerous races in Naranja, FL are White alone (1,232 residents), Hispanic (7,798 residents), and Black alone (3,854 residents). 44.9% of Naranja residents speak English at home. 42.4% of Naranja, FL residents are foreign-born (39.5% born in Latin America), which is 50.4% greater than the foreign-born rate of 21.0% across the entire state of Florida.
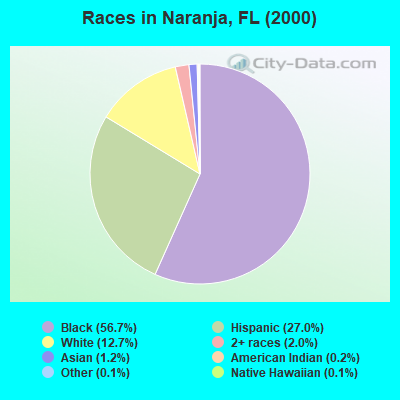
Race distribution in Naranja
2000 2022
10,458,509 65.4% White alone 2,682,715 16.8% Hispanic 2,264,268 14.2% Black alone 261,693 1.6% Asian alone 236,954 1.5% Two or more races 42,358 0.3% American Indian alone 28,994 0.2% Other race alone 6,887 0.04% Native Hawaiian and Other
11,309,403 50.8% White alone 6,025,039 27.1% Hispanic 3,241,015 14.6% Black alone 861,630 3.9% Two or more races 623,692 2.8% Asian alone 152,054 0.7% Other race alone 22,504 0.1% American Indian alone 9,486 0.04% Native Hawaiian and Other
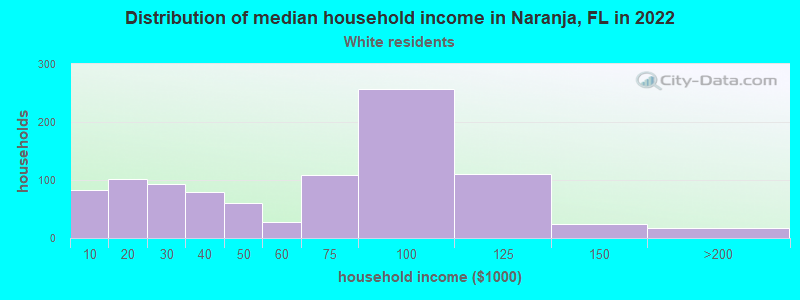
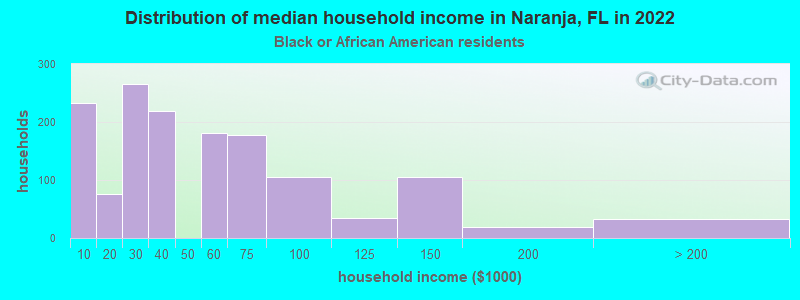
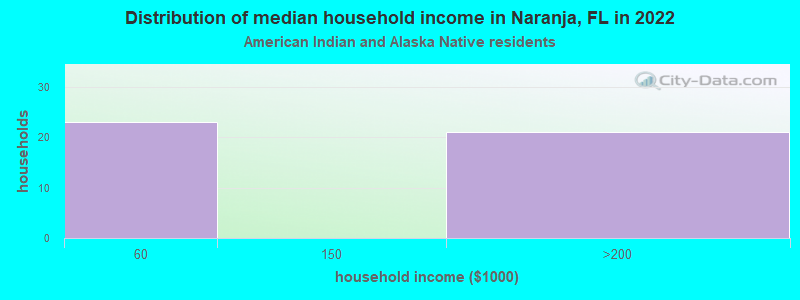
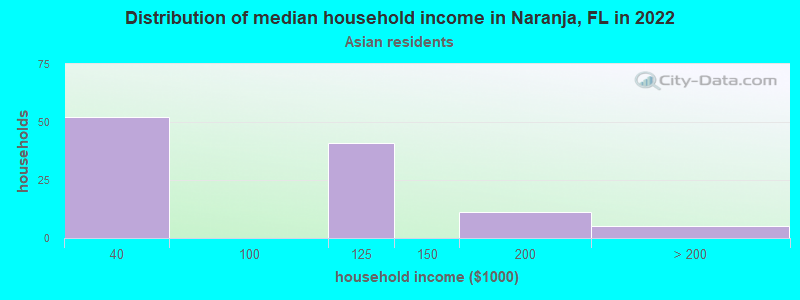
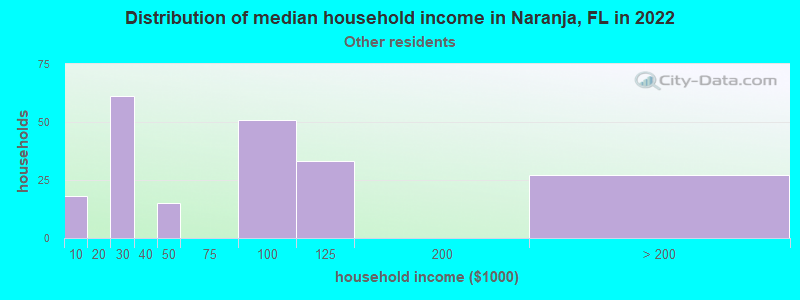
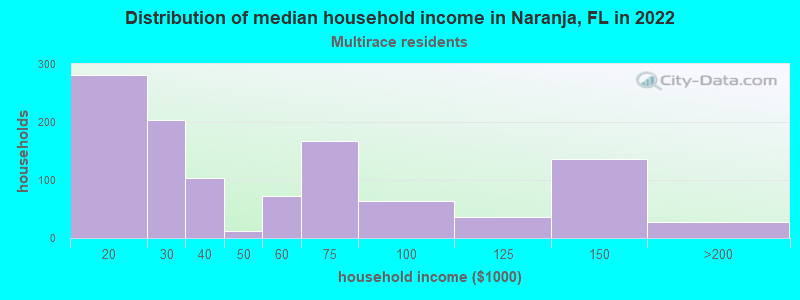
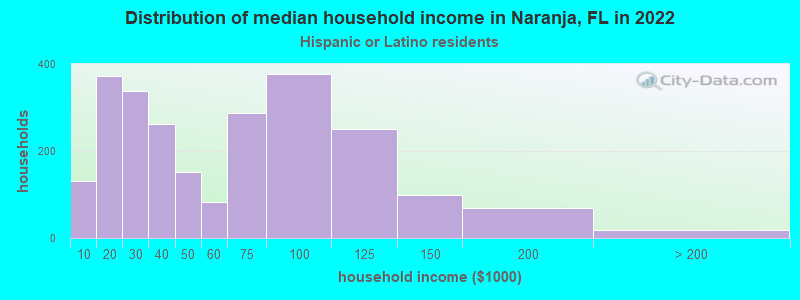
Income and house value in Naranja Median household income in 2022 $82,395 White non-Hispanic householders$37,817 Black householders$38,298 Two or more races householders$46,142 Hispanic or Latino race householdersMedian 2022 house value $396,925 White Non-Hispanic householders$345,015 Black or African American householders $393,255 Asian householders$340,821 Some other race householders$348,161 Hispanic or Latino householders
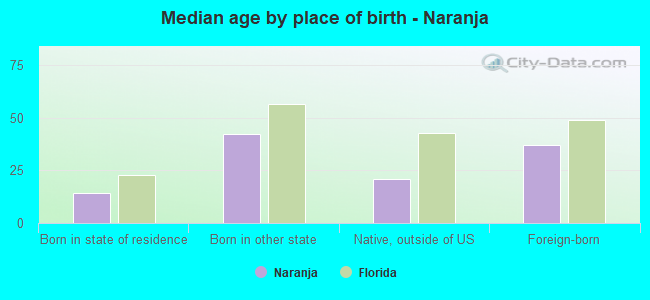
Median age by race in Naranja
28.8 Median age for White residents29.3 28.7 29.0 Median age for Black or African American residents29.4 29.0 -653,446,647.1 Median age for American Indian / Alaska Native residents-543,352,600.6 -762,696,213.5 45.7 Median age for Asian residents21.9 44.3 -679,849,340.2 Median age for Native Hawaiian / Pacific Islander residents-858,307,848.3 -443,298,968.6 22.9 Median age for Other race residents22.6 27.1 33.2 Median age for Two or more races residents34.4 28.5 18.9 Median age for White alone residents15.5 30.7 32.5 Median age for Hispanic or Latino residents33.1 30.8
Owner/renter occupied households by race in Naranja
House owners and renters - White residents 321 31.4% Owner occupied703 68.6% Renter occupiedHouse owners and renters - Black or African American residents 267 18.5% Owner occupied1,175 81.5% Renter occupiedHouse owners and renters - American Indian / Alaska Native residents 24 53.3% Owner occupied21 46.7% Renter occupiedHouse owners and renters - Asian residents 15 13.7% Owner occupied93 86.3% Renter occupiedHouse owners and renters - Other race residents 69 32.0% Owner occupied147 68.0% Renter occupiedHouse owners and renters - Two or more races residents 442 39.5% Owner occupied676 60.5% Renter occupiedHouse owners and renters - White alone residents 76 22.9% Owner occupied256 77.1% Renter occupiedHouse owners and renters - Hispanic or Latino residents 805 32.5% Owner occupied1,669 67.5% Renter occupied
Language usage in Naranja
English speakers - Total 44.9% of residents of Naranja speak English at home.
51.7% of residents speak Spanish at home 2,394 39.4% Speak English very well3,689 60.6% Speak English less than very well3.6% of residents speak other language at home 280 65.4% Speak English very well148 34.6% Speak English less than very well
English speakers - Born in the United States 81.7% of residents of Naranja speak English at home.
16.1% of residents speak Spanish at home 126 100.0% Speak English very well1.8% of residents speak other language at home 14 100.0% Speak English very well
English speakers - Native, born elsewhere 51.7% of residents of Naranja speak English at home.
47.0% of residents speak Spanish at home 50 33.1% Speak English very well101 66.9% Speak English less than very well8.4% of residents speak other language at home 10 37.0% Speak English very well17 63.0% Speak English less than very well
English speakers - Foreign-born 15.3% of residents of Naranja speak English at home.
79.4% of residents speak Spanish at home 999 22.6% Speak English very well3,416 77.4% Speak English less than very well6.1% of residents speak other language at home 212 62.2% Speak English very well129 37.8% Speak English less than very well
White (Caucasian) - Speak only English Native:
69.9% (933)Foreign-born:
7.2% (88)
White (Caucasian) - Speak another language Native:
35.3% (471)Foreign-born:
91.9% (1,121)
Black or African American - Speak only English Native:
92.2% (3,012)Foreign-born:
86.7% (468)
Black or African American - Speak another language Native:
7.8% (255)Foreign-born:
19.3% (104)
American Indian / Alaska Native - Speak another language Native:
100.0% (16)Foreign-born:
98.3% (33)
Other race - Speak only English Native:
36.1% (189)Foreign-born:
4.8% (20)
Other race - Speak another language Native:
64.1% (335)Foreign-born:
95.3% (403)
Two or more races - Speak only English Native:
17.2% (149)Foreign-born:
6.0% (155)
Two or more races - Speak another language Native:
82.8% (716)Foreign-born:
94.2% (2,442)
White alone - Speak another language Native:
4.6% (34)Foreign-born:
93.5% (282)
Hispanic or Latino - Speak only English Native:
27.3% (612)Foreign-born:
5.4% (249)
Hispanic or Latino - Speak another language Native:
73.2% (1,643)Foreign-born:
94.6% (4,330)
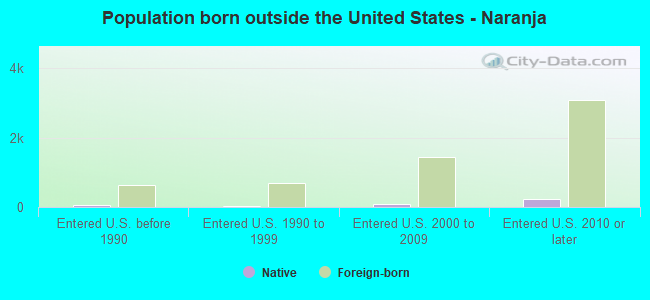
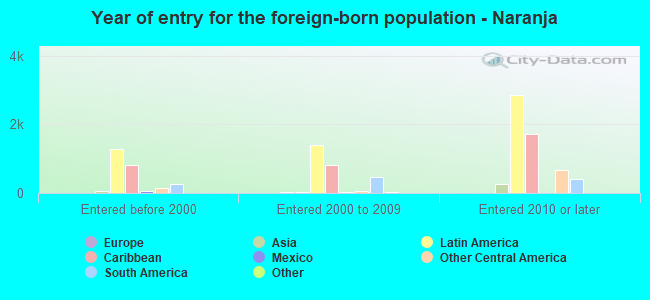
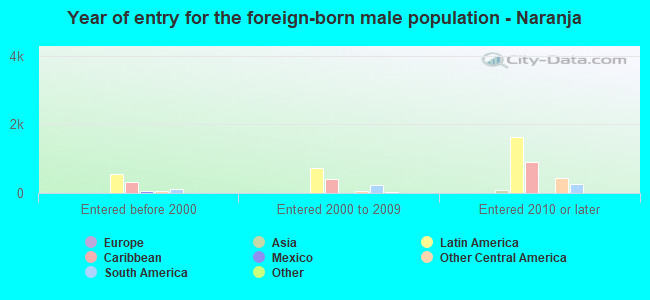
Foreign-born residents in Naranja 5,587 residents are foreign born (39.5% Latin America ).
This city:
42.4%Florida:
21.1%
Marital status for residents in Naranja Marital status - White (Caucasian) population 15 years and over
Males 48.7% Never married39.9% Now married0.1% Separated2.1% Widowed9.2% DivorcedFemales 38.2% Never married39.0% Now married2.3% Separated1.9% Widowed18.7% DivorcedWomen who gave birth in the past 12 months Now married:
0.0% (0)Unmarried:
100.0% (20)
Women who did not give birth in the past 12 months Now married:
28.9% (183)Unmarried:
71.1% (450)
Marital status - Black or African American population 15 years and over
Males 69.5% Never married26.8% Now married1.3% Separated0.0% Widowed2.4% DivorcedFemales 66.5% Never married15.6% Now married6.4% Separated5.0% Widowed6.5% DivorcedWomen who gave birth in the past 12 months Now married:
0.0% (0)Unmarried:
100.0% (50)
Women who did not give birth in the past 12 months Now married:
16.2% (216)Unmarried:
83.8% (1,121)
Marital status - Asian population 15 years and over
Males 54.2% Never married45.8% Now married0.0% Separated0.0% Widowed0.0% DivorcedFemales 36.6% Never married3.2% Now married0.0% Separated0.0% Widowed60.2% DivorcedWomen who did not give birth in the past 12 months Now married:
0.0% (0)Unmarried:
100.0% (94)
Marital status - Other race population 15 years and over
Males 51.7% Never married43.4% Now married0.0% Separated0.0% Widowed5.0% DivorcedFemales 27.9% Never married60.1% Now married0.0% Separated0.0% Widowed12.0% DivorcedWomen who did not give birth in the past 12 months Now married:
62.0% (155)Unmarried:
38.0% (95)
Marital status - Two or more races population 15 years and over
Males 26.8% Never married55.7% Now married6.4% Separated0.0% Widowed11.1% DivorcedFemales 41.5% Never married48.2% Now married5.0% Separated3.1% Widowed2.2% DivorcedWomen who gave birth in the past 12 months Now married:
0.0% (0)Unmarried:
100.0% (49)
Women who did not give birth in the past 12 months Now married:
51.2% (623)Unmarried:
48.8% (592)
Marital status - White alone, not Hispanic / Latino population 15 years and over
Males 57.2% Never married24.4% Now married0.0% Separated3.9% Widowed14.4% DivorcedFemales 12.7% Never married20.3% Now married0.0% Separated0.0% Widowed67.0% DivorcedWomen who gave birth in the past 12 months Now married:
0.0% (0)Unmarried:
100.0% (13)
Women who did not give birth in the past 12 months Now married:
22.0% (59)Unmarried:
78.0% (208)
Marital status - Hispanic or Latino population 15 years and over
Males 44.9% Never married44.3% Now married1.9% Separated0.9% Widowed8.0% DivorcedFemales 41.2% Never married45.1% Now married3.2% Separated3.8% Widowed6.7% DivorcedWomen who gave birth in the past 12 months Now married:
0.0% (0)Unmarried:
100.0% (53)
Women who did not give birth in the past 12 months Now married:
41.8% (784)Unmarried:
58.2% (1,094)
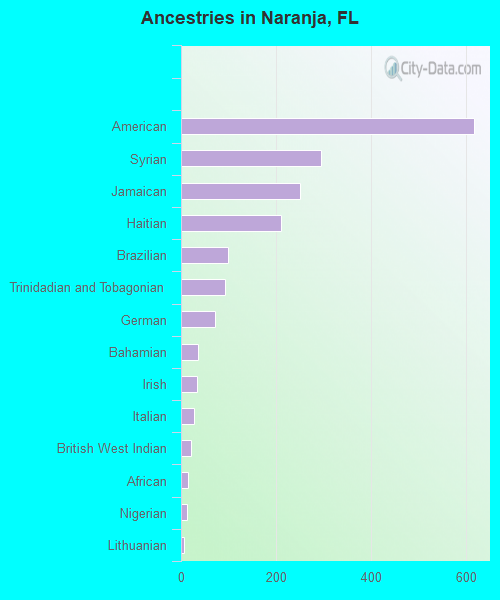
Ancestries in Naranja
618 6.7% American295 3.2% Syrian251 2.7% Jamaican210 2.3% Haitian98 1.1% Brazilian92 1.0% Trinidadian and Tobagonian72 0.8% German35 0.4% Bahamian34 0.4% Irish28 0.3% Italian22 0.2% British West Indian14 0.2% African13 0.1% Nigerian6 0.07% Lithuanian
Children Nativity (place of birth) in Naranja
Children under 6 years - Living with two parents Both parents native 35 100.0% NativeBoth parents foreign-born 254 100.0% NativeOne native, one foreign-born parent 167 100.0% NativeChildren under 6 years - Living with one parent Native parent 616 100.0% NativeForeign-born parent 519 100.0% NativeChildren 6 to 17 years - Living with two parents Both parents native 266 97.7% Native6 2.3% Foreign-bornBoth parents foreign-born 401 60.4% Native262 39.6% Foreign-bornOne native, one foreign-born parent 97 100.0% NativeChildren 6 to 17 years - Living with one parent Native parent 792 100.0% NativeForeign-born parent 552 62.4% Native332 37.6% Foreign-born
Grandparents responsible for own grandchildren in Naranja
Grandparents (30 to 59 years) White / Caucasian 41 69.7% Responsible for grandchildren18 30.3% Not responsible for grandchildrenBlack or African American 4 26.9% Responsible for grandchildren11 73.1% Not responsible for grandchildrenWhite alone, not Hispanic / Latino 9 100.0% Not responsible for grandchildrenHispanic or Latino 70 80.9% Responsible for grandchildren17 19.1% Not responsible for grandchildrenGrandparents (60 years and over) White / Caucasian 32 100.0% Not responsible for grandchildrenBlack or African American 31 34.9% Responsible for grandchildren58 65.1% Not responsible for grandchildrenWhite alone, not Hispanic / Latino 7 100.0% Not responsible for grandchildrenHispanic or Latino 53 100.0% Not responsible for grandchildren