Races in Nederland, Texas (TX) Detailed Stats
Ancestries, Foreign-born residents, place of birth
Settings
X


Recent posts about races in Nederland, Texas on our local forum with over 2,400,000 registered users:
 | Where all in Texas have y'all lived??? (62 replies) |
| Is Dallas green with trees? Are people friendly? (161 replies) |
| Questions about Beaumont, TX (18 replies) |
| Need information on the Beaumont area (13 replies) |
| Anyone from Denver move to Dallas (113 replies) |
| Moving to southeast Texas (orange area) (14 replies) |
Latest news about races in Nederland, TX collected exclusively by city-data.com from local newspapers, TV, and radio stations
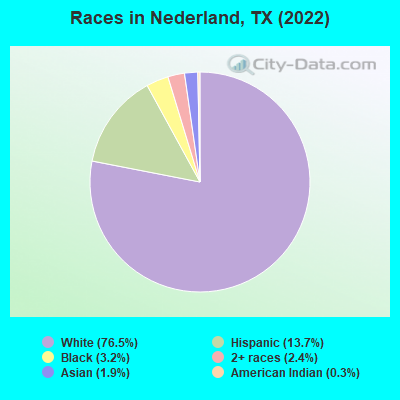
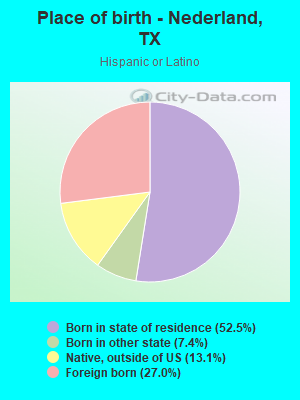
According to 2022 data, the most numerous races in Nederland, TX are Hispanic (2,504 residents), White alone (13,976 residents), and Black alone (579 residents). 86.5% of Nederland residents speak English at home. 5.8% of Nederland, TX residents are foreign-born (3.8% born in Latin America, 1.6% born in Asia), which is 195.5% less than the foreign-born rate of 17.0% across the entire state of Texas.
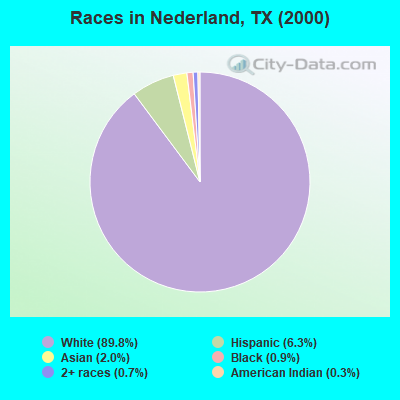
Race distribution in Nederland
2000
2022

- 15,64289.8%White alone
- 1,0896.3%Hispanic
- 3522.0%Asian alone
- 1510.9%Black alone
- 1260.7%Two or more races
- 470.3%American Indian alone
- 80.05%Other race alone
- 70.04%Native Hawaiian and Other
Pacific Islander alone
-
- 13,97676.5%White alone
- 2,50413.7%Hispanic
- 5793.2%Black alone
- 4312.4%Two or more races
- 3411.9%Asian alone
- 600.3%American Indian alone
2000
2022
-
- 10,933,31352.4%White alone
- 6,669,66632.0%Hispanic
- 2,364,25511.3%Black alone
- 554,4452.7%Asian alone
- 230,5671.1%Two or more races
- 68,8590.3%American Indian alone
- 19,9580.10%Other race alone
- 10,7570.05%Native Hawaiian and Other
Pacific Islander alone

-
- 12,070,64240.2%Hispanic
- 11,683,43038.9%White alone
- 3,508,70611.7%Black alone
- 1,608,1735.4%Asian alone
- 956,5603.2%Two or more races
- 125,7630.4%Other race alone
- 47,0230.2%American Indian alone
- 29,2750.10%Native Hawaiian and Other
Pacific Islander alone

Income and house value in Nederland
- Median household income in 2022
- $76,511White non-Hispanic householders
- $43,415Black householders
- $174,353Asian householders
- $70,109Two or more races householders
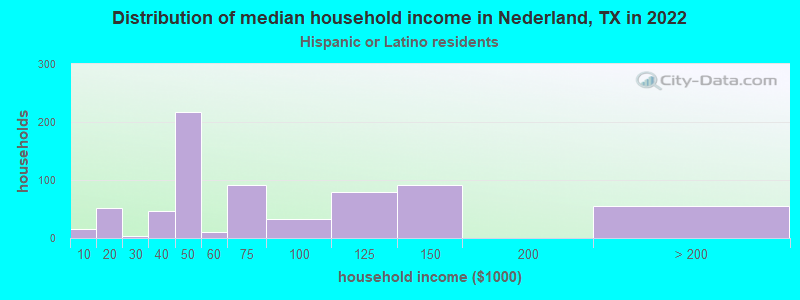
- $75,962Hispanic or Latino race householders
- Median 2022 house value
- $188,946White Non-Hispanic householders
- $183,085Black or African American householders
- $235,554American Indian or Alaska Native householders
- $379,846Asian householders
- $248,951Some other race householders
- $181,410Two or more races householders
- $227,740Hispanic or Latino householders
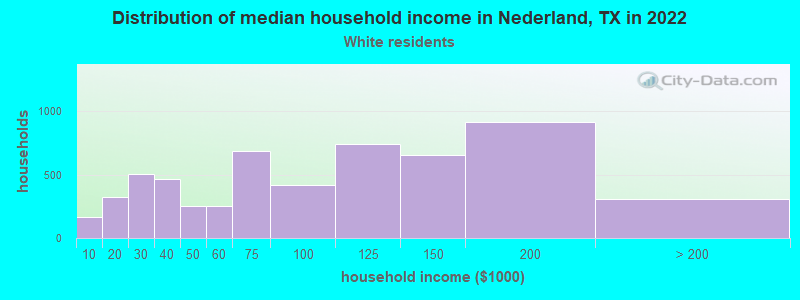
Household income for White non-Hispanic householders
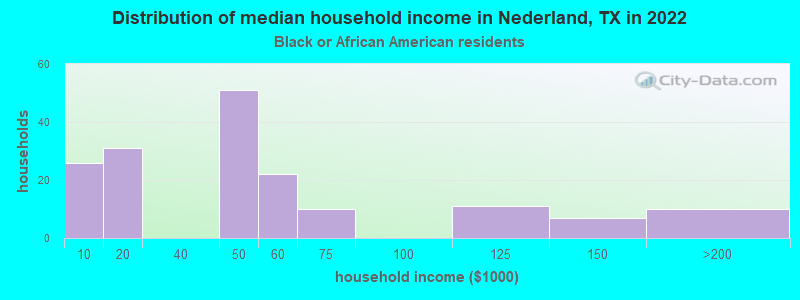
Household income for Black householders
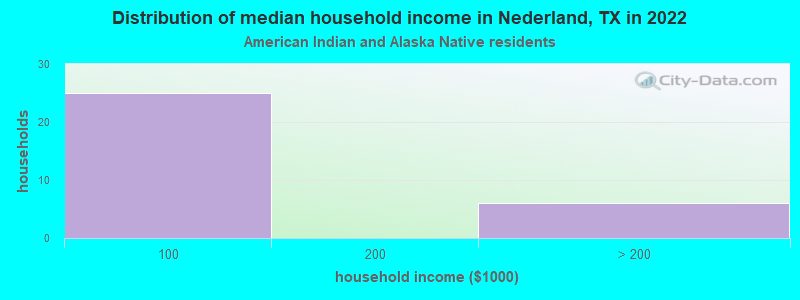
Household income for American Indian and Alaska Native householders
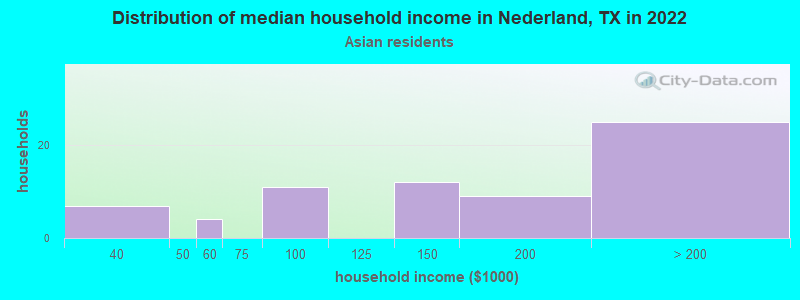
Household income for Asian householders
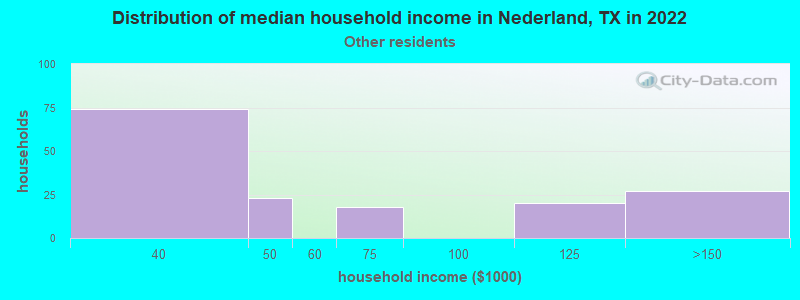
Household income for Some other race householders
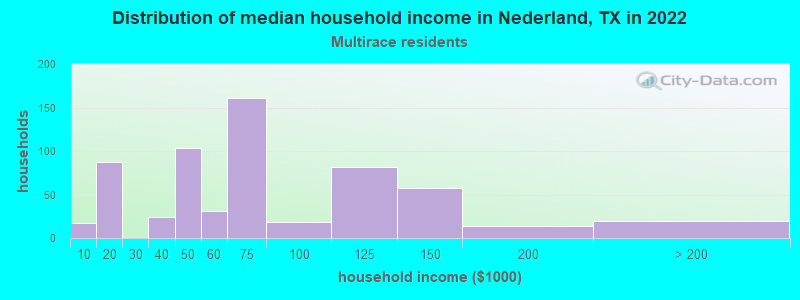
Household income for Two or more races householders
Household income for Hispanic or Latino race householders
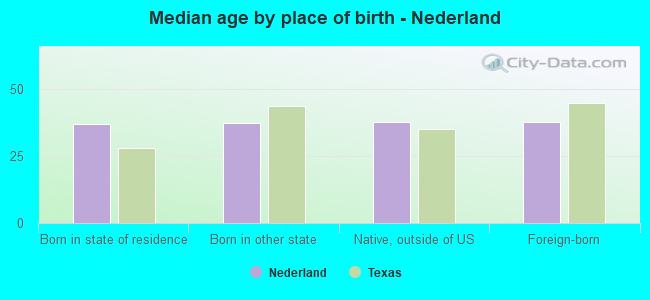
Median age by race in Nederland
- 41.3Median age for White residents
- 38.4Males
- 44.4Females
- 30.3Median age for Black or African American residents
- 28.4Males
- 36.2Females
- 32.4Median age for American Indian / Alaska Native residents
- -682,445,758.7Males
- 32.4Females
- 35.4Median age for Asian residents
- 39.4Males
- 29.7Females
- -581,560,283.1Median age for Native Hawaiian / Pacific Islander residents
- -666,666,666.0Males
- -577,777,777.2Females
- 16.6Median age for Other race residents
- 30.3Males
- 7.3Females
- 34.6Median age for Two or more races residents
- 39.7Males
- 30.3Females
- 39.6Median age for White alone residents
- 37.2Males
- 41.8Females
- 30.3Median age for Hispanic or Latino residents
- 35.4Males
- 24.0Females
Owner/renter occupied households by race in Nederland
- House owners and renters - White residents
- 4,21375.0%Owner occupied
- 1,40825.0%Renter occupied
- House owners and renters - Black or African American residents
- 239.9%Owner occupied
- 20890.1%Renter occupied
- House owners and renters - American Indian / Alaska Native residents
- 618.6%Owner occupied
- 2681.4%Renter occupied
- House owners and renters - Asian residents
- 4762.7%Owner occupied
- 2837.3%Renter occupied
- House owners and renters - Other race residents
- 14083.0%Owner occupied
- 2917.0%Renter occupied
- House owners and renters - Two or more races residents
- 44867.4%Owner occupied
- 21732.6%Renter occupied
- House owners and renters - White alone residents
- 4,41674.8%Owner occupied
- 1,48925.2%Renter occupied
- House owners and renters - Hispanic or Latino residents
- 45966.3%Owner occupied
- 23333.7%Renter occupied
Language usage in Nederland
- English speakers - Total
- 86.5% of residents of Nederland speak English at home.
- 9.6% of residents speak Spanish at home
- 1,05163.3%Speak English very well
- 60936.7%Speak English less than very well
- 3.8% of residents speak other language at home
- 36755.7%Speak English very well
- 29244.3%Speak English less than very well
- English speakers - Born in the United States
- 92.7% of residents of Nederland speak English at home.
- 4.2% of residents speak Spanish at home
- 15791.8%Speak English very well
- 148.2%Speak English less than very well
- 4.0% of residents speak other language at home
- 4728.3%Speak English very well
- 11971.7%Speak English less than very well
- English speakers - Native, born elsewhere
- 0.0% of residents of Nederland speak English at home.
- 94.9% of residents speak Spanish at home
- 13259.2%Speak English very well
- 9140.8%Speak English less than very well
- 14.0% of residents speak other language at home
- 39.1%Speak English very well
- 3090.9%Speak English less than very well
- English speakers - Foreign-born
- 10.2% of residents of Nederland speak English at home.
- 61.2% of residents speak Spanish at home
- 21435.5%Speak English very well
- 38964.5%Speak English less than very well
- 28.7% of residents speak other language at home
- 15755.5%Speak English very well
- 12644.5%Speak English less than very well
White (Caucasian) - Speak only English
| Native: | 100.0% (12,724) |
| Foreign-born: | 28.4% (24) |
White (Caucasian) - Speak another language
| Native: | 2.1% (272) |
| Foreign-born: | 68.5% (59) |
Asian - Speak only English
| Native: | 31.0% (20) |
| Foreign-born: | 14.8% (41) |
Asian - Speak another language
| Native: | 67.0% (42) |
| Foreign-born: | 85.3% (237) |
Other race - Speak only English
| Native: | 19.6% (104) |
| Foreign-born: | 2.3% (6) |
Other race - Speak another language
| Native: | 77.5% (412) |
| Foreign-born: | 97.9% (256) |
Two or more races - Speak only English
| Native: | 52.0% (799) |
| Foreign-born: | 7.9% (42) |
Two or more races - Speak another language
| Native: | 48.1% (740) |
| Foreign-born: | 91.6% (484) |
White alone - Speak only English
| Native: | 98.3% (13,028) |
| Foreign-born: | 15.6% (6) |
White alone - Speak another language
| Native: | 1.6% (211) |
| Foreign-born: | 93.4% (38) |
Hispanic or Latino - Speak only English
| Native: | 45.1% (740) |
| Foreign-born: | 10.2% (69) |
Hispanic or Latino - Speak another language
| Native: | 56.2% (922) |
| Foreign-born: | 90.3% (612) |
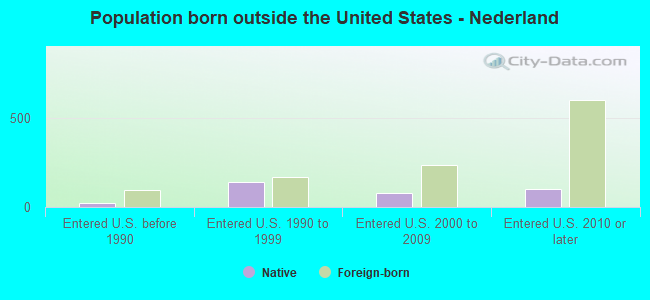
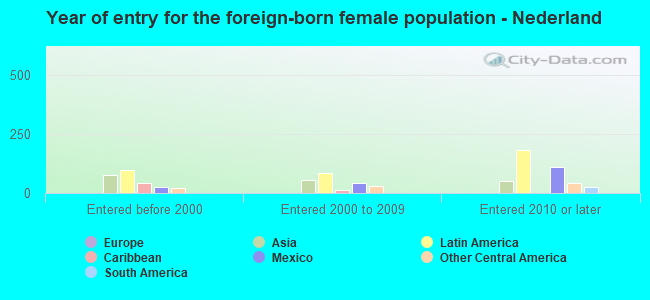
Foreign-born residents in Nederland
1,051 residents are foreign born (3.8% Latin America, 1.6% Asia).
| This city: | 5.8% |
| Texas: | 17.1% |
Marital status for residents in Nederland
Marital status - White (Caucasian) population 15 years and over
- Males
- 31.6%Never married
- 53.9%Now married
- 1.6%Separated
- 2.6%Widowed
- 10.4%Divorced
- Females
- 17.1%Never married
- 50.3%Now married
- 1.5%Separated
- 13.2%Widowed
- 17.9%Divorced
Women who gave birth in the past 12 months
| Now married: | 100.0% (39) |
| Unmarried: | 0.0% (0) |
Women who did not give birth in the past 12 months
| Now married: | 52.5% (1,281) |
| Unmarried: | 47.5% (1,161) |
Marital status - Black or African American population 15 years and over
- Males
- 75.1%Never married
- 24.9%Now married
- 0.0%Separated
- 0.0%Widowed
- 0.0%Divorced
- Females
- 49.3%Never married
- 45.2%Now married
- 0.0%Separated
- 5.5%Widowed
- 0.0%Divorced
Women who did not give birth in the past 12 months
| Now married: | 39.6% (54) |
| Unmarried: | 60.4% (82) |
Marital status - Asian population 15 years and over
- Males
- 32.4%Never married
- 56.9%Now married
- 0.0%Separated
- 0.0%Widowed
- 10.8%Divorced
- Females
- 48.5%Never married
- 32.2%Now married
- 0.0%Separated
- 8.2%Widowed
- 11.1%Divorced
Women who did not give birth in the past 12 months
| Now married: | 30.3% (42) |
| Unmarried: | 69.7% (97) |
Marital status - Other race population 15 years and over
- Males
- 13.7%Never married
- 55.9%Now married
- 0.0%Separated
- 0.0%Widowed
- 30.5%Divorced
- Females
- 47.1%Never married
- 45.3%Now married
- 0.0%Separated
- 7.6%Widowed
- 0.0%Divorced
Women who did not give birth in the past 12 months
| Now married: | 44.5% (102) |
| Unmarried: | 55.5% (127) |
Marital status - Two or more races population 15 years and over
- Males
- 22.9%Never married
- 67.8%Now married
- 0.0%Separated
- 0.0%Widowed
- 9.3%Divorced
- Females
- 34.6%Never married
- 53.5%Now married
- 0.0%Separated
- 5.7%Widowed
- 6.2%Divorced
Women who did not give birth in the past 12 months
| Now married: | 55.4% (326) |
| Unmarried: | 44.6% (262) |
Marital status - White alone, not Hispanic / Latino population 15 years and over
- Males
- 32.0%Never married
- 53.7%Now married
- 1.4%Separated
- 2.7%Widowed
- 10.2%Divorced
- Females
- 17.2%Never married
- 49.7%Now married
- 1.5%Separated
- 13.7%Widowed
- 17.8%Divorced
Women who gave birth in the past 12 months
| Now married: | 100.0% (45) |
| Unmarried: | 0.0% (0) |
Women who did not give birth in the past 12 months
| Now married: | 51.8% (1,425) |
| Unmarried: | 48.2% (1,328) |
Marital status - Hispanic or Latino population 15 years and over
- Males
- 17.8%Never married
- 64.4%Now married
- 1.5%Separated
- 0.0%Widowed
- 16.3%Divorced
- Females
- 27.5%Never married
- 57.4%Now married
- 0.0%Separated
- 5.1%Widowed
- 10.0%Divorced
Women who did not give birth in the past 12 months
| Now married: | 58.2% (327) |
| Unmarried: | 41.8% (235) |
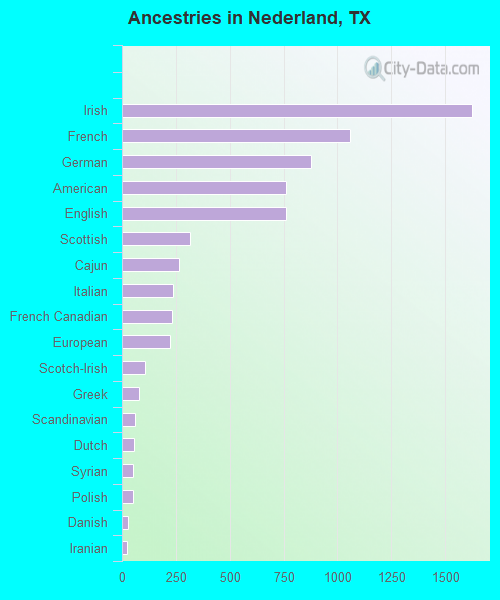
Ancestries in Nederland

- 1,62316.8%Irish
- 1,05911.0%French
- 8779.1%German
- 7627.9%American
- 7607.9%English
- 3183.3%Scottish
- 2652.8%Cajun
- 2392.5%Italian
- 2312.4%French Canadian
- 2232.3%European
- 1071.1%Scotch-Irish
- 800.8%Greek
- 610.6%Scandinavian
- 540.6%Dutch
- 530.6%Syrian
- 510.5%Polish
- 270.3%Danish
- 230.2%Iranian
- 140.1%British
- 130.1%Eastern European
- 130.1%Finnish
- 90.09%Northern European
- 80.08%Hungarian
- 80.08%Norwegian
- 70.07%Welsh
- 50.05%Czech
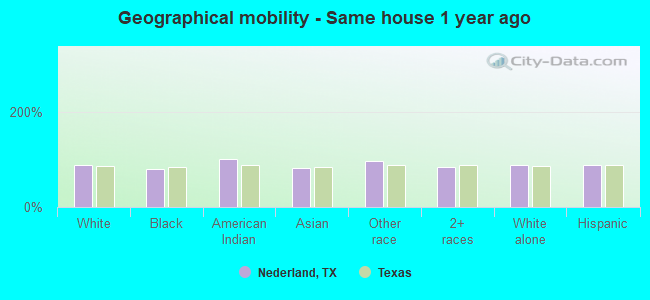
Geographical mobility in Nederland

- Same house 1 year ago
- 11,10486.6%White (Caucasian)
- 47080.2%Black or African American
- 111100.0%American Indian / Alaska Native
- 29381.1%Asian
- 90996.8%Other race
- 1,64783.3%Two or more races
- 12,20687.6%White alone, not Hispanic / Latino
- 2,24189.1%Hispanic or Latino
-
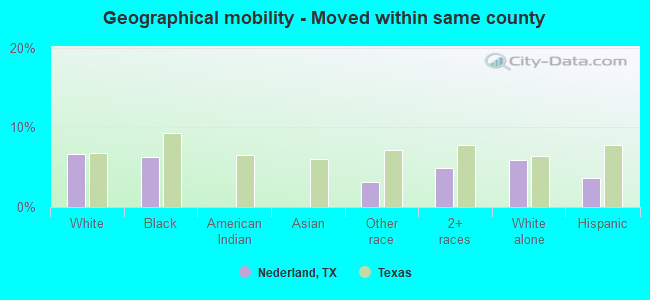
- Moved within same county
- 8486.6%White / Caucasian
- 376.3%Black or African American
- 293.1%Other race
- 964.9%Two or more races
- 8215.9%White alone, not Hispanic / Latino
- 933.7%Hispanic or Latino
-
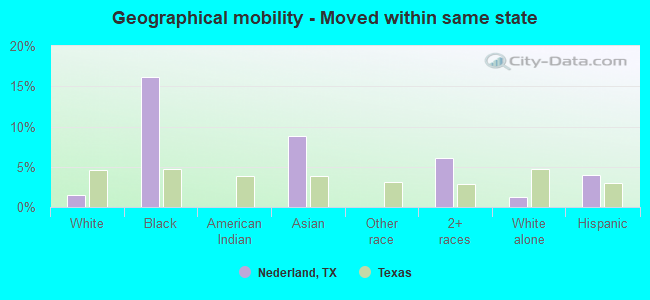
- Moved within same state
- 1931.5%White / Caucasian
- 9416.1%Black or African American
- 328.8%Asian
- 1196.0%Two or more races
- 1761.3%White alone, not Hispanic / Latino
- 1004.0%Hispanic or Latino
-
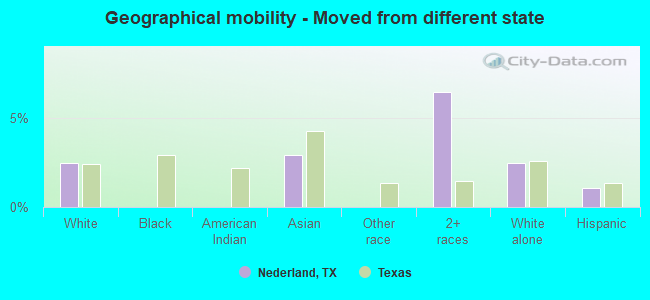
- Moved from different state
- 3182.5%White / Caucasian
- 112.9%Asian
- 1276.4%Two or more races
- 3452.5%White alone, not Hispanic / Latino
- 261.0%Hispanic or Latino
-
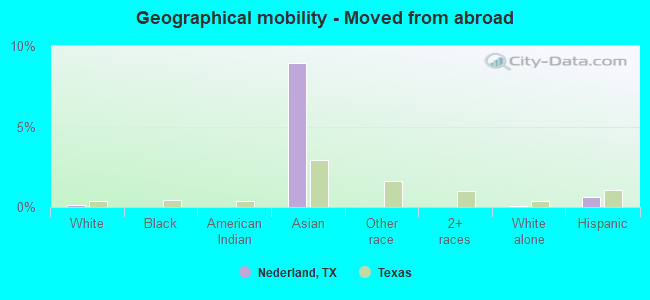
- Moved from abroad
- 140.1%White
- 329.0%Asian
- 90.1%White alone, not Hispanic / Latino
- 150.6%Hispanic or Latino
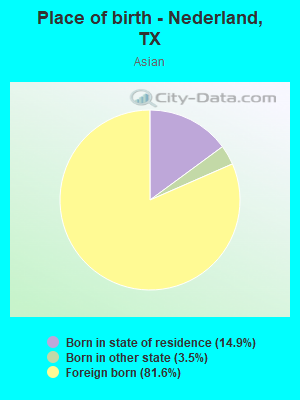
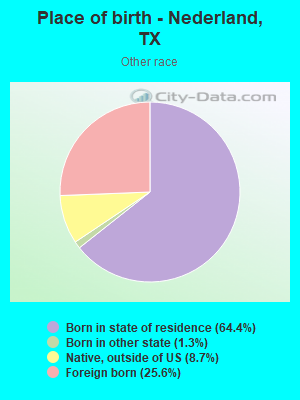
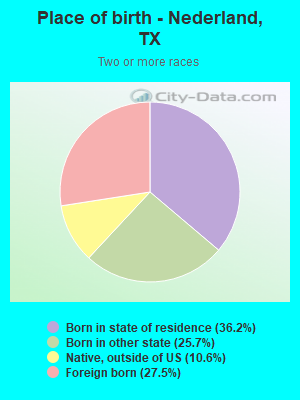
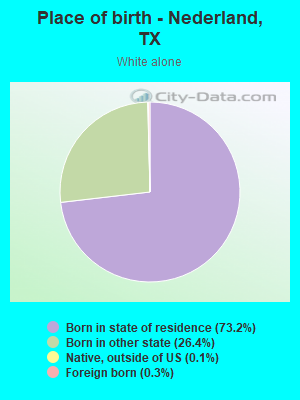
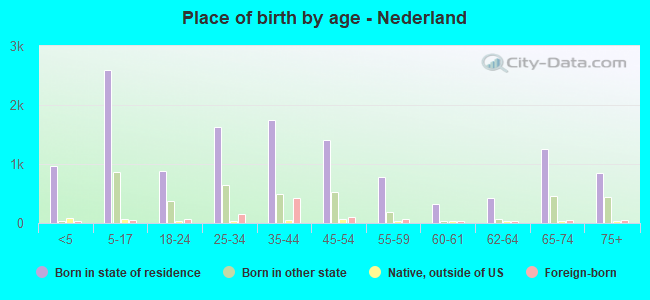
Children Nativity (place of birth) in Nederland
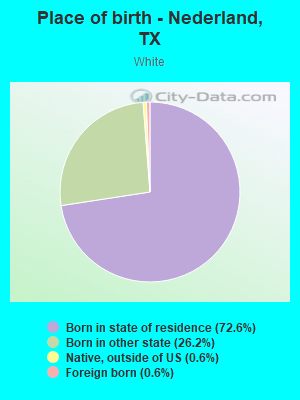
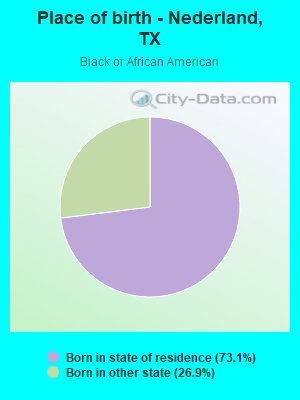
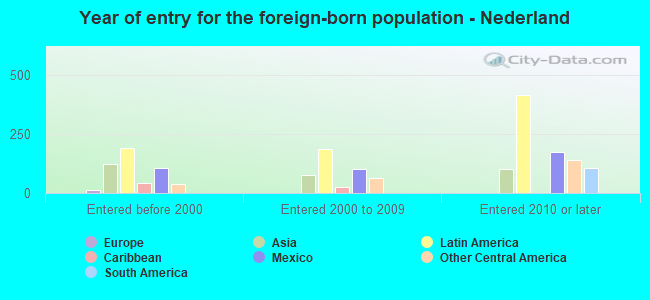
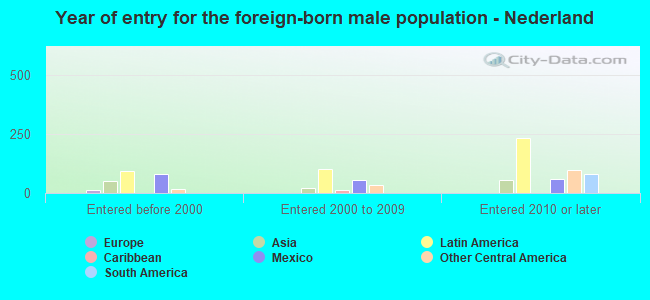
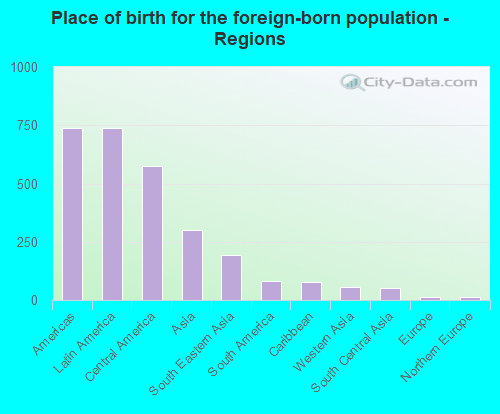
Place of birth for residents in Nederland
![Place of birth for the foreign-born population - Regions]()
- 737Americas
- 737Latin America
- 577Central America
- 300Asia
- 192South Eastern Asia
- 81South America
- 78Caribbean
- 56Western Asia
- 50South Central Asia
- 13Europe
- 13Northern Europe
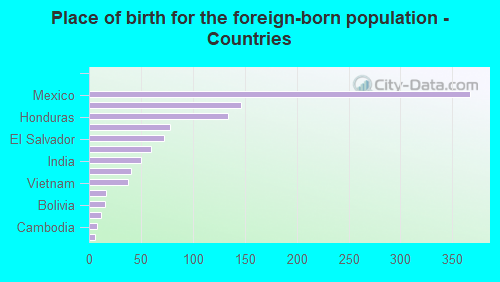
![Place of birth for the foreign-born population - Countries]()
- 367Mexico
- 146Philippines
- 134Honduras
- 78Cuba
- 72El Salvador
- 60Peru
- 50India
- 40Syria
- 38Vietnam
- 16United Arab Emirates
- 15Bolivia
- 12Denmark
- 8Cambodia
- 6Guyana
- 2Panama
- 1Ireland
Grandparents responsible for own grandchildren in Nederland
Zip codes: 77651.