Races in New Albany, Indiana (IN) Detailed Stats
Data:
Races - White alone (%)
Races - White alone (% change since 2000)
Races - Black alone (%)
Races - Black alone (% change since 2000)
Races - American Indian alone (%)
Races - American Indian alone (% change since 2000)
Races - Asian alone (%)
Races - Asian alone (% change since 2000)
Races - Hispanic (%)
Races - Hispanic (% change since 2000)
Races - Native Hawaiian and Other Pacific Islander alone (%)
Races - Native Hawaiian and Other Pacific Islander alone (% change since 2000)
Races - Two or more races(%)
Races - Two or more races(% change since 2000)
Races - Other race alone (%)
Races - Other race alone (% change since 2000)
Racial diversity
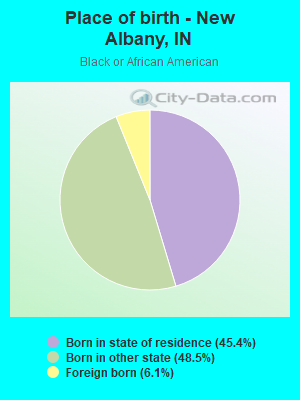
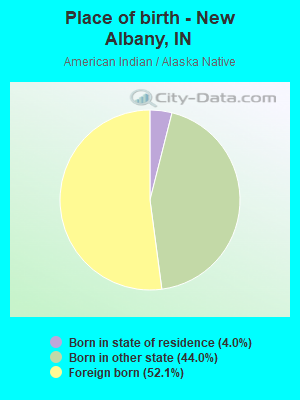
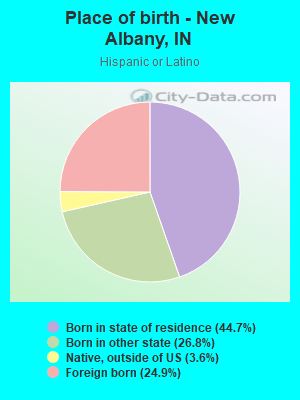
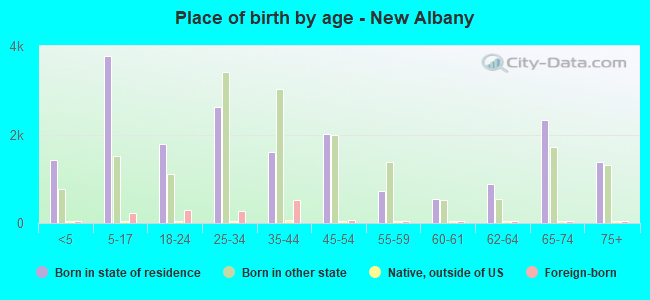
Place of birth - Born in state of residence (%)
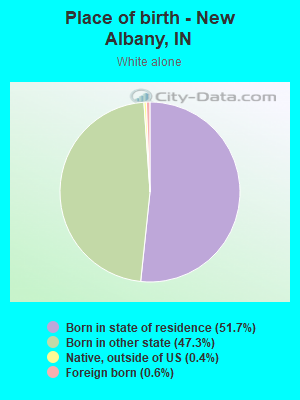
Place of birth - Born in state of residence (%) - White
Place of birth - Born in state of residence (%) - Black or African American
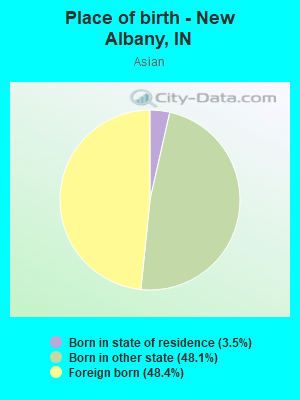
Place of birth - Born in state of residence (%) - Asian
Place of birth - Born in state of residence (%) - Hispanic or Latino
Place of birth - Born in state of residence (%) - American Indian and Alaska Native
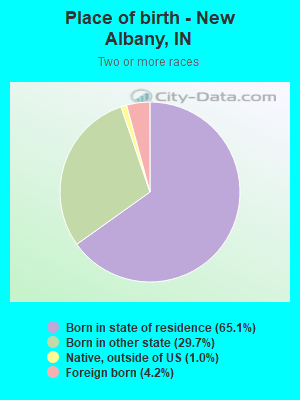
Place of birth - Born in state of residence (%) - Multirace
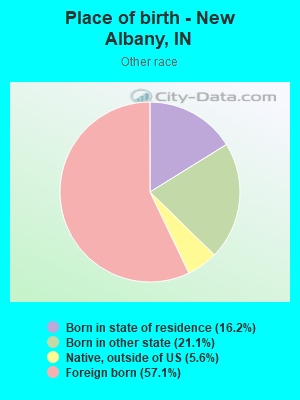
Place of birth - Born in state of residence (%) - Other Race
Place of birth - Born in other state (%)
Place of birth - Born in other state (%) - White
Place of birth - Born in other state (%) - Black or African American
Place of birth - Born in other state (%) - Asian
Place of birth - Born in other state (%) - Hispanic or Latino
Place of birth - Born in other state (%) - American Indian and Alaska Native
Place of birth - Born in other state (%) - Multirace
Place of birth - Born in other state (%) - Other Race
Place of birth - Native, outside of US (%)
Place of birth - Native, outside of US (%) - White
Place of birth - Native, outside of US (%) - Black or African American
Place of birth - Native, outside of US (%) - Asian
Place of birth - Native, outside of US (%) - Hispanic or Latino
Place of birth - Native, outside of US (%) - American Indian and Alaska Native
Place of birth - Native, outside of US (%) - Multirace
Place of birth - Native, outside of US (%) - Other Race
Place of birth - Foreign born (%)
Place of birth - Foreign born (%) - White
Place of birth - Foreign born (%) - Black or African American
Place of birth - Foreign born (%) - Asian
Place of birth - Foreign born (%) - Hispanic or Latino
Place of birth - Foreign born (%) - American Indian and Alaska Native
Place of birth - Foreign born (%) - Multirace
Place of birth - Foreign born (%) - Other Race
Residents speaking English at home (%)
Residents speaking English at home - Born in the United States (%)
Residents speaking English at home - Native, born elsewhere (%)
Residents speaking English at home - Foreign born (%)
Residents speaking Spanish at home (%)
Residents speaking Spanish at home - Born in the United States (%)
Residents speaking Spanish at home - Native, born elsewhere (%)
Residents speaking Spanish at home - Foreign born (%)
Residents speaking other language at home (%)
Residents speaking other language at home - Born in the United States (%)
Residents speaking other language at home - Native, born elsewhere (%)
Residents speaking other language at home - Foreign born (%)
Marital status - Never married (%)
Marital status - Now married (%)
Marital status - Separated (%)
Marital status - Widowed (%)
Marital status - Divorced (%)
Ancestries Reported - Arab (%)
Ancestries Reported - Czech (%)
Ancestries Reported - Danish (%)
Ancestries Reported - Dutch (%)
Ancestries Reported - English (%)
Ancestries Reported - French (%)
Ancestries Reported - French Canadian (%)
Ancestries Reported - German (%)
Ancestries Reported - Greek (%)
Ancestries Reported - Hungarian (%)
Ancestries Reported - Irish (%)
Ancestries Reported - Italian (%)
Ancestries Reported - Lithuanian (%)
Ancestries Reported - Norwegian (%)
Ancestries Reported - Polish (%)
Ancestries Reported - Portuguese (%)
Ancestries Reported - Russian (%)
Ancestries Reported - Scotch-Irish (%)
Ancestries Reported - Scottish (%)
Ancestries Reported - Slovak (%)
Ancestries Reported - Subsaharan African (%)
Ancestries Reported - Swedish (%)
Ancestries Reported - Swiss (%)
Ancestries Reported - Ukrainian (%)
Ancestries Reported - United States (%)
Ancestries Reported - Welsh (%)
Ancestries Reported - West Indian (%)
Ancestries Reported - Other (%)
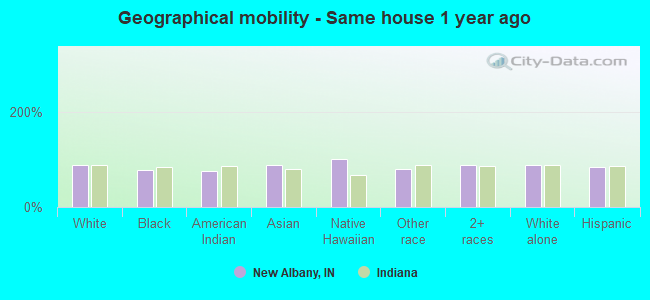
Geographical mobility - Same house 1 year ago (%)
Geographical mobility - Same house 1 year ago (%) - White
Geographical mobility - Same house 1 year ago (%) - Black or African American
Geographical mobility - Same house 1 year ago (%) - Asian
Geographical mobility - Same house 1 year ago (%) - Hispanic or Latino
Geographical mobility - Same house 1 year ago (%) - American Indian and Alaska Native
Geographical mobility - Same house 1 year ago (%) - Multirace
Geographical mobility - Same house 1 year ago (%) - Other Race
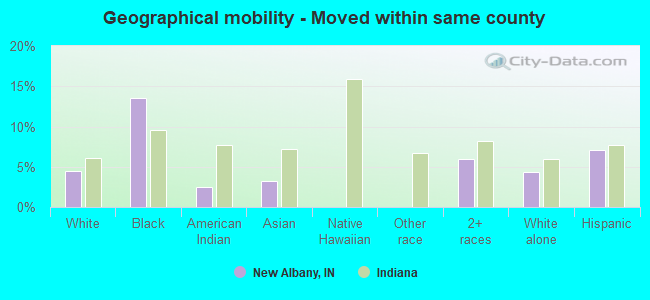
Geographical mobility - Moved within same county (%)
Geographical mobility - Moved within same county (%) - White
Geographical mobility - Moved within same county (%) - Black or African American
Geographical mobility - Moved within same county (%) - Asian
Geographical mobility - Moved within same county (%) - Hispanic or Latino
Geographical mobility - Moved within same county (%) - American Indian and Alaska Native
Geographical mobility - Moved within same county (%) - Multirace
Geographical mobility - Moved within same county (%) - Other Race
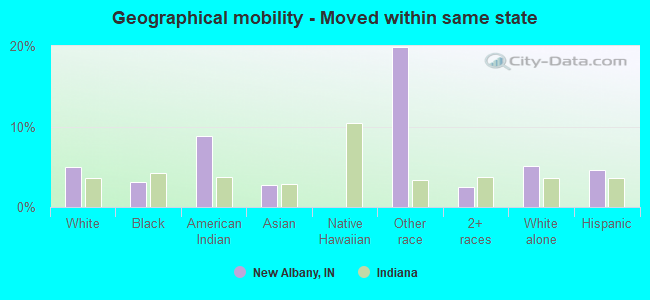
Geographical mobility - Moved from different county within same state (%)
Geographical mobility - Moved from different county within same state (%) - White
Geographical mobility - Moved from different county within same state (%) - Black or African American
Geographical mobility - Moved from different county within same state (%) - Asian
Geographical mobility - Moved from different county within same state (%) - Hispanic or Latino
Geographical mobility - Moved from different county within same state (%) - American Indian and Alaska Native
Geographical mobility - Moved from different county within same state (%) - Multirace
Geographical mobility - Moved from different county within same state (%) - Other Race
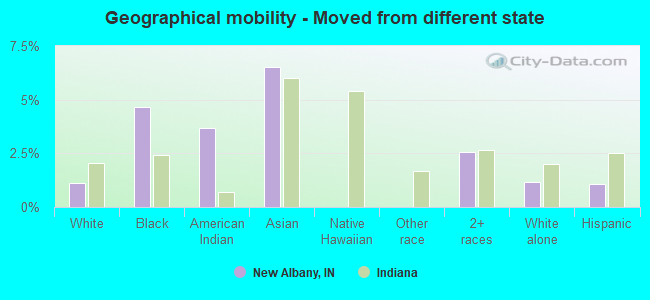
Geographical mobility - Moved from different state (%)
Geographical mobility - Moved from different state (%) - White
Geographical mobility - Moved from different state (%) - Black or African American
Geographical mobility - Moved from different state (%) - Asian
Geographical mobility - Moved from different state (%) - Hispanic or Latino
Geographical mobility - Moved from different state (%) - American Indian and Alaska Native
Geographical mobility - Moved from different state (%) - Multirace
Geographical mobility - Moved from different state (%) - Other Race
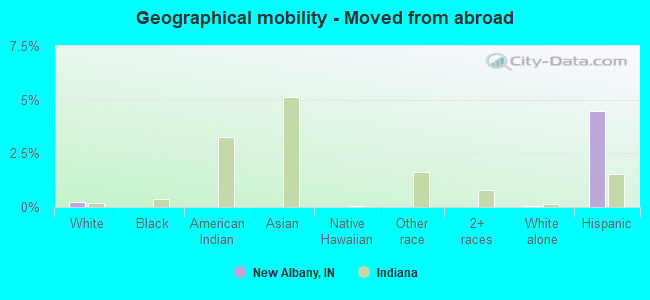
Geographical mobility - Moved from abroad (%)
Geographical mobility - Moved from abroad (%) - White
Geographical mobility - Moved from abroad (%) - Black or African American
Geographical mobility - Moved from abroad (%) - Asian
Geographical mobility - Moved from abroad (%) - Hispanic or Latino
Geographical mobility - Moved from abroad (%) - American Indian and Alaska Native
Geographical mobility - Moved from abroad (%) - Multirace
Geographical mobility - Moved from abroad (%) - Other Race
Place of birth for the foreign-born population - Ireland (%)
Place of birth for the foreign-born population - Denmark (%)
Place of birth for the foreign-born population - Norway (%)
Place of birth for the foreign-born population - Sweden (%)
Place of birth for the foreign-born population - United Kingdom (%)
Place of birth for the foreign-born population - England (%)
Place of birth for the foreign-born population - Scotland (%)
Place of birth for the foreign-born population - Other Northern Europe (%)
Place of birth for the foreign-born population - Austria (%)
Place of birth for the foreign-born population - Belgium (%)
Place of birth for the foreign-born population - France (%)
Place of birth for the foreign-born population - Germany (%)
Place of birth for the foreign-born population - Netherlands (%)
Place of birth for the foreign-born population - Switzerland (%)
Place of birth for the foreign-born population - Other Western Europe (%)
Place of birth for the foreign-born population - Greece (%)
Place of birth for the foreign-born population - Italy (%)
Place of birth for the foreign-born population - Portugal (%)
Place of birth for the foreign-born population - Spain (%)
Place of birth for the foreign-born population - Other Southern Europe (%)
Place of birth for the foreign-born population - Albania (%)
Place of birth for the foreign-born population - Belarus (%)
Place of birth for the foreign-born population - Bosnia and Herzegovina (%)
Place of birth for the foreign-born population - Bulgaria (%)
Place of birth for the foreign-born population - Croatia (%)
Place of birth for the foreign-born population - Czechoslovakia (%)
Place of birth for the foreign-born population - Hungary (%)
Place of birth for the foreign-born population - Latvia (%)
Place of birth for the foreign-born population - Lithuania (%)
Place of birth for the foreign-born population - North Macedonia (Macedonia) (%)
Place of birth for the foreign-born population - Moldova (%)
Place of birth for the foreign-born population - Poland (%)
Place of birth for the foreign-born population - Romania (%)
Place of birth for the foreign-born population - Russia (%)
Place of birth for the foreign-born population - Serbia (%)
Place of birth for the foreign-born population - Ukraine (%)
Place of birth for the foreign-born population - Other Eastern Europe (%)
Place of birth for the foreign-born population - China (%)
Place of birth for the foreign-born population - Hong Kong (%)
Place of birth for the foreign-born population - Taiwan (%)
Place of birth for the foreign-born population - Japan (%)
Place of birth for the foreign-born population - Korea (%)
Place of birth for the foreign-born population - Other Eastern Asia (%)
Place of birth for the foreign-born population - Afghanistan (%)
Place of birth for the foreign-born population - Bangladesh (%)
Place of birth for the foreign-born population - India (%)
Place of birth for the foreign-born population - Iran (%)
Place of birth for the foreign-born population - Kazakhstan (%)
Place of birth for the foreign-born population - Nepal (%)
Place of birth for the foreign-born population - Pakistan (%)
Place of birth for the foreign-born population - Sri Lanka (%)
Place of birth for the foreign-born population - Uzbekistan (%)
Place of birth for the foreign-born population - Other South Central Asia (%)
Place of birth for the foreign-born population - Burma (%)
Place of birth for the foreign-born population - Cambodia (%)
Place of birth for the foreign-born population - Indonesia (%)
Place of birth for the foreign-born population - Laos (%)
Place of birth for the foreign-born population - Malaysia (%)
Place of birth for the foreign-born population - Philippines (%)
Place of birth for the foreign-born population - Singapore (%)
Place of birth for the foreign-born population - Thailand (%)
Place of birth for the foreign-born population - Vietnam (%)
Place of birth for the foreign-born population - Other South Eastern Asia (%)
Place of birth for the foreign-born population - Armenia (%)
Place of birth for the foreign-born population - Iraq (%)
Place of birth for the foreign-born population - Israel (%)
Place of birth for the foreign-born population - Jordan (%)
Place of birth for the foreign-born population - Kuwait (%)
Place of birth for the foreign-born population - Lebanon (%)
Place of birth for the foreign-born population - Saudi Arabia (%)
Place of birth for the foreign-born population - Syria (%)
Place of birth for the foreign-born population - Turkey (%)
Place of birth for the foreign-born population - Yemen (%)
Place of birth for the foreign-born population - Other Western Asia (%)
Place of birth for the foreign-born population - Eritrea (%)
Place of birth for the foreign-born population - Ethiopia (%)
Place of birth for the foreign-born population - Kenya (%)
Place of birth for the foreign-born population - Somalia (%)
Place of birth for the foreign-born population - Uganda (%)
Place of birth for the foreign-born population - Zimbabwe (%)
Place of birth for the foreign-born population - Other Eastern Africa (%)
Place of birth for the foreign-born population - Cameroon (%)
Place of birth for the foreign-born population - Congo (%)
Place of birth for the foreign-born population - Democratic Republic of Congo (Zaire) (%)
Place of birth for the foreign-born population - Other Middle Africa (%)
Place of birth for the foreign-born population - Egypt (%)
Place of birth for the foreign-born population - Morocco (%)
Place of birth for the foreign-born population - Sudan (%)
Place of birth for the foreign-born population - Other Northern Africa (%)
Place of birth for the foreign-born population - South Africa (%)
Place of birth for the foreign-born population - Other Southern Africa (%)
Place of birth for the foreign-born population - Cabo Verde (%)
Place of birth for the foreign-born population - Ghana (%)
Place of birth for the foreign-born population - Liberia (%)
Place of birth for the foreign-born population - Nigeria (%)
Place of birth for the foreign-born population - Senegal (%)
Place of birth for the foreign-born population - Sierra Leone (%)
Place of birth for the foreign-born population - Other Western Africa (%)
Place of birth for the foreign-born population - Australia (%)
Place of birth for the foreign-born population - New Zealand (%)
Place of birth for the foreign-born population - Fiji (%)
Place of birth for the foreign-born population - Micronesia (%)
Place of birth for the foreign-born population - Bahamas (%)
Place of birth for the foreign-born population - Barbados (%)
Place of birth for the foreign-born population - Cuba (%)
Place of birth for the foreign-born population - Dominica (%)
Place of birth for the foreign-born population - Dominican Republic (%)
Place of birth for the foreign-born population - Grenada (%)
Place of birth for the foreign-born population - Haiti (%)
Place of birth for the foreign-born population - Jamaica (%)
Place of birth for the foreign-born population - St. Vincent and the Grenadines (%)
Place of birth for the foreign-born population - Trinidad and Tobago (%)
Place of birth for the foreign-born population - West Indies (%)
Place of birth for the foreign-born population - Other Caribbean (%)
Place of birth for the foreign-born population - Belize (%)
Place of birth for the foreign-born population - Costa Rica (%)
Place of birth for the foreign-born population - El Salvador (%)
Place of birth for the foreign-born population - Guatemala (%)
Place of birth for the foreign-born population - Honduras (%)
Place of birth for the foreign-born population - Mexico (%)
Place of birth for the foreign-born population - Nicaragua (%)
Place of birth for the foreign-born population - Panama (%)
Place of birth for the foreign-born population - Other Central America (%)
Place of birth for the foreign-born population - Argentina (%)
Place of birth for the foreign-born population - Bolivia (%)
Place of birth for the foreign-born population - Brazil (%)
Place of birth for the foreign-born population - Chile (%)
Place of birth for the foreign-born population - Colombia (%)
Place of birth for the foreign-born population - Ecuador (%)
Place of birth for the foreign-born population - Guyana (%)
Place of birth for the foreign-born population - Peru (%)
Place of birth for the foreign-born population - Uruguay (%)
Place of birth for the foreign-born population - Venezuela (%)
Place of birth for the foreign-born population - Other South America (%)
Place of birth for the foreign-born population - Canada (%)
Place of birth for the foreign-born population - Other Northern America (%)
Place of birth for the foreign-born population - Other (%)
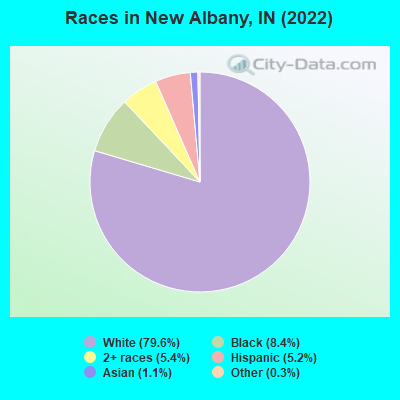
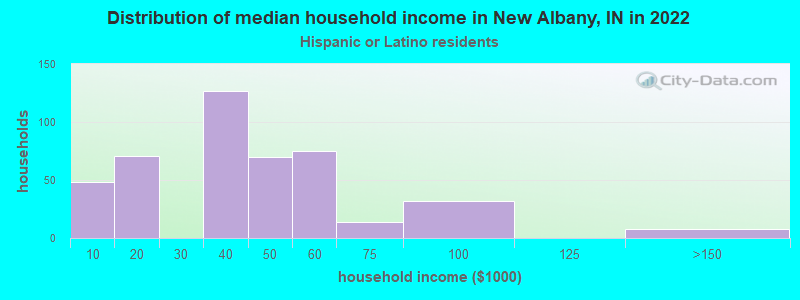
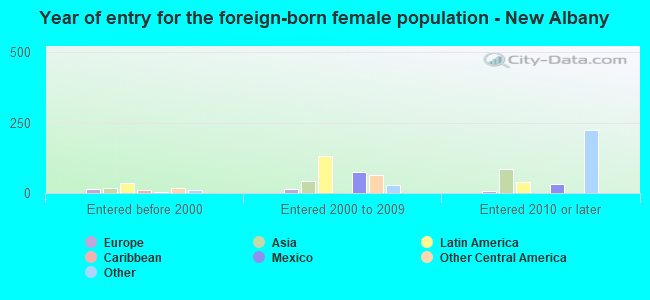
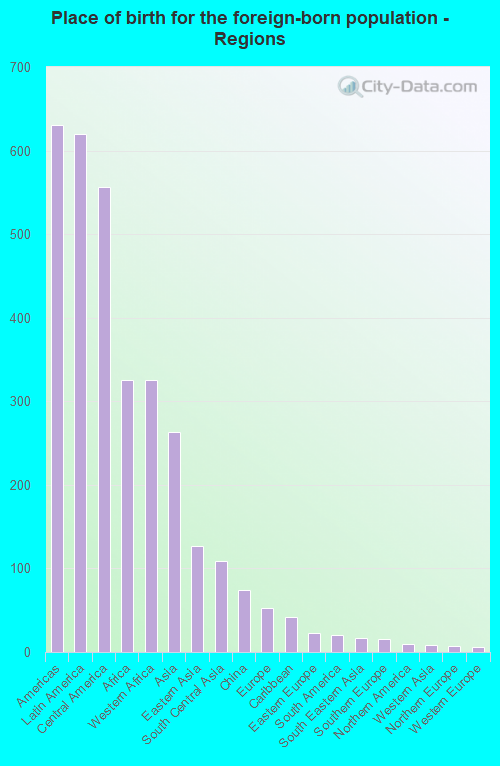
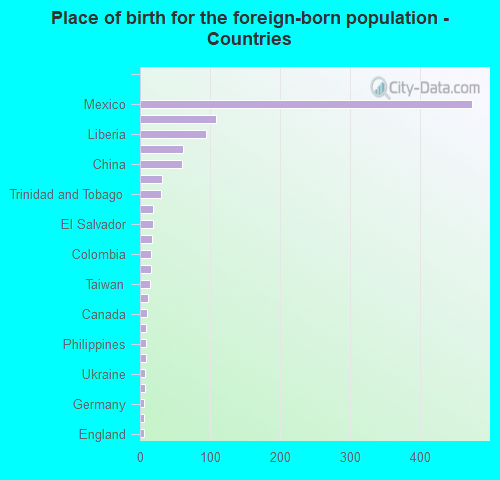
According to 2022 data, the most numerous races in New Albany, IN are White alone (30,155 residents), Black alone (3,183 residents), and Hispanic (1,976 residents). 94.8% of New Albany residents speak English at home. 3.4% of New Albany, IN residents are foreign-born (1.5% born in Latin America, 0.8% born in Africa, 0.6% born in Asia), which is 78.2% less than the foreign-born rate of 6.0% across the entire state of Indiana.
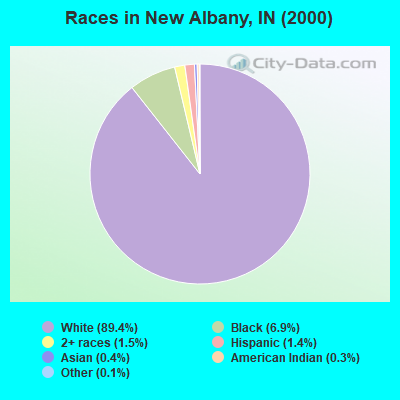
Race distribution in New Albany
2000 2022
5,219,373 85.8% White alone 505,462 8.3% Black alone 214,536 3.5% Hispanic 61,115 1.0% Two or more races 58,424 1.0% Asian alone 13,654 0.2% American Indian alone 6,348 0.1% Other race alone 1,573 0.03% Native Hawaiian and Other
5,192,455 76.0% White alone 628,054 9.2% Black alone 534,528 7.8% Hispanic 263,242 3.9% Two or more races 172,880 2.5% Asian alone 33,467 0.5% Other race alone 5,866 0.09% American Indian alone 2,545 0.04% Native Hawaiian and Other
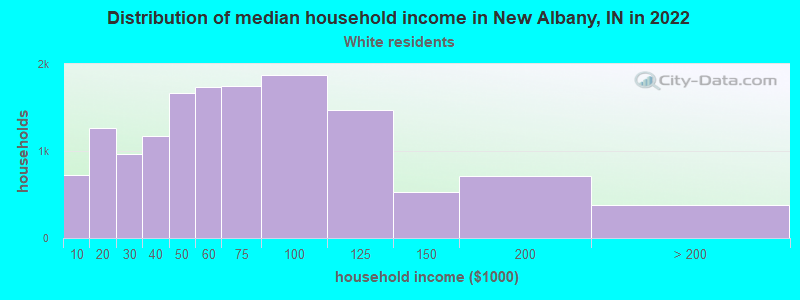
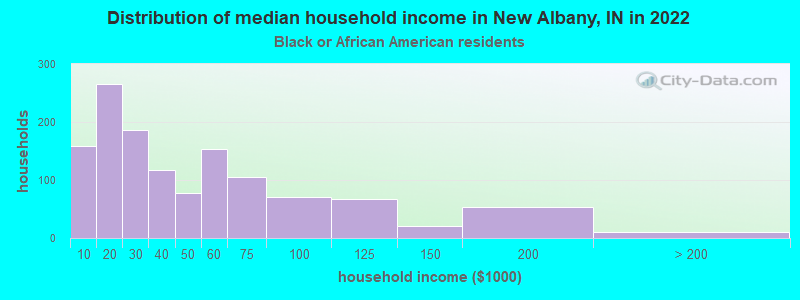
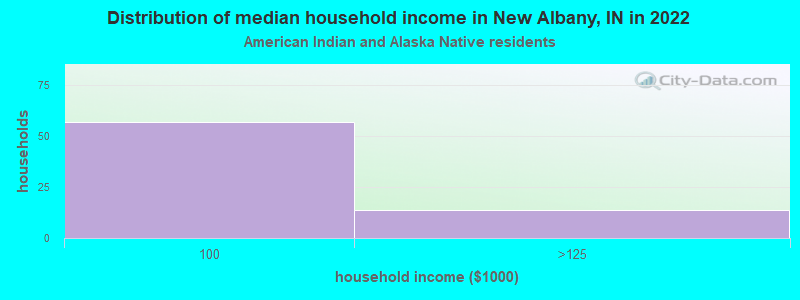
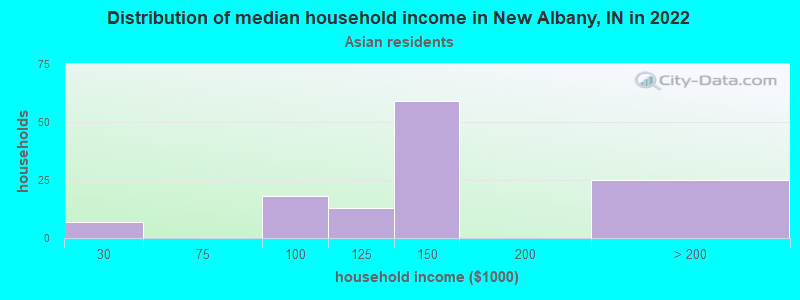
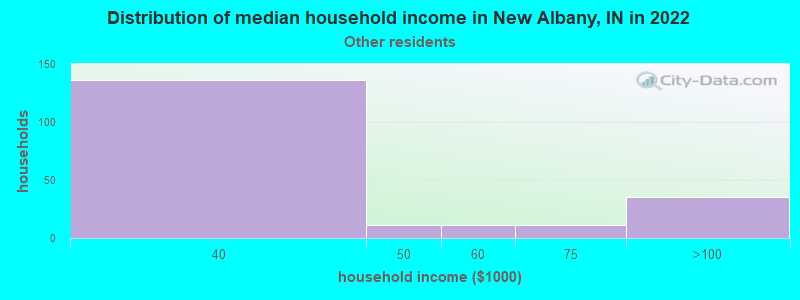
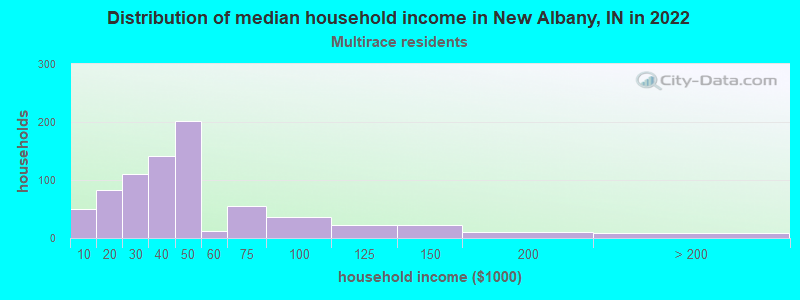
Income and house value in New Albany Median household income in 2022 $56,166 White non-Hispanic householders$32,698 Black householders$96,189 American Indian and Alaska Native householders$132,266 Asian householders$56,561 Some other race householders$39,874 Two or more races householders$36,241 Hispanic or Latino race householdersMedian 2022 house value $185,086 White Non-Hispanic householders$170,245 Black or African American householders$180,210 American Indian or Alaska Native householders $257,170 Asian householders$248,478 Two or more races householders$162,613 Hispanic or Latino householders
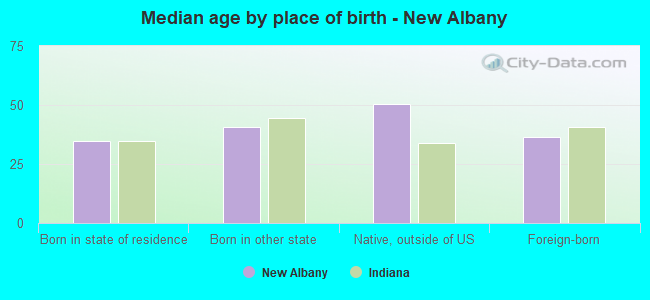
Median age by race in New Albany
41.2 Median age for White residents40.4 42.9 35.5 Median age for Black or African American residents47.6 31.7 25.9 Median age for American Indian / Alaska Native residents25.5 52.4 42.5 Median age for Asian residents26.8 53.3 -666,666,666.0 Median age for Native Hawaiian / Pacific Islander residents-666,666,666.0 -666,666,666.0 34.5 Median age for Other race residents33.9 32.9 28.7 Median age for Two or more races residents29.2 27.0 41.6 Median age for White alone residents40.6 43.1 20.8 Median age for Hispanic or Latino residents30.7 21.6
Owner/renter occupied households by race in New Albany
House owners and renters - White residents 8,937 61.0% Owner occupied5,711 39.0% Renter occupiedHouse owners and renters - Black or African American residents 191 15.7% Owner occupied1,027 84.3% Renter occupiedHouse owners and renters - American Indian / Alaska Native residents 9 15.2% Owner occupied52 84.8% Renter occupiedHouse owners and renters - Asian residents 38 29.4% Owner occupied92 70.6% Renter occupiedHouse owners and renters - Other race residents 60 26.9% Owner occupied164 73.1% Renter occupiedHouse owners and renters - Two or more races residents 471 54.0% Owner occupied401 46.0% Renter occupiedHouse owners and renters - White alone residents 8,917 62.1% Owner occupied5,435 37.9% Renter occupiedHouse owners and renters - Hispanic or Latino residents 86 17.2% Owner occupied412 82.8% Renter occupied
Language usage in New Albany
English speakers - Total 94.8% of residents of New Albany speak English at home.
2.9% of residents speak Spanish at home 812 79.1% Speak English very well214 20.9% Speak English less than very well1.8% of residents speak other language at home 438 66.8% Speak English very well218 33.2% Speak English less than very well
English speakers - Born in the United States 96.8% of residents of New Albany speak English at home.
2.0% of residents speak Spanish at home 320 100.0% Speak English very well0.8% of residents speak other language at home 131 100.0% Speak English very well
English speakers - Native, born elsewhere 89.6% of residents of New Albany speak English at home.
7.9% of residents speak Spanish at home 8 42.1% Speak English very well11 57.9% Speak English less than very well2.1% of residents speak other language at home 5 100.0% Speak English very well
English speakers - Foreign-born 16.9% of residents of New Albany speak English at home.
42.8% of residents speak Spanish at home 347 65.1% Speak English very well186 34.9% Speak English less than very well37.9% of residents speak other language at home 280 59.3% Speak English very well192 40.7% Speak English less than very well
White (Caucasian) - Speak only English Native:
99.3% (28,339)Foreign-born:
13.5% (39)
White (Caucasian) - Speak another language Native:
0.9% (249)Foreign-born:
82.2% (236)
Black or African American - Speak only English Native:
98.3% (2,682)Foreign-born:
59.8% (118)
Black or African American - Speak another language Native:
1.6% (43)Foreign-born:
14.0% (28)
American Indian / Alaska Native - Speak another language Native:
11.1% (7)Foreign-born:
100.0% (65)
Asian - Speak only English Native:
57.8% (68)Foreign-born:
10.9% (23)
Asian - Speak another language Native:
41.0% (48)Foreign-born:
89.0% (190)
Other race - Speak only English Native:
68.7% (147)Foreign-born:
4.2% (13)
Other race - Speak another language Native:
33.6% (72)Foreign-born:
94.3% (291)
Two or more races - Speak only English Native:
87.3% (2,342)Foreign-born:
10.6% (17)
Two or more races - Speak another language Native:
11.7% (314)Foreign-born:
89.2% (146)
White alone - Speak only English Native:
99.2% (28,085)Foreign-born:
8.8% (21)
White alone - Speak another language Native:
0.7% (197)Foreign-born:
95.3% (231)
Hispanic or Latino - Speak only English Native:
70.2% (844)Foreign-born:
6.1% (37)
Hispanic or Latino - Speak another language Native:
28.9% (348)Foreign-born:
93.7% (559)
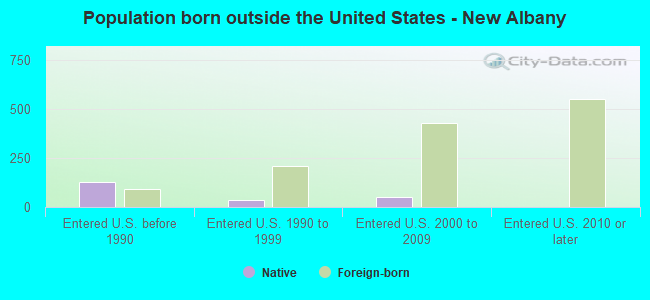
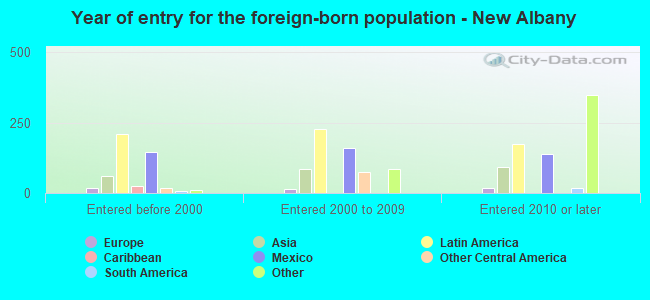
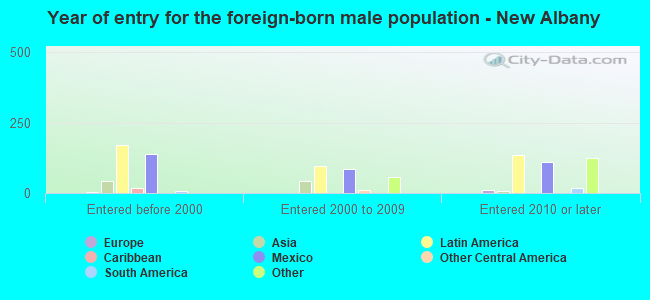
Foreign-born residents in New Albany 1,274 residents are foreign born (1.5% Latin America , 0.8% Africa , 0.6% Asia ).
This city:
3.4%Indiana:
5.6%
Marital status for residents in New Albany Marital status - White (Caucasian) population 15 years and over
Males 36.6% Never married43.0% Now married1.1% Separated3.8% Widowed15.5% DivorcedFemales 26.9% Never married39.7% Now married1.6% Separated11.5% Widowed20.2% DivorcedWomen who gave birth in the past 12 months Now married:
60.0% (305)Unmarried:
40.0% (203)
Women who did not give birth in the past 12 months Now married:
38.8% (2,656)Unmarried:
61.2% (4,193)
Marital status - Black or African American population 15 years and over
Males 66.5% Never married22.2% Now married2.7% Separated1.2% Widowed7.4% DivorcedFemales 61.6% Never married13.8% Now married2.6% Separated3.1% Widowed18.9% DivorcedWomen who gave birth in the past 12 months Now married:
23.9% (16)Unmarried:
76.1% (51)
Women who did not give birth in the past 12 months Now married:
8.2% (61)Unmarried:
91.8% (685)
Marital status - American Indian / Alaska Native population 15 years and over
Males 80.4% Never married19.6% Now married0.0% Separated0.0% Widowed0.0% DivorcedFemales 0.0% Never married29.4% Now married0.0% Separated0.0% Widowed70.6% DivorcedWomen who gave birth in the past 12 months Now married:
0.0% (0)Unmarried:
100.0% (7)
Women who did not give birth in the past 12 months Now married:
100.0% (12)Unmarried:
0.0% (0)
Marital status - Asian population 15 years and over
Males 45.0% Never married55.0% Now married0.0% Separated0.0% Widowed0.0% DivorcedFemales 19.9% Never married80.1% Now married0.0% Separated0.0% Widowed0.0% DivorcedWomen who gave birth in the past 12 months Now married:
100.0% (24)Unmarried:
0.0% (0)
Women who did not give birth in the past 12 months Now married:
82.8% (80)Unmarried:
17.2% (17)
Marital status - Other race population 15 years and over
Males 26.1% Never married17.4% Now married0.0% Separated0.0% Widowed56.4% DivorcedFemales 73.9% Never married26.1% Now married0.0% Separated0.0% Widowed0.0% DivorcedWomen who did not give birth in the past 12 months Now married:
0.0% (0)Unmarried:
100.0% (178)
Marital status - Two or more races population 15 years and over
Males 69.1% Never married21.3% Now married4.0% Separated0.0% Widowed5.6% DivorcedFemales 61.0% Never married24.8% Now married2.0% Separated1.7% Widowed10.5% DivorcedWomen who gave birth in the past 12 months Now married:
100.0% (12)Unmarried:
0.0% (0)
Women who did not give birth in the past 12 months Now married:
20.2% (201)Unmarried:
79.8% (792)
Marital status - White alone, not Hispanic / Latino population 15 years and over
Males 36.1% Never married43.0% Now married1.1% Separated3.9% Widowed15.9% DivorcedFemales 27.0% Never married39.7% Now married1.6% Separated11.5% Widowed20.2% DivorcedWomen who gave birth in the past 12 months Now married:
60.0% (306)Unmarried:
40.0% (204)
Women who did not give birth in the past 12 months Now married:
38.7% (2,638)Unmarried:
61.3% (4,186)
Marital status - Hispanic or Latino population 15 years and over
Males 55.6% Never married30.8% Now married0.0% Separated0.0% Widowed13.5% DivorcedFemales 56.0% Never married24.6% Now married0.0% Separated0.8% Widowed18.6% DivorcedWomen who did not give birth in the past 12 months Now married:
12.8% (56)Unmarried:
87.2% (380)
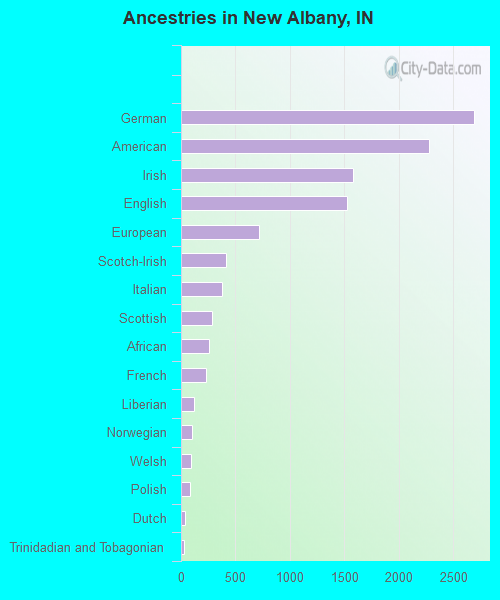
Ancestries in New Albany
2,694 16.1% German2,281 13.7% American1,577 9.4% Irish1,522 9.1% English715 4.3% European410 2.5% Scotch-Irish379 2.3% Italian287 1.7% Scottish260 1.6% African227 1.4% French120 0.7% Liberian100 0.6% Norwegian93 0.6% Welsh82 0.5% Polish37 0.2% Dutch28 0.2% Trinidadian and Tobagonian22 0.1% Ghanaian20 0.1% Swedish19 0.1% Lebanese13 0.08% Hungarian12 0.07% Scandinavian11 0.07% Swiss8 0.05% Danish7 0.04% Ukrainian5 0.03% Assyrian5 0.03% Ethiopian4 0.02% Greek2 0.01% Belgian1 0.01% Russian
Geographical mobility in New Albany Same house 1 year ago 27,057 89.0% White (Caucasian)2,433 77.3% Black or African American110 75.7% American Indian / Alaska Native365 87.3% Asian9 100.0% Native Hawaiian / Pacific Islander426 78.5% Other race2,741 89.0% Two or more races26,582 89.1% White alone, not Hispanic / Latino1,645 83.4% Hispanic or LatinoMoved within same county 1,344 4.4% White / Caucasian425 13.5% Black or African American4 2.5% American Indian / Alaska Native14 3.3% Asian182 5.9% Two or more races1,312 4.4% White alone, not Hispanic / Latino140 7.1% Hispanic or LatinoMoved within same state 1,525 5.0% White / Caucasian100 3.2% Black or African American13 8.8% American Indian / Alaska Native12 2.8% Asian107 19.8% Other race77 2.5% Two or more races1,525 5.1% White alone, not Hispanic / Latino91 4.6% Hispanic or LatinoMoved from different state 347 1.1% White / Caucasian146 4.6% Black or African American5 3.7% American Indian / Alaska Native27 6.5% Asian79 2.6% Two or more races347 1.2% White alone, not Hispanic / Latino21 1.1% Hispanic or LatinoMoved from abroad 74 0.2% White9 0.0% White alone, not Hispanic / Latino88 4.5% Hispanic or Latino
Children Nativity (place of birth) in New Albany
Children under 6 years - Living with two parents Both parents native 1,188 100.0% NativeBoth parents foreign-born 29 100.0% Foreign-bornOne native, one foreign-born parent 45 100.0% NativeChildren under 6 years - Living with one parent Native parent 1,220 100.0% NativeForeign-born parent 73 100.0% NativeChildren 6 to 17 years - Living with two parents Both parents native 2,165 100.0% NativeBoth parents foreign-born 48 20.8% Native184 79.2% Foreign-bornOne native, one foreign-born parent 67 74.2% Native23 25.8% Foreign-bornChildren 6 to 17 years - Living with one parent Native parent 2,031 99.7% Native5 0.3% Foreign-bornForeign-born parent 7 52.0% Native7 48.0% Foreign-born
Grandparents responsible for own grandchildren in New Albany
Grandparents (30 to 59 years) White / Caucasian 91 60.6% Responsible for grandchildren59 39.4% Not responsible for grandchildrenBlack or African American 9 100.0% Not responsible for grandchildrenWhite alone, not Hispanic / Latino 64 50.7% Responsible for grandchildren62 49.3% Not responsible for grandchildrenHispanic or Latino 38 100.0% Responsible for grandchildrenGrandparents (60 years and over) White / Caucasian 88 37.7% Responsible for grandchildren145 62.3% Not responsible for grandchildrenBlack or African American 14 100.0% Not responsible for grandchildrenWhite alone, not Hispanic / Latino 89 37.6% Responsible for grandchildren148 62.4% Not responsible for grandchildren