Races in New Berlin, Wisconsin (WI) Detailed Stats
Data:
Races - White alone (%)
Races - White alone (% change since 2000)
Races - Black alone (%)
Races - Black alone (% change since 2000)
Races - American Indian alone (%)
Races - American Indian alone (% change since 2000)
Races - Asian alone (%)
Races - Asian alone (% change since 2000)
Races - Hispanic (%)
Races - Hispanic (% change since 2000)
Races - Native Hawaiian and Other Pacific Islander alone (%)
Races - Native Hawaiian and Other Pacific Islander alone (% change since 2000)
Races - Two or more races(%)
Races - Two or more races(% change since 2000)
Races - Other race alone (%)
Races - Other race alone (% change since 2000)
Racial diversity
Place of birth - Born in state of residence (%)
Place of birth - Born in state of residence (%) - White
Place of birth - Born in state of residence (%) - Black or African American
Place of birth - Born in state of residence (%) - Asian
Place of birth - Born in state of residence (%) - Hispanic or Latino
Place of birth - Born in state of residence (%) - American Indian and Alaska Native
Place of birth - Born in state of residence (%) - Multirace
Place of birth - Born in state of residence (%) - Other Race
Place of birth - Born in other state (%)
Place of birth - Born in other state (%) - White
Place of birth - Born in other state (%) - Black or African American
Place of birth - Born in other state (%) - Asian
Place of birth - Born in other state (%) - Hispanic or Latino
Place of birth - Born in other state (%) - American Indian and Alaska Native
Place of birth - Born in other state (%) - Multirace
Place of birth - Born in other state (%) - Other Race
Place of birth - Native, outside of US (%)
Place of birth - Native, outside of US (%) - White
Place of birth - Native, outside of US (%) - Black or African American
Place of birth - Native, outside of US (%) - Asian
Place of birth - Native, outside of US (%) - Hispanic or Latino
Place of birth - Native, outside of US (%) - American Indian and Alaska Native
Place of birth - Native, outside of US (%) - Multirace
Place of birth - Native, outside of US (%) - Other Race
Place of birth - Foreign born (%)
Place of birth - Foreign born (%) - White
Place of birth - Foreign born (%) - Black or African American
Place of birth - Foreign born (%) - Asian
Place of birth - Foreign born (%) - Hispanic or Latino
Place of birth - Foreign born (%) - American Indian and Alaska Native
Place of birth - Foreign born (%) - Multirace
Place of birth - Foreign born (%) - Other Race
Residents speaking English at home (%)
Residents speaking English at home - Born in the United States (%)
Residents speaking English at home - Native, born elsewhere (%)
Residents speaking English at home - Foreign born (%)
Residents speaking Spanish at home (%)
Residents speaking Spanish at home - Born in the United States (%)
Residents speaking Spanish at home - Native, born elsewhere (%)
Residents speaking Spanish at home - Foreign born (%)
Residents speaking other language at home (%)
Residents speaking other language at home - Born in the United States (%)
Residents speaking other language at home - Native, born elsewhere (%)
Residents speaking other language at home - Foreign born (%)
Marital status - Never married (%)
Marital status - Now married (%)
Marital status - Separated (%)
Marital status - Widowed (%)
Marital status - Divorced (%)
Ancestries Reported - Arab (%)
Ancestries Reported - Czech (%)
Ancestries Reported - Danish (%)
Ancestries Reported - Dutch (%)
Ancestries Reported - English (%)
Ancestries Reported - French (%)
Ancestries Reported - French Canadian (%)
Ancestries Reported - German (%)
Ancestries Reported - Greek (%)
Ancestries Reported - Hungarian (%)
Ancestries Reported - Irish (%)
Ancestries Reported - Italian (%)
Ancestries Reported - Lithuanian (%)
Ancestries Reported - Norwegian (%)
Ancestries Reported - Polish (%)
Ancestries Reported - Portuguese (%)
Ancestries Reported - Russian (%)
Ancestries Reported - Scotch-Irish (%)
Ancestries Reported - Scottish (%)
Ancestries Reported - Slovak (%)
Ancestries Reported - Subsaharan African (%)
Ancestries Reported - Swedish (%)
Ancestries Reported - Swiss (%)
Ancestries Reported - Ukrainian (%)
Ancestries Reported - United States (%)
Ancestries Reported - Welsh (%)
Ancestries Reported - West Indian (%)
Ancestries Reported - Other (%)
Geographical mobility - Same house 1 year ago (%)
Geographical mobility - Same house 1 year ago (%) - White
Geographical mobility - Same house 1 year ago (%) - Black or African American
Geographical mobility - Same house 1 year ago (%) - Asian
Geographical mobility - Same house 1 year ago (%) - Hispanic or Latino
Geographical mobility - Same house 1 year ago (%) - American Indian and Alaska Native
Geographical mobility - Same house 1 year ago (%) - Multirace
Geographical mobility - Same house 1 year ago (%) - Other Race
Geographical mobility - Moved within same county (%)
Geographical mobility - Moved within same county (%) - White
Geographical mobility - Moved within same county (%) - Black or African American
Geographical mobility - Moved within same county (%) - Asian
Geographical mobility - Moved within same county (%) - Hispanic or Latino
Geographical mobility - Moved within same county (%) - American Indian and Alaska Native
Geographical mobility - Moved within same county (%) - Multirace
Geographical mobility - Moved within same county (%) - Other Race
Geographical mobility - Moved from different county within same state (%)
Geographical mobility - Moved from different county within same state (%) - White
Geographical mobility - Moved from different county within same state (%) - Black or African American
Geographical mobility - Moved from different county within same state (%) - Asian
Geographical mobility - Moved from different county within same state (%) - Hispanic or Latino
Geographical mobility - Moved from different county within same state (%) - American Indian and Alaska Native
Geographical mobility - Moved from different county within same state (%) - Multirace
Geographical mobility - Moved from different county within same state (%) - Other Race
Geographical mobility - Moved from different state (%)
Geographical mobility - Moved from different state (%) - White
Geographical mobility - Moved from different state (%) - Black or African American
Geographical mobility - Moved from different state (%) - Asian
Geographical mobility - Moved from different state (%) - Hispanic or Latino
Geographical mobility - Moved from different state (%) - American Indian and Alaska Native
Geographical mobility - Moved from different state (%) - Multirace
Geographical mobility - Moved from different state (%) - Other Race
Geographical mobility - Moved from abroad (%)
Geographical mobility - Moved from abroad (%) - White
Geographical mobility - Moved from abroad (%) - Black or African American
Geographical mobility - Moved from abroad (%) - Asian
Geographical mobility - Moved from abroad (%) - Hispanic or Latino
Geographical mobility - Moved from abroad (%) - American Indian and Alaska Native
Geographical mobility - Moved from abroad (%) - Multirace
Geographical mobility - Moved from abroad (%) - Other Race
Place of birth for the foreign-born population - Ireland (%)
Place of birth for the foreign-born population - Denmark (%)
Place of birth for the foreign-born population - Norway (%)
Place of birth for the foreign-born population - Sweden (%)
Place of birth for the foreign-born population - United Kingdom (%)
Place of birth for the foreign-born population - England (%)
Place of birth for the foreign-born population - Scotland (%)
Place of birth for the foreign-born population - Other Northern Europe (%)
Place of birth for the foreign-born population - Austria (%)
Place of birth for the foreign-born population - Belgium (%)
Place of birth for the foreign-born population - France (%)
Place of birth for the foreign-born population - Germany (%)
Place of birth for the foreign-born population - Netherlands (%)
Place of birth for the foreign-born population - Switzerland (%)
Place of birth for the foreign-born population - Other Western Europe (%)
Place of birth for the foreign-born population - Greece (%)
Place of birth for the foreign-born population - Italy (%)
Place of birth for the foreign-born population - Portugal (%)
Place of birth for the foreign-born population - Spain (%)
Place of birth for the foreign-born population - Other Southern Europe (%)
Place of birth for the foreign-born population - Albania (%)
Place of birth for the foreign-born population - Belarus (%)
Place of birth for the foreign-born population - Bosnia and Herzegovina (%)
Place of birth for the foreign-born population - Bulgaria (%)
Place of birth for the foreign-born population - Croatia (%)
Place of birth for the foreign-born population - Czechoslovakia (%)
Place of birth for the foreign-born population - Hungary (%)
Place of birth for the foreign-born population - Latvia (%)
Place of birth for the foreign-born population - Lithuania (%)
Place of birth for the foreign-born population - North Macedonia (Macedonia) (%)
Place of birth for the foreign-born population - Moldova (%)
Place of birth for the foreign-born population - Poland (%)
Place of birth for the foreign-born population - Romania (%)
Place of birth for the foreign-born population - Russia (%)
Place of birth for the foreign-born population - Serbia (%)
Place of birth for the foreign-born population - Ukraine (%)
Place of birth for the foreign-born population - Other Eastern Europe (%)
Place of birth for the foreign-born population - China (%)
Place of birth for the foreign-born population - Hong Kong (%)
Place of birth for the foreign-born population - Taiwan (%)
Place of birth for the foreign-born population - Japan (%)
Place of birth for the foreign-born population - Korea (%)
Place of birth for the foreign-born population - Other Eastern Asia (%)
Place of birth for the foreign-born population - Afghanistan (%)
Place of birth for the foreign-born population - Bangladesh (%)
Place of birth for the foreign-born population - India (%)
Place of birth for the foreign-born population - Iran (%)
Place of birth for the foreign-born population - Kazakhstan (%)
Place of birth for the foreign-born population - Nepal (%)
Place of birth for the foreign-born population - Pakistan (%)
Place of birth for the foreign-born population - Sri Lanka (%)
Place of birth for the foreign-born population - Uzbekistan (%)
Place of birth for the foreign-born population - Other South Central Asia (%)
Place of birth for the foreign-born population - Burma (%)
Place of birth for the foreign-born population - Cambodia (%)
Place of birth for the foreign-born population - Indonesia (%)
Place of birth for the foreign-born population - Laos (%)
Place of birth for the foreign-born population - Malaysia (%)
Place of birth for the foreign-born population - Philippines (%)
Place of birth for the foreign-born population - Singapore (%)
Place of birth for the foreign-born population - Thailand (%)
Place of birth for the foreign-born population - Vietnam (%)
Place of birth for the foreign-born population - Other South Eastern Asia (%)
Place of birth for the foreign-born population - Armenia (%)
Place of birth for the foreign-born population - Iraq (%)
Place of birth for the foreign-born population - Israel (%)
Place of birth for the foreign-born population - Jordan (%)
Place of birth for the foreign-born population - Kuwait (%)
Place of birth for the foreign-born population - Lebanon (%)
Place of birth for the foreign-born population - Saudi Arabia (%)
Place of birth for the foreign-born population - Syria (%)
Place of birth for the foreign-born population - Turkey (%)
Place of birth for the foreign-born population - Yemen (%)
Place of birth for the foreign-born population - Other Western Asia (%)
Place of birth for the foreign-born population - Eritrea (%)
Place of birth for the foreign-born population - Ethiopia (%)
Place of birth for the foreign-born population - Kenya (%)
Place of birth for the foreign-born population - Somalia (%)
Place of birth for the foreign-born population - Uganda (%)
Place of birth for the foreign-born population - Zimbabwe (%)
Place of birth for the foreign-born population - Other Eastern Africa (%)
Place of birth for the foreign-born population - Cameroon (%)
Place of birth for the foreign-born population - Congo (%)
Place of birth for the foreign-born population - Democratic Republic of Congo (Zaire) (%)
Place of birth for the foreign-born population - Other Middle Africa (%)
Place of birth for the foreign-born population - Egypt (%)
Place of birth for the foreign-born population - Morocco (%)
Place of birth for the foreign-born population - Sudan (%)
Place of birth for the foreign-born population - Other Northern Africa (%)
Place of birth for the foreign-born population - South Africa (%)
Place of birth for the foreign-born population - Other Southern Africa (%)
Place of birth for the foreign-born population - Cabo Verde (%)
Place of birth for the foreign-born population - Ghana (%)
Place of birth for the foreign-born population - Liberia (%)
Place of birth for the foreign-born population - Nigeria (%)
Place of birth for the foreign-born population - Senegal (%)
Place of birth for the foreign-born population - Sierra Leone (%)
Place of birth for the foreign-born population - Other Western Africa (%)
Place of birth for the foreign-born population - Australia (%)
Place of birth for the foreign-born population - New Zealand (%)
Place of birth for the foreign-born population - Fiji (%)
Place of birth for the foreign-born population - Micronesia (%)
Place of birth for the foreign-born population - Bahamas (%)
Place of birth for the foreign-born population - Barbados (%)
Place of birth for the foreign-born population - Cuba (%)
Place of birth for the foreign-born population - Dominica (%)
Place of birth for the foreign-born population - Dominican Republic (%)
Place of birth for the foreign-born population - Grenada (%)
Place of birth for the foreign-born population - Haiti (%)
Place of birth for the foreign-born population - Jamaica (%)
Place of birth for the foreign-born population - St. Vincent and the Grenadines (%)
Place of birth for the foreign-born population - Trinidad and Tobago (%)
Place of birth for the foreign-born population - West Indies (%)
Place of birth for the foreign-born population - Other Caribbean (%)
Place of birth for the foreign-born population - Belize (%)
Place of birth for the foreign-born population - Costa Rica (%)
Place of birth for the foreign-born population - El Salvador (%)
Place of birth for the foreign-born population - Guatemala (%)
Place of birth for the foreign-born population - Honduras (%)
Place of birth for the foreign-born population - Mexico (%)
Place of birth for the foreign-born population - Nicaragua (%)
Place of birth for the foreign-born population - Panama (%)
Place of birth for the foreign-born population - Other Central America (%)
Place of birth for the foreign-born population - Argentina (%)
Place of birth for the foreign-born population - Bolivia (%)
Place of birth for the foreign-born population - Brazil (%)
Place of birth for the foreign-born population - Chile (%)
Place of birth for the foreign-born population - Colombia (%)
Place of birth for the foreign-born population - Ecuador (%)
Place of birth for the foreign-born population - Guyana (%)
Place of birth for the foreign-born population - Peru (%)
Place of birth for the foreign-born population - Uruguay (%)
Place of birth for the foreign-born population - Venezuela (%)
Place of birth for the foreign-born population - Other South America (%)
Place of birth for the foreign-born population - Canada (%)
Place of birth for the foreign-born population - Other Northern America (%)
Place of birth for the foreign-born population - Other (%)
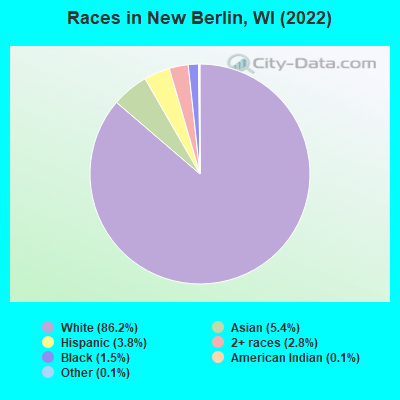
According to 2022 data, the most numerous races in New Berlin, WI are White alone (35,072 residents), Hispanic (1,527 residents), and Black alone (607 residents). 92.6% of New Berlin residents speak English at home. 6.2% of New Berlin, WI residents are foreign-born (3.7% born in Asia, 1.5% born in Europe, 0.7% born in Latin America), which is 19.3% greater than the foreign-born rate of 5.0% across the entire state of Wisconsin.
Race distribution in New Berlin
2000 2022
4,681,630 87.3% White alone 300,245 5.6% Black alone 192,921 3.6% Hispanic 87,995 1.6% Asian alone 51,921 1.0% Two or more races 43,980 0.8% American Indian alone 3,637 0.07% Other race alone 1,346 0.03% Native Hawaiian and Other
4,654,031 79.0% White alone 447,022 7.6% Hispanic 345,678 5.9% Black alone 217,532 3.7% Two or more races 172,242 2.9% Asian alone 33,762 0.6% American Indian alone 19,680 0.3% Other race alone 2,592 0.04% Native Hawaiian and Other
Income and house value in New Berlin Median household income in 2022 $93,248 White non-Hispanic householders$167,240 Asian householders$75,801 Some other race householders$69,601 Two or more races householders$62,142 Hispanic or Latino race householdersMedian 2022 house value $347,600 White Non-Hispanic householders$264,184 Black or African American householders$218,938 American Indian or Alaska Native householders $411,716 Asian householders$203,713 Native Hawaiian and other Pacific Islander householders$294,849 Some other race householders$371,402 Two or more races householders$347,171 Hispanic or Latino householders
Median age by race in New Berlin
49.8 Median age for White residents47.6 51.7 40.9 Median age for Black or African American residents41.5 58.5 9.2 Median age for American Indian / Alaska Native residents-1,272,916,665.4 -689,393,938.7 36.6 Median age for Asian residents37.0 34.7 -825,688,072.6 Median age for Native Hawaiian / Pacific Islander residents-862,745,097.2 -666,666,666.0 46.1 Median age for Other race residents41.4 65.4 13.7 Median age for Two or more races residents11.1 21.1 50.2 Median age for White alone residents47.9 52.9 24.7 Median age for Hispanic or Latino residents22.5 31.1
Owner/renter occupied households by race in New Berlin
House owners and renters - White residents 12,854 78.6% Owner occupied3,496 21.4% Renter occupiedHouse owners and renters - Black or African American residents 52 36.8% Owner occupied90 63.2% Renter occupiedHouse owners and renters - American Indian / Alaska Native residents 4 100.0% Renter occupiedHouse owners and renters - Asian residents 510 78.1% Owner occupied143 21.9% Renter occupiedHouse owners and renters - Other race residents 168 72.5% Owner occupied63 27.5% Renter occupiedHouse owners and renters - Two or more races residents 111 51.9% Owner occupied103 48.1% Renter occupiedHouse owners and renters - White alone residents 12,738 78.7% Owner occupied3,442 21.3% Renter occupiedHouse owners and renters - Hispanic or Latino residents 182 49.4% Owner occupied187 50.6% Renter occupied
Language usage in New Berlin
English speakers - Total 92.6% of residents of New Berlin speak English at home.
1.7% of residents speak Spanish at home 457 71.3% Speak English very well184 28.7% Speak English less than very well5.9% of residents speak other language at home 1,765 76.8% Speak English very well533 23.2% Speak English less than very well
English speakers - Born in the United States 97.8% of residents of New Berlin speak English at home.
1.3% of residents speak Spanish at home 72 87.8% Speak English very well10 12.2% Speak English less than very well0.9% of residents speak other language at home 58 100.0% Speak English very well
English speakers - Native, born elsewhere 58.0% of residents of New Berlin speak English at home.
51.4% of residents speak Spanish at home 39 29.8% Speak English very well92 70.2% Speak English less than very well
English speakers - Foreign-born 26.6% of residents of New Berlin speak English at home.
4.3% of residents speak Spanish at home 55 51.4% Speak English very well52 48.6% Speak English less than very well72.3% of residents speak other language at home 1,340 74.6% Speak English very well457 25.4% Speak English less than very well
White (Caucasian) - Speak only English Native:
98.2% (32,599)Foreign-born:
37.1% (261)
White (Caucasian) - Speak another language Native:
1.7% (580)Foreign-born:
62.5% (439)
Asian - Speak only English Native:
85.2% (512)Foreign-born:
19.7% (301)
Asian - Speak another language Native:
19.7% (118)Foreign-born:
79.9% (1,226)
Other race - Speak only English Native:
26.2% (83)Foreign-born:
27.8% (51)
Other race - Speak another language Native:
64.8% (206)Foreign-born:
73.5% (134)
Two or more races - Speak only English Native:
91.6% (1,277)Foreign-born:
72.7% (40)
Two or more races - Speak another language Native:
8.4% (118)Foreign-born:
48.7% (26)
White alone - Speak only English Native:
98.5% (32,187)Foreign-born:
35.5% (270)
White alone - Speak another language Native:
1.4% (459)Foreign-born:
64.2% (490)
Hispanic or Latino - Speak only English Native:
63.8% (747)Foreign-born:
29.6% (46)
Hispanic or Latino - Speak another language Native:
32.7% (382)Foreign-born:
70.3% (108)
Foreign-born residents in New Berlin 2,523 residents are foreign born (3.7% Asia , 1.5% Europe , 0.7% Latin America ).
This city:
6.2%Wisconsin:
5.0%
Marital status for residents in New Berlin Marital status - White (Caucasian) population 15 years and over
Males 24.6% Never married64.7% Now married0.3% Separated2.4% Widowed8.0% DivorcedFemales 17.2% Never married58.9% Now married0.5% Separated10.7% Widowed12.7% DivorcedWomen who gave birth in the past 12 months Now married:
94.1% (370)Unmarried:
5.9% (23)
Women who did not give birth in the past 12 months Now married:
51.9% (3,119)Unmarried:
48.1% (2,893)
Marital status - Black or African American population 15 years and over
Males 40.0% Never married60.0% Now married0.0% Separated0.0% Widowed0.0% DivorcedFemales 38.8% Never married61.2% Now married0.0% Separated0.0% Widowed0.0% DivorcedWomen who did not give birth in the past 12 months Now married:
54.5% (6)Unmarried:
45.5% (5)
Marital status - American Indian / Alaska Native population 15 years and over
Males 100.0% Never married0.0% Now married0.0% Separated0.0% Widowed0.0% DivorcedFemales 0.0% Never married0.0% Now married0.0% Separated100.0% Widowed0.0% DivorcedMarital status - Asian population 15 years and over
Males 34.3% Never married62.1% Now married0.0% Separated0.4% Widowed3.3% DivorcedFemales 29.1% Never married59.6% Now married0.0% Separated6.3% Widowed5.0% DivorcedWomen who gave birth in the past 12 months Now married:
100.0% (37)Unmarried:
0.0% (0)
Women who did not give birth in the past 12 months Now married:
60.9% (447)Unmarried:
39.1% (287)
Marital status - Other race population 15 years and over
Males 0.0% Never married100.0% Now married0.0% Separated0.0% Widowed0.0% DivorcedFemales 12.1% Never married72.0% Now married0.0% Separated11.2% Widowed4.7% DivorcedWomen who did not give birth in the past 12 months Now married:
71.4% (59)Unmarried:
28.6% (24)
Marital status - Two or more races population 15 years and over
Males 22.5% Never married58.5% Now married3.1% Separated3.8% Widowed12.1% DivorcedFemales 52.8% Never married38.7% Now married0.0% Separated6.7% Widowed1.8% DivorcedWomen who did not give birth in the past 12 months Now married:
38.2% (138)Unmarried:
61.8% (223)
Marital status - White alone, not Hispanic / Latino population 15 years and over
Males 24.3% Never married64.9% Now married0.3% Separated2.4% Widowed8.0% DivorcedFemales 16.8% Never married59.2% Now married0.5% Separated10.9% Widowed12.5% DivorcedWomen who gave birth in the past 12 months Now married:
93.5% (337)Unmarried:
6.5% (23)
Women who did not give birth in the past 12 months Now married:
52.8% (3,141)Unmarried:
47.2% (2,803)
Marital status - Hispanic or Latino population 15 years and over
Males 29.1% Never married64.2% Now married0.0% Separated2.5% Widowed4.3% DivorcedFemales 31.0% Never married52.9% Now married0.0% Separated4.7% Widowed11.4% DivorcedWomen who gave birth in the past 12 months Now married:
100.0% (38)Unmarried:
0.0% (0)
Women who did not give birth in the past 12 months Now married:
36.5% (113)Unmarried:
63.5% (196)
Ancestries in New Berlin
6,184 35.5% German2,084 12.0% Polish1,031 5.9% American777 4.5% Irish698 4.0% European584 3.4% Italian545 3.1% Norwegian530 3.0% English161 0.9% Scottish136 0.8% Dutch108 0.6% Greek106 0.6% French105 0.6% Swiss103 0.6% Danish96 0.6% Hungarian78 0.4% Slovene75 0.4% Swedish66 0.4% Czechoslovakian66 0.4% Ukrainian51 0.3% Croatian49 0.3% Canadian48 0.3% Yugoslavian48 0.3% Russian47 0.3% Austrian46 0.3% Eastern European38 0.2% Scandinavian38 0.2% Senegalese35 0.2% British35 0.2% Scotch-Irish25 0.1% Finnish25 0.1% Celtic24 0.1% Czech20 0.1% Belgian20 0.1% Welsh16 0.09% Australian15 0.09% Luxembourger14 0.08% Lithuanian12 0.07% Slovak12 0.07% French Canadian11 0.06% Romanian11 0.06% Macedonian10 0.06% Serbian9 0.05% Portuguese6 0.03% Northern European1 0.01% Latvian
Geographical mobility in New Berlin Same house 1 year ago 32,538 92.4% White (Caucasian)402 83.2% Black or African American51 100.0% American Indian / Alaska Native2,012 92.0% Asian254 86.7% Other race1,365 83.6% Two or more races32,072 92.3% White alone, not Hispanic / Latino1,380 93.1% Hispanic or LatinoMoved within same county 1,018 2.9% White / Caucasian46 9.5% Black or African American30 1.9% Two or more races1,020 2.9% White alone, not Hispanic / LatinoMoved within same state 1,045 3.0% White / Caucasian33 6.9% Black or African American82 3.8% Asian31 10.4% Other race137 8.4% Two or more races1,054 3.0% White alone, not Hispanic / Latino40 2.7% Hispanic or LatinoMoved from different state 291 0.8% White / Caucasian63 2.9% Asian39 2.4% Two or more races295 0.8% White alone, not Hispanic / Latino21 1.4% Hispanic or LatinoMoved from abroad 215 0.6% White36 1.6% Asian167 0.5% White alone, not Hispanic / Latino
Children Nativity (place of birth) in New Berlin
Children under 6 years - Living with two parents Both parents native 1,747 100.0% NativeBoth parents foreign-born 156 74.3% Native54 25.7% Foreign-bornOne native, one foreign-born parent 49 100.0% NativeChildren under 6 years - Living with one parent Native parent 388 100.0% NativeChildren 6 to 17 years - Living with two parents Both parents native 3,356 99.0% Native33 1.0% Foreign-bornBoth parents foreign-born 362 80.5% Native87 19.5% Foreign-bornOne native, one foreign-born parent 283 95.0% Native15 5.0% Foreign-bornChildren 6 to 17 years - Living with one parent Native parent 950 100.0% NativeForeign-born parent 23 46.9% Native26 53.1% Foreign-born
Grandparents responsible for own grandchildren in New Berlin
Grandparents (30 to 59 years) White / Caucasian 81 100.0% Not responsible for grandchildrenWhite alone, not Hispanic / Latino 83 100.0% Not responsible for grandchildrenGrandparents (60 years and over) White / Caucasian 81 22.4% Responsible for grandchildren279 77.6% Not responsible for grandchildrenWhite alone, not Hispanic / Latino 81 22.0% Responsible for grandchildren285 78.0% Not responsible for grandchildren