Races in New Castle, Pennsylvania (PA) Detailed Stats
Data:
Races - White alone (%)
Races - White alone (% change since 2000)
Races - Black alone (%)
Races - Black alone (% change since 2000)
Races - American Indian alone (%)
Races - American Indian alone (% change since 2000)
Races - Asian alone (%)
Races - Asian alone (% change since 2000)
Races - Hispanic (%)
Races - Hispanic (% change since 2000)
Races - Native Hawaiian and Other Pacific Islander alone (%)
Races - Native Hawaiian and Other Pacific Islander alone (% change since 2000)
Races - Two or more races(%)
Races - Two or more races(% change since 2000)
Races - Other race alone (%)
Races - Other race alone (% change since 2000)
Racial diversity
Place of birth - Born in state of residence (%)
Place of birth - Born in state of residence (%) - White
Place of birth - Born in state of residence (%) - Black or African American
Place of birth - Born in state of residence (%) - Asian
Place of birth - Born in state of residence (%) - Hispanic or Latino
Place of birth - Born in state of residence (%) - American Indian and Alaska Native
Place of birth - Born in state of residence (%) - Multirace
Place of birth - Born in state of residence (%) - Other Race
Place of birth - Born in other state (%)
Place of birth - Born in other state (%) - White
Place of birth - Born in other state (%) - Black or African American
Place of birth - Born in other state (%) - Asian
Place of birth - Born in other state (%) - Hispanic or Latino
Place of birth - Born in other state (%) - American Indian and Alaska Native
Place of birth - Born in other state (%) - Multirace
Place of birth - Born in other state (%) - Other Race
Place of birth - Native, outside of US (%)
Place of birth - Native, outside of US (%) - White
Place of birth - Native, outside of US (%) - Black or African American
Place of birth - Native, outside of US (%) - Asian
Place of birth - Native, outside of US (%) - Hispanic or Latino
Place of birth - Native, outside of US (%) - American Indian and Alaska Native
Place of birth - Native, outside of US (%) - Multirace
Place of birth - Native, outside of US (%) - Other Race
Place of birth - Foreign born (%)
Place of birth - Foreign born (%) - White
Place of birth - Foreign born (%) - Black or African American
Place of birth - Foreign born (%) - Asian
Place of birth - Foreign born (%) - Hispanic or Latino
Place of birth - Foreign born (%) - American Indian and Alaska Native
Place of birth - Foreign born (%) - Multirace
Place of birth - Foreign born (%) - Other Race
Residents speaking English at home (%)
Residents speaking English at home - Born in the United States (%)
Residents speaking English at home - Native, born elsewhere (%)
Residents speaking English at home - Foreign born (%)
Residents speaking Spanish at home (%)
Residents speaking Spanish at home - Born in the United States (%)
Residents speaking Spanish at home - Native, born elsewhere (%)
Residents speaking Spanish at home - Foreign born (%)
Residents speaking other language at home (%)
Residents speaking other language at home - Born in the United States (%)
Residents speaking other language at home - Native, born elsewhere (%)
Residents speaking other language at home - Foreign born (%)
Marital status - Never married (%)
Marital status - Now married (%)
Marital status - Separated (%)
Marital status - Widowed (%)
Marital status - Divorced (%)
Ancestries Reported - Arab (%)
Ancestries Reported - Czech (%)
Ancestries Reported - Danish (%)
Ancestries Reported - Dutch (%)
Ancestries Reported - English (%)
Ancestries Reported - French (%)
Ancestries Reported - French Canadian (%)
Ancestries Reported - German (%)
Ancestries Reported - Greek (%)
Ancestries Reported - Hungarian (%)
Ancestries Reported - Irish (%)
Ancestries Reported - Italian (%)
Ancestries Reported - Lithuanian (%)
Ancestries Reported - Norwegian (%)
Ancestries Reported - Polish (%)
Ancestries Reported - Portuguese (%)
Ancestries Reported - Russian (%)
Ancestries Reported - Scotch-Irish (%)
Ancestries Reported - Scottish (%)
Ancestries Reported - Slovak (%)
Ancestries Reported - Subsaharan African (%)
Ancestries Reported - Swedish (%)
Ancestries Reported - Swiss (%)
Ancestries Reported - Ukrainian (%)
Ancestries Reported - United States (%)
Ancestries Reported - Welsh (%)
Ancestries Reported - West Indian (%)
Ancestries Reported - Other (%)
Geographical mobility - Same house 1 year ago (%)
Geographical mobility - Same house 1 year ago (%) - White
Geographical mobility - Same house 1 year ago (%) - Black or African American
Geographical mobility - Same house 1 year ago (%) - Asian
Geographical mobility - Same house 1 year ago (%) - Hispanic or Latino
Geographical mobility - Same house 1 year ago (%) - American Indian and Alaska Native
Geographical mobility - Same house 1 year ago (%) - Multirace
Geographical mobility - Same house 1 year ago (%) - Other Race
Geographical mobility - Moved within same county (%)
Geographical mobility - Moved within same county (%) - White
Geographical mobility - Moved within same county (%) - Black or African American
Geographical mobility - Moved within same county (%) - Asian
Geographical mobility - Moved within same county (%) - Hispanic or Latino
Geographical mobility - Moved within same county (%) - American Indian and Alaska Native
Geographical mobility - Moved within same county (%) - Multirace
Geographical mobility - Moved within same county (%) - Other Race
Geographical mobility - Moved from different county within same state (%)
Geographical mobility - Moved from different county within same state (%) - White
Geographical mobility - Moved from different county within same state (%) - Black or African American
Geographical mobility - Moved from different county within same state (%) - Asian
Geographical mobility - Moved from different county within same state (%) - Hispanic or Latino
Geographical mobility - Moved from different county within same state (%) - American Indian and Alaska Native
Geographical mobility - Moved from different county within same state (%) - Multirace
Geographical mobility - Moved from different county within same state (%) - Other Race
Geographical mobility - Moved from different state (%)
Geographical mobility - Moved from different state (%) - White
Geographical mobility - Moved from different state (%) - Black or African American
Geographical mobility - Moved from different state (%) - Asian
Geographical mobility - Moved from different state (%) - Hispanic or Latino
Geographical mobility - Moved from different state (%) - American Indian and Alaska Native
Geographical mobility - Moved from different state (%) - Multirace
Geographical mobility - Moved from different state (%) - Other Race
Geographical mobility - Moved from abroad (%)
Geographical mobility - Moved from abroad (%) - White
Geographical mobility - Moved from abroad (%) - Black or African American
Geographical mobility - Moved from abroad (%) - Asian
Geographical mobility - Moved from abroad (%) - Hispanic or Latino
Geographical mobility - Moved from abroad (%) - American Indian and Alaska Native
Geographical mobility - Moved from abroad (%) - Multirace
Geographical mobility - Moved from abroad (%) - Other Race
Place of birth for the foreign-born population - Ireland (%)
Place of birth for the foreign-born population - Denmark (%)
Place of birth for the foreign-born population - Norway (%)
Place of birth for the foreign-born population - Sweden (%)
Place of birth for the foreign-born population - United Kingdom (%)
Place of birth for the foreign-born population - England (%)
Place of birth for the foreign-born population - Scotland (%)
Place of birth for the foreign-born population - Other Northern Europe (%)
Place of birth for the foreign-born population - Austria (%)
Place of birth for the foreign-born population - Belgium (%)
Place of birth for the foreign-born population - France (%)
Place of birth for the foreign-born population - Germany (%)
Place of birth for the foreign-born population - Netherlands (%)
Place of birth for the foreign-born population - Switzerland (%)
Place of birth for the foreign-born population - Other Western Europe (%)
Place of birth for the foreign-born population - Greece (%)
Place of birth for the foreign-born population - Italy (%)
Place of birth for the foreign-born population - Portugal (%)
Place of birth for the foreign-born population - Spain (%)
Place of birth for the foreign-born population - Other Southern Europe (%)
Place of birth for the foreign-born population - Albania (%)
Place of birth for the foreign-born population - Belarus (%)
Place of birth for the foreign-born population - Bosnia and Herzegovina (%)
Place of birth for the foreign-born population - Bulgaria (%)
Place of birth for the foreign-born population - Croatia (%)
Place of birth for the foreign-born population - Czechoslovakia (%)
Place of birth for the foreign-born population - Hungary (%)
Place of birth for the foreign-born population - Latvia (%)
Place of birth for the foreign-born population - Lithuania (%)
Place of birth for the foreign-born population - North Macedonia (Macedonia) (%)
Place of birth for the foreign-born population - Moldova (%)
Place of birth for the foreign-born population - Poland (%)
Place of birth for the foreign-born population - Romania (%)
Place of birth for the foreign-born population - Russia (%)
Place of birth for the foreign-born population - Serbia (%)
Place of birth for the foreign-born population - Ukraine (%)
Place of birth for the foreign-born population - Other Eastern Europe (%)
Place of birth for the foreign-born population - China (%)
Place of birth for the foreign-born population - Hong Kong (%)
Place of birth for the foreign-born population - Taiwan (%)
Place of birth for the foreign-born population - Japan (%)
Place of birth for the foreign-born population - Korea (%)
Place of birth for the foreign-born population - Other Eastern Asia (%)
Place of birth for the foreign-born population - Afghanistan (%)
Place of birth for the foreign-born population - Bangladesh (%)
Place of birth for the foreign-born population - India (%)
Place of birth for the foreign-born population - Iran (%)
Place of birth for the foreign-born population - Kazakhstan (%)
Place of birth for the foreign-born population - Nepal (%)
Place of birth for the foreign-born population - Pakistan (%)
Place of birth for the foreign-born population - Sri Lanka (%)
Place of birth for the foreign-born population - Uzbekistan (%)
Place of birth for the foreign-born population - Other South Central Asia (%)
Place of birth for the foreign-born population - Burma (%)
Place of birth for the foreign-born population - Cambodia (%)
Place of birth for the foreign-born population - Indonesia (%)
Place of birth for the foreign-born population - Laos (%)
Place of birth for the foreign-born population - Malaysia (%)
Place of birth for the foreign-born population - Philippines (%)
Place of birth for the foreign-born population - Singapore (%)
Place of birth for the foreign-born population - Thailand (%)
Place of birth for the foreign-born population - Vietnam (%)
Place of birth for the foreign-born population - Other South Eastern Asia (%)
Place of birth for the foreign-born population - Armenia (%)
Place of birth for the foreign-born population - Iraq (%)
Place of birth for the foreign-born population - Israel (%)
Place of birth for the foreign-born population - Jordan (%)
Place of birth for the foreign-born population - Kuwait (%)
Place of birth for the foreign-born population - Lebanon (%)
Place of birth for the foreign-born population - Saudi Arabia (%)
Place of birth for the foreign-born population - Syria (%)
Place of birth for the foreign-born population - Turkey (%)
Place of birth for the foreign-born population - Yemen (%)
Place of birth for the foreign-born population - Other Western Asia (%)
Place of birth for the foreign-born population - Eritrea (%)
Place of birth for the foreign-born population - Ethiopia (%)
Place of birth for the foreign-born population - Kenya (%)
Place of birth for the foreign-born population - Somalia (%)
Place of birth for the foreign-born population - Uganda (%)
Place of birth for the foreign-born population - Zimbabwe (%)
Place of birth for the foreign-born population - Other Eastern Africa (%)
Place of birth for the foreign-born population - Cameroon (%)
Place of birth for the foreign-born population - Congo (%)
Place of birth for the foreign-born population - Democratic Republic of Congo (Zaire) (%)
Place of birth for the foreign-born population - Other Middle Africa (%)
Place of birth for the foreign-born population - Egypt (%)
Place of birth for the foreign-born population - Morocco (%)
Place of birth for the foreign-born population - Sudan (%)
Place of birth for the foreign-born population - Other Northern Africa (%)
Place of birth for the foreign-born population - South Africa (%)
Place of birth for the foreign-born population - Other Southern Africa (%)
Place of birth for the foreign-born population - Cabo Verde (%)
Place of birth for the foreign-born population - Ghana (%)
Place of birth for the foreign-born population - Liberia (%)
Place of birth for the foreign-born population - Nigeria (%)
Place of birth for the foreign-born population - Senegal (%)
Place of birth for the foreign-born population - Sierra Leone (%)
Place of birth for the foreign-born population - Other Western Africa (%)
Place of birth for the foreign-born population - Australia (%)
Place of birth for the foreign-born population - New Zealand (%)
Place of birth for the foreign-born population - Fiji (%)
Place of birth for the foreign-born population - Micronesia (%)
Place of birth for the foreign-born population - Bahamas (%)
Place of birth for the foreign-born population - Barbados (%)
Place of birth for the foreign-born population - Cuba (%)
Place of birth for the foreign-born population - Dominica (%)
Place of birth for the foreign-born population - Dominican Republic (%)
Place of birth for the foreign-born population - Grenada (%)
Place of birth for the foreign-born population - Haiti (%)
Place of birth for the foreign-born population - Jamaica (%)
Place of birth for the foreign-born population - St. Vincent and the Grenadines (%)
Place of birth for the foreign-born population - Trinidad and Tobago (%)
Place of birth for the foreign-born population - West Indies (%)
Place of birth for the foreign-born population - Other Caribbean (%)
Place of birth for the foreign-born population - Belize (%)
Place of birth for the foreign-born population - Costa Rica (%)
Place of birth for the foreign-born population - El Salvador (%)
Place of birth for the foreign-born population - Guatemala (%)
Place of birth for the foreign-born population - Honduras (%)
Place of birth for the foreign-born population - Mexico (%)
Place of birth for the foreign-born population - Nicaragua (%)
Place of birth for the foreign-born population - Panama (%)
Place of birth for the foreign-born population - Other Central America (%)
Place of birth for the foreign-born population - Argentina (%)
Place of birth for the foreign-born population - Bolivia (%)
Place of birth for the foreign-born population - Brazil (%)
Place of birth for the foreign-born population - Chile (%)
Place of birth for the foreign-born population - Colombia (%)
Place of birth for the foreign-born population - Ecuador (%)
Place of birth for the foreign-born population - Guyana (%)
Place of birth for the foreign-born population - Peru (%)
Place of birth for the foreign-born population - Uruguay (%)
Place of birth for the foreign-born population - Venezuela (%)
Place of birth for the foreign-born population - Other South America (%)
Place of birth for the foreign-born population - Canada (%)
Place of birth for the foreign-born population - Other Northern America (%)
Place of birth for the foreign-born population - Other (%)
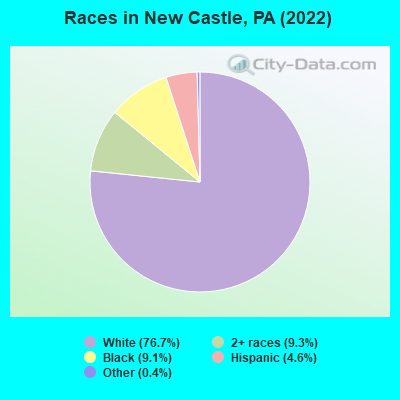
According to 2022 data, the most numerous races in New Castle, PA are White alone (16,552 residents), Black alone (1,955 residents), and Hispanic (1,002 residents). 94.6% of New Castle residents speak English at home. 1.6% of New Castle, PA residents are foreign-born , which is 331.9% less than the foreign-born rate of 7.0% across the entire state of Pennsylvania.
Race distribution in New Castle
2000 2022
10,322,455 84.1% White alone 1,202,437 9.8% Black alone 394,088 3.2% Hispanic 218,296 1.8% Asian alone 113,097 0.9% Two or more races 13,086 0.1% Other race alone 14,904 0.1% American Indian alone 2,691 0.02% Native Hawaiian and Other
9,487,228 73.1% White alone 1,311,581 10.1% Black alone 1,115,997 8.6% Hispanic 493,942 3.8% Two or more races 487,124 3.8% Asian alone 63,582 0.5% Other race alone 10,130 0.08% American Indian alone 2,424 0.02% Native Hawaiian and Other
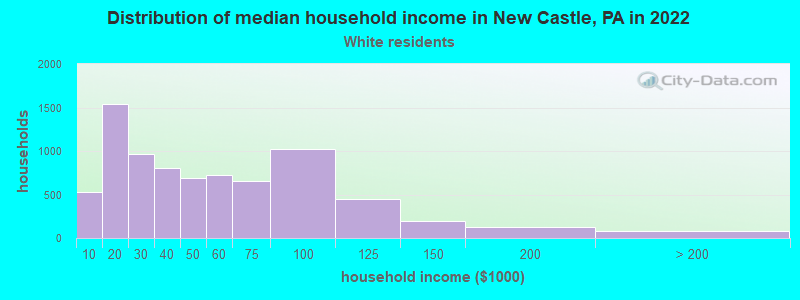
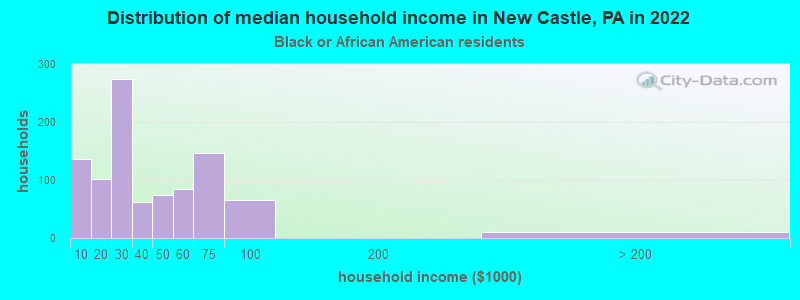
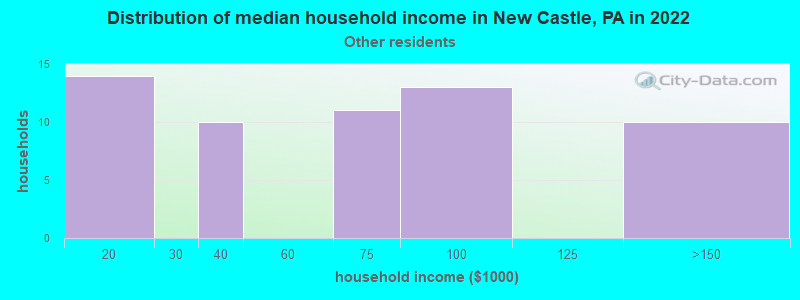
Income and house value in New Castle Median household income in 2022 $43,816 White non-Hispanic householders$23,396 Black householders$41,739 Two or more races householdersMedian 2022 house value $70,245 White Non-Hispanic householders$55,869 Black or African American householders $211,063 Asian householders$89,848 Some other race householders$57,830 Two or more races householders$60,607 Hispanic or Latino householders
Median age by race in New Castle
43.3 Median age for White residents40.3 46.1 25.0 Median age for Black or African American residents25.3 23.8 -642,857,142.2 Median age for American Indian / Alaska Native residents-714,583,332.6 -666,666,666.0 -457,960,643.5 Median age for Asian residents-539,748,953.4 -446,009,389.2 -666,666,666.0 Median age for Native Hawaiian / Pacific Islander residents-666,666,666.0 -666,666,666.0 60.0 Median age for Other race residents62.8 42.2 19.4 Median age for Two or more races residents18.9 21.7 44.2 Median age for White alone residents40.7 46.6 21.3 Median age for Hispanic or Latino residents19.7 23.7
Owner/renter occupied households by race in New Castle
House owners and renters - White residents 4,318 56.6% Owner occupied3,316 43.4% Renter occupiedHouse owners and renters - Black or African American residents 345 41.5% Owner occupied486 58.5% Renter occupiedHouse owners and renters - American Indian / Alaska Native residents 11 100.0% Renter occupiedHouse owners and renters - Other race residents 44 71.0% Owner occupied18 29.0% Renter occupiedHouse owners and renters - Two or more races residents 205 33.7% Owner occupied403 66.3% Renter occupiedHouse owners and renters - White alone residents 4,272 56.9% Owner occupied3,233 43.1% Renter occupiedHouse owners and renters - Hispanic or Latino residents 82 25.4% Owner occupied239 74.6% Renter occupied
Language usage in New Castle
English speakers - Total 94.6% of residents of New Castle speak English at home.
3.0% of residents speak Spanish at home 390 64.3% Speak English very well217 35.7% Speak English less than very well2.1% of residents speak other language at home 227 53.4% Speak English very well198 46.6% Speak English less than very well
English speakers - Born in the United States 94.3% of residents of New Castle speak English at home.
3.9% of residents speak Spanish at home 147 100.0% Speak English very well1.3% of residents speak other language at home 51 100.0% Speak English very well
English speakers - Native, born elsewhere 9.0% of residents of New Castle speak English at home.
82.8% of residents speak Spanish at home 98 53.6% Speak English very well85 46.4% Speak English less than very well0.5% of residents speak other language at home 1 100.0% Speak English very well
English speakers - Foreign-born 12.6% of residents of New Castle speak English at home.
36.6% of residents speak Spanish at home 42 32.8% Speak English very well86 67.2% Speak English less than very well53.4% of residents speak other language at home 26 13.9% Speak English very well161 86.1% Speak English less than very well
White (Caucasian) - Speak only English Native:
96.8% (15,423)Foreign-born:
5.9% (12)
White (Caucasian) - Speak another language Native:
3.1% (500)Foreign-born:
100.0% (196)
Black or African American - Speak only English Native:
99.6% (2,056)Foreign-born:
100.0% (18)
Other race - Speak another language Native:
37.6% (35)Foreign-born:
100.0% (87)
Two or more races - Speak another language Native:
7.6% (181)Foreign-born:
100.0% (53)
White alone - Speak only English Native:
98.5% (15,323)Foreign-born:
6.4% (12)
White alone - Speak another language Native:
1.5% (238)Foreign-born:
100.0% (181)
Hispanic or Latino - Speak another language Native:
53.7% (394)Foreign-born:
100.0% (127)
Foreign-born residents in New Castle 350 residents are foreign born
This city:
1.6%Pennsylvania:
7.3%
Marital status for residents in New Castle Marital status - White (Caucasian) population 15 years and over
Males 34.9% Never married41.4% Now married1.9% Separated4.1% Widowed17.6% DivorcedFemales 31.7% Never married34.4% Now married3.9% Separated16.9% Widowed13.0% DivorcedWomen who gave birth in the past 12 months Now married:
41.9% (112)Unmarried:
58.1% (155)
Women who did not give birth in the past 12 months Now married:
31.3% (1,063)Unmarried:
68.7% (2,333)
Marital status - Black or African American population 15 years and over
Males 60.9% Never married16.0% Now married2.3% Separated3.4% Widowed17.4% DivorcedFemales 55.1% Never married14.6% Now married8.5% Separated6.4% Widowed15.4% DivorcedWomen who gave birth in the past 12 months Now married:
0.0% (0)Unmarried:
100.0% (20)
Women who did not give birth in the past 12 months Now married:
17.4% (89)Unmarried:
82.6% (424)
Marital status - Other race population 15 years and over
Males 35.1% Never married48.1% Now married0.0% Separated0.0% Widowed16.9% DivorcedFemales 55.9% Never married44.1% Now married0.0% Separated0.0% Widowed0.0% DivorcedWomen who gave birth in the past 12 months Now married:
68.8% (14)Unmarried:
31.2% (6)
Women who did not give birth in the past 12 months Now married:
17.6% (7)Unmarried:
82.4% (35)
Marital status - Two or more races population 15 years and over
Males 56.4% Never married15.0% Now married1.2% Separated0.0% Widowed27.4% DivorcedFemales 68.2% Never married12.6% Now married0.0% Separated5.0% Widowed14.2% DivorcedWomen who gave birth in the past 12 months Now married:
0.0% (0)Unmarried:
100.0% (45)
Women who did not give birth in the past 12 months Now married:
11.6% (87)Unmarried:
88.4% (662)
Marital status - White alone, not Hispanic / Latino population 15 years and over
Males 34.1% Never married42.0% Now married1.9% Separated4.2% Widowed17.8% DivorcedFemales 30.8% Never married35.0% Now married4.0% Separated17.0% Widowed13.1% DivorcedWomen who gave birth in the past 12 months Now married:
41.9% (112)Unmarried:
58.1% (155)
Women who did not give birth in the past 12 months Now married:
32.3% (1,060)Unmarried:
67.7% (2,218)
Marital status - Hispanic or Latino population 15 years and over
Males 67.1% Never married19.7% Now married0.0% Separated0.0% Widowed13.2% DivorcedFemales 77.3% Never married14.2% Now married0.0% Separated5.4% Widowed3.2% DivorcedWomen who gave birth in the past 12 months Now married:
68.8% (15)Unmarried:
31.2% (7)
Women who did not give birth in the past 12 months Now married:
10.2% (31)Unmarried:
89.8% (275)
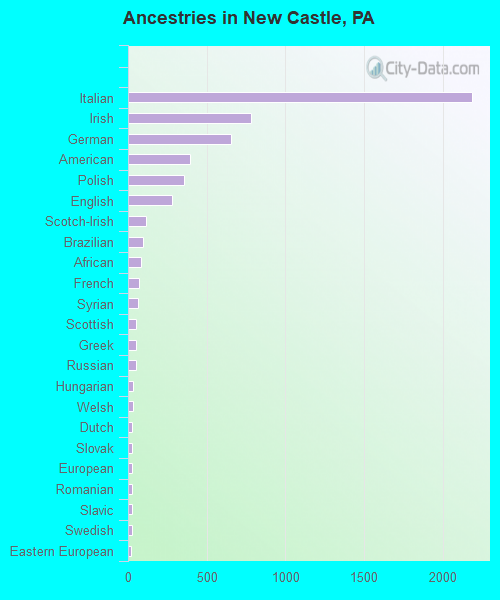
Ancestries in New Castle
2,186 25.6% Italian780 9.1% Irish655 7.7% German393 4.6% American359 4.2% Polish277 3.2% English113 1.3% Scotch-Irish94 1.1% Brazilian84 1.0% African67 0.8% French62 0.7% Syrian53 0.6% Scottish51 0.6% Greek50 0.6% Russian31 0.4% Hungarian29 0.3% Welsh27 0.3% Dutch27 0.3% Slovak26 0.3% European24 0.3% Romanian24 0.3% Slavic24 0.3% Swedish20 0.2% Eastern European19 0.2% Bahamian18 0.2% Finnish14 0.2% Croatian10 0.1% French Canadian8 0.09% Ukrainian7 0.08% British6 0.07% Northern European4 0.05% Slovene
Geographical mobility in New Castle Same house 1 year ago 13,874 82.5% White (Caucasian)1,730 88.7% Black or African American221 96.9% Other race2,057 79.5% Two or more races13,631 83.0% White alone, not Hispanic / Latino563 60.1% Hispanic or LatinoMoved within same county 1,641 9.8% White / Caucasian119 6.1% Black or African American12 100.0% American Indian / Alaska Native255 9.8% Two or more races1,475 9.0% White alone, not Hispanic / Latino209 22.3% Hispanic or LatinoMoved within same state 647 3.8% White / Caucasian80 4.1% Black or African American10 4.4% Other race44 1.7% Two or more races643 3.9% White alone, not Hispanic / LatinoMoved from different state 620 3.7% White / Caucasian131 6.7% Black or African American47 1.8% Two or more races613 3.7% White alone, not Hispanic / Latino17 1.8% Hispanic or LatinoMoved from abroad 10 0.1% White231 8.9% Two or more races10 0.1% White alone, not Hispanic / Latino134 14.3% Hispanic or Latino
Children Nativity (place of birth) in New Castle
Children under 6 years - Living with two parents Both parents native 571 100.0% Native0 0.0% Foreign-bornBoth parents foreign-born 39 86.0% Native6 14.0% Foreign-bornChildren under 6 years - Living with one parent Native parent 947 100.0% Native
Children 6 to 17 years - Living with two parents Both parents native 1,329 100.0% NativeOne native, one foreign-born parent 24 100.0% NativeChildren 6 to 17 years - Living with one parent Native parent 1,956 98.2% Native35 1.8% Foreign-bornForeign-born parent 28 100.0% Native
Grandparents responsible for own grandchildren in New Castle
Grandparents (30 to 59 years) White / Caucasian 61 66.2% Responsible for grandchildren31 33.8% Not responsible for grandchildrenBlack or African American 23 80.9% Responsible for grandchildren5 19.1% Not responsible for grandchildrenTwo or more races 30 100.0% Not responsible for grandchildrenWhite alone, not Hispanic / Latino 65 66.4% Responsible for grandchildren33 33.6% Not responsible for grandchildrenGrandparents (60 years and over) White / Caucasian 59 20.0% Responsible for grandchildren235 80.0% Not responsible for grandchildrenBlack or African American 4 30.4% Responsible for grandchildren10 69.6% Not responsible for grandchildrenWhite alone, not Hispanic / Latino 59 20.0% Responsible for grandchildren235 80.0% Not responsible for grandchildren