Races in New Orleans, Louisiana (LA) Detailed Stats
Data:
Races - White alone (%)
Races - White alone (% change since 2000)
Races - Black alone (%)
Races - Black alone (% change since 2000)
Races - American Indian alone (%)
Races - American Indian alone (% change since 2000)
Races - Asian alone (%)
Races - Asian alone (% change since 2000)
Races - Hispanic (%)
Races - Hispanic (% change since 2000)
Races - Native Hawaiian and Other Pacific Islander alone (%)
Races - Native Hawaiian and Other Pacific Islander alone (% change since 2000)
Races - Two or more races(%)
Races - Two or more races(% change since 2000)
Races - Other race alone (%)
Races - Other race alone (% change since 2000)
Racial diversity
Place of birth - Born in state of residence (%)
Place of birth - Born in state of residence (%) - White
Place of birth - Born in state of residence (%) - Black or African American
Place of birth - Born in state of residence (%) - Asian
Place of birth - Born in state of residence (%) - Hispanic or Latino
Place of birth - Born in state of residence (%) - American Indian and Alaska Native
Place of birth - Born in state of residence (%) - Multirace
Place of birth - Born in state of residence (%) - Other Race
Place of birth - Born in other state (%)
Place of birth - Born in other state (%) - White
Place of birth - Born in other state (%) - Black or African American
Place of birth - Born in other state (%) - Asian
Place of birth - Born in other state (%) - Hispanic or Latino
Place of birth - Born in other state (%) - American Indian and Alaska Native
Place of birth - Born in other state (%) - Multirace
Place of birth - Born in other state (%) - Other Race
Place of birth - Native, outside of US (%)
Place of birth - Native, outside of US (%) - White
Place of birth - Native, outside of US (%) - Black or African American
Place of birth - Native, outside of US (%) - Asian
Place of birth - Native, outside of US (%) - Hispanic or Latino
Place of birth - Native, outside of US (%) - American Indian and Alaska Native
Place of birth - Native, outside of US (%) - Multirace
Place of birth - Native, outside of US (%) - Other Race
Place of birth - Foreign born (%)
Place of birth - Foreign born (%) - White
Place of birth - Foreign born (%) - Black or African American
Place of birth - Foreign born (%) - Asian
Place of birth - Foreign born (%) - Hispanic or Latino
Place of birth - Foreign born (%) - American Indian and Alaska Native
Place of birth - Foreign born (%) - Multirace
Place of birth - Foreign born (%) - Other Race
Residents speaking English at home (%)
Residents speaking English at home - Born in the United States (%)
Residents speaking English at home - Native, born elsewhere (%)
Residents speaking English at home - Foreign born (%)
Residents speaking Spanish at home (%)
Residents speaking Spanish at home - Born in the United States (%)
Residents speaking Spanish at home - Native, born elsewhere (%)
Residents speaking Spanish at home - Foreign born (%)
Residents speaking other language at home (%)
Residents speaking other language at home - Born in the United States (%)
Residents speaking other language at home - Native, born elsewhere (%)
Residents speaking other language at home - Foreign born (%)
Marital status - Never married (%)
Marital status - Now married (%)
Marital status - Separated (%)
Marital status - Widowed (%)
Marital status - Divorced (%)
Ancestries Reported - Arab (%)
Ancestries Reported - Czech (%)
Ancestries Reported - Danish (%)
Ancestries Reported - Dutch (%)
Ancestries Reported - English (%)
Ancestries Reported - French (%)
Ancestries Reported - French Canadian (%)
Ancestries Reported - German (%)
Ancestries Reported - Greek (%)
Ancestries Reported - Hungarian (%)
Ancestries Reported - Irish (%)
Ancestries Reported - Italian (%)
Ancestries Reported - Lithuanian (%)
Ancestries Reported - Norwegian (%)
Ancestries Reported - Polish (%)
Ancestries Reported - Portuguese (%)
Ancestries Reported - Russian (%)
Ancestries Reported - Scotch-Irish (%)
Ancestries Reported - Scottish (%)
Ancestries Reported - Slovak (%)
Ancestries Reported - Subsaharan African (%)
Ancestries Reported - Swedish (%)
Ancestries Reported - Swiss (%)
Ancestries Reported - Ukrainian (%)
Ancestries Reported - United States (%)
Ancestries Reported - Welsh (%)
Ancestries Reported - West Indian (%)
Ancestries Reported - Other (%)
Geographical mobility - Same house 1 year ago (%)
Geographical mobility - Same house 1 year ago (%) - White
Geographical mobility - Same house 1 year ago (%) - Black or African American
Geographical mobility - Same house 1 year ago (%) - Asian
Geographical mobility - Same house 1 year ago (%) - Hispanic or Latino
Geographical mobility - Same house 1 year ago (%) - American Indian and Alaska Native
Geographical mobility - Same house 1 year ago (%) - Multirace
Geographical mobility - Same house 1 year ago (%) - Other Race
Geographical mobility - Moved within same county (%)
Geographical mobility - Moved within same county (%) - White
Geographical mobility - Moved within same county (%) - Black or African American
Geographical mobility - Moved within same county (%) - Asian
Geographical mobility - Moved within same county (%) - Hispanic or Latino
Geographical mobility - Moved within same county (%) - American Indian and Alaska Native
Geographical mobility - Moved within same county (%) - Multirace
Geographical mobility - Moved within same county (%) - Other Race
Geographical mobility - Moved from different county within same state (%)
Geographical mobility - Moved from different county within same state (%) - White
Geographical mobility - Moved from different county within same state (%) - Black or African American
Geographical mobility - Moved from different county within same state (%) - Asian
Geographical mobility - Moved from different county within same state (%) - Hispanic or Latino
Geographical mobility - Moved from different county within same state (%) - American Indian and Alaska Native
Geographical mobility - Moved from different county within same state (%) - Multirace
Geographical mobility - Moved from different county within same state (%) - Other Race
Geographical mobility - Moved from different state (%)
Geographical mobility - Moved from different state (%) - White
Geographical mobility - Moved from different state (%) - Black or African American
Geographical mobility - Moved from different state (%) - Asian
Geographical mobility - Moved from different state (%) - Hispanic or Latino
Geographical mobility - Moved from different state (%) - American Indian and Alaska Native
Geographical mobility - Moved from different state (%) - Multirace
Geographical mobility - Moved from different state (%) - Other Race
Geographical mobility - Moved from abroad (%)
Geographical mobility - Moved from abroad (%) - White
Geographical mobility - Moved from abroad (%) - Black or African American
Geographical mobility - Moved from abroad (%) - Asian
Geographical mobility - Moved from abroad (%) - Hispanic or Latino
Geographical mobility - Moved from abroad (%) - American Indian and Alaska Native
Geographical mobility - Moved from abroad (%) - Multirace
Geographical mobility - Moved from abroad (%) - Other Race
Place of birth for the foreign-born population - Ireland (%)
Place of birth for the foreign-born population - Denmark (%)
Place of birth for the foreign-born population - Norway (%)
Place of birth for the foreign-born population - Sweden (%)
Place of birth for the foreign-born population - United Kingdom (%)
Place of birth for the foreign-born population - England (%)
Place of birth for the foreign-born population - Scotland (%)
Place of birth for the foreign-born population - Other Northern Europe (%)
Place of birth for the foreign-born population - Austria (%)
Place of birth for the foreign-born population - Belgium (%)
Place of birth for the foreign-born population - France (%)
Place of birth for the foreign-born population - Germany (%)
Place of birth for the foreign-born population - Netherlands (%)
Place of birth for the foreign-born population - Switzerland (%)
Place of birth for the foreign-born population - Other Western Europe (%)
Place of birth for the foreign-born population - Greece (%)
Place of birth for the foreign-born population - Italy (%)
Place of birth for the foreign-born population - Portugal (%)
Place of birth for the foreign-born population - Spain (%)
Place of birth for the foreign-born population - Other Southern Europe (%)
Place of birth for the foreign-born population - Albania (%)
Place of birth for the foreign-born population - Belarus (%)
Place of birth for the foreign-born population - Bosnia and Herzegovina (%)
Place of birth for the foreign-born population - Bulgaria (%)
Place of birth for the foreign-born population - Croatia (%)
Place of birth for the foreign-born population - Czechoslovakia (%)
Place of birth for the foreign-born population - Hungary (%)
Place of birth for the foreign-born population - Latvia (%)
Place of birth for the foreign-born population - Lithuania (%)
Place of birth for the foreign-born population - North Macedonia (Macedonia) (%)
Place of birth for the foreign-born population - Moldova (%)
Place of birth for the foreign-born population - Poland (%)
Place of birth for the foreign-born population - Romania (%)
Place of birth for the foreign-born population - Russia (%)
Place of birth for the foreign-born population - Serbia (%)
Place of birth for the foreign-born population - Ukraine (%)
Place of birth for the foreign-born population - Other Eastern Europe (%)
Place of birth for the foreign-born population - China (%)
Place of birth for the foreign-born population - Hong Kong (%)
Place of birth for the foreign-born population - Taiwan (%)
Place of birth for the foreign-born population - Japan (%)
Place of birth for the foreign-born population - Korea (%)
Place of birth for the foreign-born population - Other Eastern Asia (%)
Place of birth for the foreign-born population - Afghanistan (%)
Place of birth for the foreign-born population - Bangladesh (%)
Place of birth for the foreign-born population - India (%)
Place of birth for the foreign-born population - Iran (%)
Place of birth for the foreign-born population - Kazakhstan (%)
Place of birth for the foreign-born population - Nepal (%)
Place of birth for the foreign-born population - Pakistan (%)
Place of birth for the foreign-born population - Sri Lanka (%)
Place of birth for the foreign-born population - Uzbekistan (%)
Place of birth for the foreign-born population - Other South Central Asia (%)
Place of birth for the foreign-born population - Burma (%)
Place of birth for the foreign-born population - Cambodia (%)
Place of birth for the foreign-born population - Indonesia (%)
Place of birth for the foreign-born population - Laos (%)
Place of birth for the foreign-born population - Malaysia (%)
Place of birth for the foreign-born population - Philippines (%)
Place of birth for the foreign-born population - Singapore (%)
Place of birth for the foreign-born population - Thailand (%)
Place of birth for the foreign-born population - Vietnam (%)
Place of birth for the foreign-born population - Other South Eastern Asia (%)
Place of birth for the foreign-born population - Armenia (%)
Place of birth for the foreign-born population - Iraq (%)
Place of birth for the foreign-born population - Israel (%)
Place of birth for the foreign-born population - Jordan (%)
Place of birth for the foreign-born population - Kuwait (%)
Place of birth for the foreign-born population - Lebanon (%)
Place of birth for the foreign-born population - Saudi Arabia (%)
Place of birth for the foreign-born population - Syria (%)
Place of birth for the foreign-born population - Turkey (%)
Place of birth for the foreign-born population - Yemen (%)
Place of birth for the foreign-born population - Other Western Asia (%)
Place of birth for the foreign-born population - Eritrea (%)
Place of birth for the foreign-born population - Ethiopia (%)
Place of birth for the foreign-born population - Kenya (%)
Place of birth for the foreign-born population - Somalia (%)
Place of birth for the foreign-born population - Uganda (%)
Place of birth for the foreign-born population - Zimbabwe (%)
Place of birth for the foreign-born population - Other Eastern Africa (%)
Place of birth for the foreign-born population - Cameroon (%)
Place of birth for the foreign-born population - Congo (%)
Place of birth for the foreign-born population - Democratic Republic of Congo (Zaire) (%)
Place of birth for the foreign-born population - Other Middle Africa (%)
Place of birth for the foreign-born population - Egypt (%)
Place of birth for the foreign-born population - Morocco (%)
Place of birth for the foreign-born population - Sudan (%)
Place of birth for the foreign-born population - Other Northern Africa (%)
Place of birth for the foreign-born population - South Africa (%)
Place of birth for the foreign-born population - Other Southern Africa (%)
Place of birth for the foreign-born population - Cabo Verde (%)
Place of birth for the foreign-born population - Ghana (%)
Place of birth for the foreign-born population - Liberia (%)
Place of birth for the foreign-born population - Nigeria (%)
Place of birth for the foreign-born population - Senegal (%)
Place of birth for the foreign-born population - Sierra Leone (%)
Place of birth for the foreign-born population - Other Western Africa (%)
Place of birth for the foreign-born population - Australia (%)
Place of birth for the foreign-born population - New Zealand (%)
Place of birth for the foreign-born population - Fiji (%)
Place of birth for the foreign-born population - Micronesia (%)
Place of birth for the foreign-born population - Bahamas (%)
Place of birth for the foreign-born population - Barbados (%)
Place of birth for the foreign-born population - Cuba (%)
Place of birth for the foreign-born population - Dominica (%)
Place of birth for the foreign-born population - Dominican Republic (%)
Place of birth for the foreign-born population - Grenada (%)
Place of birth for the foreign-born population - Haiti (%)
Place of birth for the foreign-born population - Jamaica (%)
Place of birth for the foreign-born population - St. Vincent and the Grenadines (%)
Place of birth for the foreign-born population - Trinidad and Tobago (%)
Place of birth for the foreign-born population - West Indies (%)
Place of birth for the foreign-born population - Other Caribbean (%)
Place of birth for the foreign-born population - Belize (%)
Place of birth for the foreign-born population - Costa Rica (%)
Place of birth for the foreign-born population - El Salvador (%)
Place of birth for the foreign-born population - Guatemala (%)
Place of birth for the foreign-born population - Honduras (%)
Place of birth for the foreign-born population - Mexico (%)
Place of birth for the foreign-born population - Nicaragua (%)
Place of birth for the foreign-born population - Panama (%)
Place of birth for the foreign-born population - Other Central America (%)
Place of birth for the foreign-born population - Argentina (%)
Place of birth for the foreign-born population - Bolivia (%)
Place of birth for the foreign-born population - Brazil (%)
Place of birth for the foreign-born population - Chile (%)
Place of birth for the foreign-born population - Colombia (%)
Place of birth for the foreign-born population - Ecuador (%)
Place of birth for the foreign-born population - Guyana (%)
Place of birth for the foreign-born population - Peru (%)
Place of birth for the foreign-born population - Uruguay (%)
Place of birth for the foreign-born population - Venezuela (%)
Place of birth for the foreign-born population - Other South America (%)
Place of birth for the foreign-born population - Canada (%)
Place of birth for the foreign-born population - Other Northern America (%)
Place of birth for the foreign-born population - Other (%)
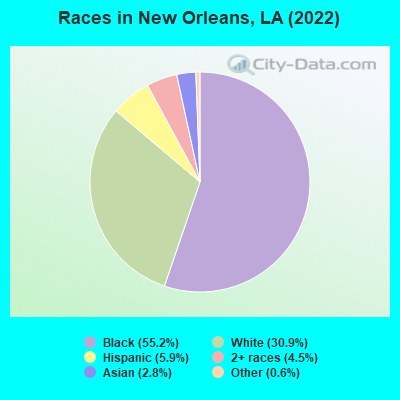
According to 2022 data, the most numerous races in New Orleans, LA are White alone (114,264 residents), Black alone (203,983 residents), and Hispanic (21,909 residents). 91.0% of New Orleans residents speak English at home. 5.9% of New Orleans, LA residents are foreign-born (2.5% born in Latin America, 2.0% born in Asia, 0.6% born in Europe), which is 31.6% greater than the foreign-born rate of 4.0% across the entire state of Louisiana.
Race distribution in New Orleans
2000 2022
323,392 66.7% Black alone 128,871 26.6% White alone 14,826 3.1% Hispanic 10,919 2.3% Asian alone 4,765 1.0% Two or more races 852 0.2% American Indian alone 961 0.2% Other race alone 88 0.02% Native Hawaiian and Other
203,983 55.2% Black alone 114,264 30.9% White alone 21,909 5.9% Hispanic 16,491 4.5% Two or more races 10,479 2.8% Asian alone 2,287 0.6% Other race alone 327 0.09% American Indian alone
2000 2022
2,794,391 62.5% White alone 1,443,390 32.3% Black alone 107,738 2.4% Hispanic 54,256 1.2% Asian alone 39,260 0.9% Two or more races 24,129 0.5% American Indian alone 4,736 0.1% Other race alone 1,076 0.02% Native Hawaiian and Other
2,603,221 56.7% White alone 1,420,055 30.9% Black alone 262,213 5.7% Hispanic 183,270 4.0% Two or more races 81,169 1.8% Asian alone 19,991 0.4% American Indian alone 18,043 0.4% Other race alone 2,279 0.05% Native Hawaiian and Other
Income and house value in New Orleans Median household income in 2022 $91,148 White non-Hispanic householders$34,552 Black householders$105,461 American Indian and Alaska Native householders$61,990 Asian householders$47,908 Some other race householders$79,344 Two or more races householders$63,114 Hispanic or Latino race householdersMedian 2022 house value $475,867 White Non-Hispanic householders$253,223 Black or African American householders$286,551 American Indian or Alaska Native householders $317,817 Asian householders$270,746 Some other race householders$305,105 Two or more races householders$295,828 Hispanic or Latino householders
Median age by race in New Orleans
40.7 Median age for White residents41.4 40.0 38.5 Median age for Black or African American residents36.3 40.3 48.3 Median age for American Indian / Alaska Native residents43.6 60.8 37.7 Median age for Asian residents35.3 40.1 -666,666,666.0 Median age for Native Hawaiian / Pacific Islander residents-666,666,666.0 -666,666,666.0 37.3 Median age for Other race residents35.4 40.0 32.3 Median age for Two or more races residents33.4 30.0 41.0 Median age for White alone residents41.6 40.2 33.8 Median age for Hispanic or Latino residents34.6 32.9
Owner/renter occupied households by race in New Orleans
House owners and renters - White residents 35,135 63.7% Owner occupied20,060 36.3% Renter occupiedHouse owners and renters - Black or African American residents 38,711 48.7% Owner occupied40,842 51.3% Renter occupiedHouse owners and renters - American Indian / Alaska Native residents 162 41.3% Owner occupied231 58.7% Renter occupiedHouse owners and renters - Asian residents 2,517 68.7% Owner occupied1,148 31.3% Renter occupiedHouse owners and renters - Native Hawaiian / Pacific Islander residents 14 100.0% Renter occupiedHouse owners and renters - Other race residents 1,290 48.4% Owner occupied1,378 51.6% Renter occupiedHouse owners and renters - Two or more races residents 5,332 55.1% Owner occupied4,346 44.9% Renter occupiedHouse owners and renters - White alone residents 34,453 64.1% Owner occupied19,281 35.9% Renter occupiedHouse owners and renters - Hispanic or Latino residents 3,784 49.6% Owner occupied3,841 50.4% Renter occupied
Language usage in New Orleans
English speakers - Total 91.0% of residents of New Orleans speak English at home.
3.8% of residents speak Spanish at home 8,641 64.8% Speak English very well4,691 35.2% Speak English less than very well5.2% of residents speak other language at home 14,109 77.1% Speak English very well4,190 22.9% Speak English less than very well
English speakers - Born in the United States 94.1% of residents of New Orleans speak English at home.
2.4% of residents speak Spanish at home 1,857 85.9% Speak English very well305 14.1% Speak English less than very well3.5% of residents speak other language at home 2,863 90.3% Speak English very well309 9.7% Speak English less than very well
English speakers - Native, born elsewhere 60.3% of residents of New Orleans speak English at home.
35.9% of residents speak Spanish at home 584 63.7% Speak English very well333 36.3% Speak English less than very well3.8% of residents speak other language at home 96 100.0% Speak English very well
English speakers - Foreign-born 21.2% of residents of New Orleans speak English at home.
34.6% of residents speak Spanish at home 3,664 48.4% Speak English very well3,912 51.6% Speak English less than very well44.2% of residents speak other language at home 6,073 62.8% Speak English very well3,597 37.2% Speak English less than very well
White (Caucasian) - Speak only English Native:
96.0% (103,273)Foreign-born:
40.4% (1,767)
White (Caucasian) - Speak another language Native:
4.0% (4,295)Foreign-born:
59.6% (2,611)
Black or African American - Speak only English Native:
98.3% (186,754)Foreign-born:
39.8% (1,632)
Black or African American - Speak another language Native:
1.7% (3,310)Foreign-born:
60.2% (2,470)
American Indian / Alaska Native - Speak only English Native:
83.4% (490)Foreign-born:
4.3% (15)
American Indian / Alaska Native - Speak another language Native:
15.7% (92)Foreign-born:
99.4% (357)
Asian - Speak only English Native:
44.8% (1,868)Foreign-born:
10.3% (632)
Asian - Speak another language Native:
55.2% (2,303)Foreign-born:
89.7% (5,482)
Other race - Speak only English Native:
68.6% (2,698)Foreign-born:
12.3% (264)
Other race - Speak another language Native:
31.4% (1,234)Foreign-born:
87.7% (1,881)
Two or more races - Speak only English Native:
85.5% (18,801)Foreign-born:
6.8% (338)
Two or more races - Speak another language Native:
14.5% (3,191)Foreign-born:
93.2% (4,633)
White alone - Speak only English Native:
96.2% (101,854)Foreign-born:
48.4% (1,666)
White alone - Speak another language Native:
3.8% (4,035)Foreign-born:
51.6% (1,776)
Hispanic or Latino - Speak only English Native:
65.5% (7,837)Foreign-born:
7.9% (618)
Hispanic or Latino - Speak another language Native:
34.5% (4,128)Foreign-born:
92.1% (7,166)
Foreign-born residents in New Orleans 21,631 residents are foreign born (2.5% Latin America , 2.0% Asia , 0.6% Europe ).
This city:
5.9%Louisiana:
4.2%
Marital status for residents in New Orleans Marital status - White (Caucasian) population 15 years and over
Males 44.7% Never married45.7% Now married1.4% Separated1.2% Widowed7.0% DivorcedFemales 37.0% Never married43.6% Now married1.6% Separated5.4% Widowed12.4% DivorcedWomen who gave birth in the past 12 months Now married:
95.2% (1,281)Unmarried:
4.8% (64)
Women who did not give birth in the past 12 months Now married:
37.5% (11,091)Unmarried:
62.5% (18,500)
Marital status - Black or African American population 15 years and over
Males 58.2% Never married25.7% Now married2.3% Separated3.1% Widowed10.7% DivorcedFemales 51.1% Never married22.9% Now married3.0% Separated9.8% Widowed13.1% DivorcedWomen who gave birth in the past 12 months Now married:
19.4% (619)Unmarried:
80.6% (2,569)
Women who did not give birth in the past 12 months Now married:
19.9% (9,902)Unmarried:
80.1% (39,775)
Marital status - American Indian / Alaska Native population 15 years and over
Males 49.6% Never married35.1% Now married0.0% Separated0.0% Widowed15.3% DivorcedFemales 49.1% Never married28.5% Now married0.8% Separated3.4% Widowed18.2% DivorcedWomen who gave birth in the past 12 months Now married:
16.7% (4)Unmarried:
83.3% (21)
Women who did not give birth in the past 12 months Now married:
17.6% (28)Unmarried:
82.4% (132)
Marital status - Asian population 15 years and over
Males 45.6% Never married47.5% Now married0.0% Separated0.0% Widowed6.9% DivorcedFemales 38.2% Never married52.2% Now married0.0% Separated4.3% Widowed5.3% DivorcedWomen who gave birth in the past 12 months Now married:
100.0% (207)Unmarried:
0.0% (0)
Women who did not give birth in the past 12 months Now married:
41.0% (1,375)Unmarried:
59.0% (1,980)
Marital status - Other race population 15 years and over
Males 50.5% Never married39.7% Now married5.4% Separated0.0% Widowed4.3% DivorcedFemales 37.7% Never married33.5% Now married2.6% Separated6.5% Widowed19.8% DivorcedWomen who gave birth in the past 12 months Now married:
13.7% (37)Unmarried:
86.3% (235)
Women who did not give birth in the past 12 months Now married:
27.8% (758)Unmarried:
72.2% (1,974)
Marital status - Two or more races population 15 years and over
Males 49.1% Never married36.2% Now married1.5% Separated2.3% Widowed11.0% DivorcedFemales 42.1% Never married37.2% Now married3.5% Separated7.0% Widowed10.3% DivorcedWomen who gave birth in the past 12 months Now married:
93.9% (340)Unmarried:
6.1% (22)
Women who did not give birth in the past 12 months Now married:
30.1% (2,182)Unmarried:
69.9% (5,063)
Marital status - White alone, not Hispanic / Latino population 15 years and over
Males 44.3% Never married46.5% Now married1.2% Separated1.1% Widowed7.0% DivorcedFemales 36.7% Never married43.9% Now married1.7% Separated5.3% Widowed12.4% DivorcedWomen who gave birth in the past 12 months Now married:
95.2% (1,281)Unmarried:
4.8% (64)
Women who did not give birth in the past 12 months Now married:
37.9% (10,924)Unmarried:
62.1% (17,932)
Marital status - Hispanic or Latino population 15 years and over
Males 51.0% Never married37.9% Now married1.2% Separated1.1% Widowed8.9% DivorcedFemales 37.6% Never married41.2% Now married1.9% Separated9.2% Widowed10.1% DivorcedWomen who gave birth in the past 12 months Now married:
100.0% (344)Unmarried:
0.0% (0)
Women who did not give birth in the past 12 months Now married:
39.0% (2,013)Unmarried:
61.0% (3,154)
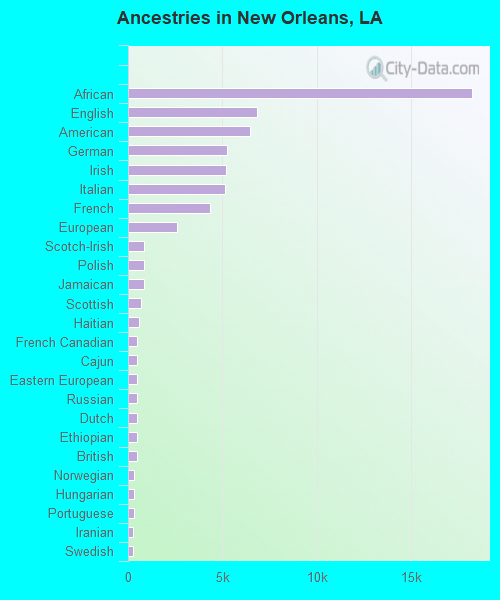
Ancestries in New Orleans
18,235 7.6% African6,844 2.8% English6,476 2.7% American5,255 2.2% German5,189 2.2% Irish5,139 2.1% Italian4,373 1.8% French2,623 1.1% European870 0.4% Scotch-Irish840 0.3% Polish833 0.3% Jamaican692 0.3% Scottish599 0.2% Haitian500 0.2% French Canadian488 0.2% Cajun487 0.2% Eastern European481 0.2% Russian479 0.2% Dutch477 0.2% Ethiopian458 0.2% British311 0.1% Norwegian301 0.1% Hungarian296 0.1% Portuguese276 0.1% Iranian274 0.1% Swedish270 0.1% Nigerian263 0.1% Greek236 0.10% West Indian209 0.09% Lebanese198 0.08% Canadian178 0.07% Scandinavian167 0.07% Turkish159 0.07% Romanian157 0.07% Welsh131 0.05% Northern European125 0.05% Croatian115 0.05% Danish112 0.05% Israeli91 0.04% Swiss87 0.04% Palestinian84 0.03% Ukrainian78 0.03% Brazilian68 0.03% Basque59 0.02% Armenian58 0.02% Latvian57 0.02% Belgian54 0.02% Albanian52 0.02% Barbadian52 0.02% Finnish49 0.02% Yugoslavian48 0.02% Belizean44 0.02% Trinidadian and Tobagonian42 0.02% Senegalese39 0.02% Zimbabwean38 0.02% Lithuanian37 0.02% Czech36 0.01% Kenyan35 0.01% Arab29 0.01% Syrian28 0.01% Austrian27 0.01% Moroccan24 0.01% Bulgarian23 0.01% South African20 0.01% Macedonian20 0.01% Guyanese19 0.01% Pennsylvania German16 0.01% Maltese14 0.01% Slavic14 0.01% U.S. Virgin Islander
Geographical mobility in New Orleans Same house 1 year ago 98,914 85.6% White (Caucasian)185,033 91.3% Black or African American727 85.7% American Indian / Alaska Native9,381 89.5% Asian63 97.8% Native Hawaiian / Pacific Islander7,649 87.6% Other race25,709 87.7% Two or more races96,732 85.7% White alone, not Hispanic / Latino18,594 86.5% Hispanic or LatinoMoved within same county 8,248 7.1% White / Caucasian11,103 5.5% Black or African American81 9.5% American Indian / Alaska Native85 0.8% Asian584 6.7% Other race1,788 6.1% Two or more races7,928 7.0% White alone, not Hispanic / Latino1,666 7.8% Hispanic or LatinoMoved within same state 2,700 2.3% White / Caucasian4,721 2.3% Black or African American37 4.3% American Indian / Alaska Native102 1.0% Asian56 0.6% Other race555 1.9% Two or more races2,554 2.3% White alone, not Hispanic / Latino444 2.1% Hispanic or LatinoMoved from different state 5,430 4.7% White / Caucasian1,417 0.7% Black or African American406 3.9% Asian2 3.3% Native Hawaiian / Pacific Islander153 1.7% Other race1,097 3.7% Two or more races5,414 4.8% White alone, not Hispanic / Latino550 2.6% Hispanic or LatinoMoved from abroad 307 0.3% White331 0.2% Black or African American504 4.8% Asian135 1.5% Other race173 0.6% Two or more races238 0.2% White alone, not Hispanic / Latino242 1.1% Hispanic or Latino
Children Nativity (place of birth) in New Orleans
Children under 6 years - Living with two parents Both parents native 8,862 100.0% NativeBoth parents foreign-born 1,307 81.6% Native295 18.4% Foreign-bornOne native, one foreign-born parent 597 100.0% NativeChildren under 6 years - Living with one parent Native parent 10,690 100.0% NativeForeign-born parent 890 100.0% NativeChildren 6 to 17 years - Living with two parents Both parents native 14,673 99.9% Native22 0.1% Foreign-bornBoth parents foreign-born 1,236 71.5% Native492 28.5% Foreign-bornOne native, one foreign-born parent 2,695 97.6% Native65 2.4% Foreign-bornChildren 6 to 17 years - Living with one parent Native parent 24,279 100.0% NativeForeign-born parent 737 58.5% Native523 41.5% Foreign-born
Place of birth for residents in New Orleans 10,524 Americas9,890 Latin America7,647 Asia6,706 Central America4,315 South Eastern Asia2,430 Europe1,823 Eastern Asia1,703 Caribbean1,479 South America1,204 China1,100 South Central Asia971 Africa742 Western Europe723 Northern Europe634 Northern America605 Eastern Europe497 Eastern Africa371 Western Asia355 Southern Europe255 Western Africa91 Middle Africa57 Oceania57 Australia and New Zealand Subregion53 Northern Africa36 Southern Africa3,786 Honduras3,536 Vietnam1,252 Mexico1,040 China701 Guatemala680 India624 Canada550 Jamaica424 Cuba414 Korea411 Philippines377 Brazil353 Nicaragua353 Colombia295 France270 Germany269 Haiti264 Ethiopia264 Iran258 United Kingdom246 England202 Peru198 Japan185 Dominican Republic184 Ecuador163 El Salvador159 Nigeria156 Italy129 Turkey123 Netherlands114 Romania108 Panama107 Thailand107 Taiwan105 Venezuela101 Trinidad and Tobago96 Spain95 Argentina92 Greece86 Poland84 Belize80 Russia76 Lebanon76 Burma (Myanmar)70 Pakistan69 Cameroon69 Bangladesh62 Costa Rica60 Laos60 Czechoslovakia58 Ukraine57 Hong Kong57 Guyana53 Australia52 Barbados52 Cambodia52 Albania50 Kenya48 Malaysia44 St. Lucia43 Dominica43 Israel43 Ireland42 Norway42 Hungary42 Bulgaria39 Syria39 Zimbabwe37 Bolivia36 South Africa35 Sweden35 Senegal30 Egypt29 Eritrea26 Ivory Coast25 Saudi Arabia24 Croatia23 Iraq23 Indonesia23 West Indies23 Chile23 Scotland20 Belgium18 Austria16 Kazakhstan15 Belarus12 Switzerland12 Sudan11 United Arab Emirates11 Ghana11 Uruguay10 Algeria10 Portugal9 Lithuania8 Uganda7 St. Vincent and the Grenadines6 Denmark4 New Zealand3 Democratic Republic of Congo (Zaire)1 Jordan
Grandparents responsible for own grandchildren in New Orleans
Grandparents (30 to 59 years) White / Caucasian 44 30.8% Responsible for grandchildren100 69.2% Not responsible for grandchildrenBlack or African American 1,014 61.2% Responsible for grandchildren644 38.8% Not responsible for grandchildrenAmerican Indian / Alaska Native 14 35.1% Responsible for grandchildren26 64.9% Not responsible for grandchildrenAsian 18 29.1% Responsible for grandchildren43 70.9% Not responsible for grandchildrenOther race 26 52.4% Responsible for grandchildren23 47.6% Not responsible for grandchildrenTwo or more races 28 80.4% Responsible for grandchildren7 19.6% Not responsible for grandchildrenWhite alone, not Hispanic / Latino 45 30.2% Responsible for grandchildren105 69.8% Not responsible for grandchildrenHispanic or Latino 25 20.3% Responsible for grandchildren100 79.7% Not responsible for grandchildrenGrandparents (60 years and over) White / Caucasian 113 19.8% Responsible for grandchildren458 80.2% Not responsible for grandchildrenBlack or African American 683 29.6% Responsible for grandchildren1,627 70.4% Not responsible for grandchildrenAsian 27 12.2% Responsible for grandchildren192 87.8% Not responsible for grandchildrenOther race 56 100.0% Not responsible for grandchildrenTwo or more races 49 23.1% Responsible for grandchildren164 76.9% Not responsible for grandchildrenWhite alone, not Hispanic / Latino 116 23.0% Responsible for grandchildren388 77.0% Not responsible for grandchildrenHispanic or Latino 23 12.8% Responsible for grandchildren160 87.2% Not responsible for grandchildren
Zip codes: 70112 , 70113 , 70114 , 70115 , 70116 , 70117 , 70118 , 70119 , 70122 , 70124 , 70125 , 70126 , 70127 , 70128 , 70129 , 70130 , 70131 , 70139, 70163.