Races in Newington, Connecticut (CT) Detailed Stats
Data:
Races - White alone (%)
Races - White alone (% change since 2000)
Races - Black alone (%)
Races - Black alone (% change since 2000)
Races - American Indian alone (%)
Races - American Indian alone (% change since 2000)
Races - Asian alone (%)
Races - Asian alone (% change since 2000)
Races - Hispanic (%)
Races - Hispanic (% change since 2000)
Races - Native Hawaiian and Other Pacific Islander alone (%)
Races - Native Hawaiian and Other Pacific Islander alone (% change since 2000)
Races - Two or more races(%)
Races - Two or more races(% change since 2000)
Races - Other race alone (%)
Races - Other race alone (% change since 2000)
Racial diversity
Place of birth - Born in state of residence (%)
Place of birth - Born in state of residence (%) - White
Place of birth - Born in state of residence (%) - Black or African American
Place of birth - Born in state of residence (%) - Asian
Place of birth - Born in state of residence (%) - Hispanic or Latino
Place of birth - Born in state of residence (%) - American Indian and Alaska Native
Place of birth - Born in state of residence (%) - Multirace
Place of birth - Born in state of residence (%) - Other Race
Place of birth - Born in other state (%)
Place of birth - Born in other state (%) - White
Place of birth - Born in other state (%) - Black or African American
Place of birth - Born in other state (%) - Asian
Place of birth - Born in other state (%) - Hispanic or Latino
Place of birth - Born in other state (%) - American Indian and Alaska Native
Place of birth - Born in other state (%) - Multirace
Place of birth - Born in other state (%) - Other Race
Place of birth - Native, outside of US (%)
Place of birth - Native, outside of US (%) - White
Place of birth - Native, outside of US (%) - Black or African American
Place of birth - Native, outside of US (%) - Asian
Place of birth - Native, outside of US (%) - Hispanic or Latino
Place of birth - Native, outside of US (%) - American Indian and Alaska Native
Place of birth - Native, outside of US (%) - Multirace
Place of birth - Native, outside of US (%) - Other Race
Place of birth - Foreign born (%)
Place of birth - Foreign born (%) - White
Place of birth - Foreign born (%) - Black or African American
Place of birth - Foreign born (%) - Asian
Place of birth - Foreign born (%) - Hispanic or Latino
Place of birth - Foreign born (%) - American Indian and Alaska Native
Place of birth - Foreign born (%) - Multirace
Place of birth - Foreign born (%) - Other Race
Residents speaking English at home (%)
Residents speaking English at home - Born in the United States (%)
Residents speaking English at home - Native, born elsewhere (%)
Residents speaking English at home - Foreign born (%)
Residents speaking Spanish at home (%)
Residents speaking Spanish at home - Born in the United States (%)
Residents speaking Spanish at home - Native, born elsewhere (%)
Residents speaking Spanish at home - Foreign born (%)
Residents speaking other language at home (%)
Residents speaking other language at home - Born in the United States (%)
Residents speaking other language at home - Native, born elsewhere (%)
Residents speaking other language at home - Foreign born (%)
Marital status - Never married (%)
Marital status - Now married (%)
Marital status - Separated (%)
Marital status - Widowed (%)
Marital status - Divorced (%)
Ancestries Reported - Arab (%)
Ancestries Reported - Czech (%)
Ancestries Reported - Danish (%)
Ancestries Reported - Dutch (%)
Ancestries Reported - English (%)
Ancestries Reported - French (%)
Ancestries Reported - French Canadian (%)
Ancestries Reported - German (%)
Ancestries Reported - Greek (%)
Ancestries Reported - Hungarian (%)
Ancestries Reported - Irish (%)
Ancestries Reported - Italian (%)
Ancestries Reported - Lithuanian (%)
Ancestries Reported - Norwegian (%)
Ancestries Reported - Polish (%)
Ancestries Reported - Portuguese (%)
Ancestries Reported - Russian (%)
Ancestries Reported - Scotch-Irish (%)
Ancestries Reported - Scottish (%)
Ancestries Reported - Slovak (%)
Ancestries Reported - Subsaharan African (%)
Ancestries Reported - Swedish (%)
Ancestries Reported - Swiss (%)
Ancestries Reported - Ukrainian (%)
Ancestries Reported - United States (%)
Ancestries Reported - Welsh (%)
Ancestries Reported - West Indian (%)
Ancestries Reported - Other (%)
Geographical mobility - Same house 1 year ago (%)
Geographical mobility - Same house 1 year ago (%) - White
Geographical mobility - Same house 1 year ago (%) - Black or African American
Geographical mobility - Same house 1 year ago (%) - Asian
Geographical mobility - Same house 1 year ago (%) - Hispanic or Latino
Geographical mobility - Same house 1 year ago (%) - American Indian and Alaska Native
Geographical mobility - Same house 1 year ago (%) - Multirace
Geographical mobility - Same house 1 year ago (%) - Other Race
Geographical mobility - Moved within same county (%)
Geographical mobility - Moved within same county (%) - White
Geographical mobility - Moved within same county (%) - Black or African American
Geographical mobility - Moved within same county (%) - Asian
Geographical mobility - Moved within same county (%) - Hispanic or Latino
Geographical mobility - Moved within same county (%) - American Indian and Alaska Native
Geographical mobility - Moved within same county (%) - Multirace
Geographical mobility - Moved within same county (%) - Other Race
Geographical mobility - Moved from different county within same state (%)
Geographical mobility - Moved from different county within same state (%) - White
Geographical mobility - Moved from different county within same state (%) - Black or African American
Geographical mobility - Moved from different county within same state (%) - Asian
Geographical mobility - Moved from different county within same state (%) - Hispanic or Latino
Geographical mobility - Moved from different county within same state (%) - American Indian and Alaska Native
Geographical mobility - Moved from different county within same state (%) - Multirace
Geographical mobility - Moved from different county within same state (%) - Other Race
Geographical mobility - Moved from different state (%)
Geographical mobility - Moved from different state (%) - White
Geographical mobility - Moved from different state (%) - Black or African American
Geographical mobility - Moved from different state (%) - Asian
Geographical mobility - Moved from different state (%) - Hispanic or Latino
Geographical mobility - Moved from different state (%) - American Indian and Alaska Native
Geographical mobility - Moved from different state (%) - Multirace
Geographical mobility - Moved from different state (%) - Other Race
Geographical mobility - Moved from abroad (%)
Geographical mobility - Moved from abroad (%) - White
Geographical mobility - Moved from abroad (%) - Black or African American
Geographical mobility - Moved from abroad (%) - Asian
Geographical mobility - Moved from abroad (%) - Hispanic or Latino
Geographical mobility - Moved from abroad (%) - American Indian and Alaska Native
Geographical mobility - Moved from abroad (%) - Multirace
Geographical mobility - Moved from abroad (%) - Other Race
Place of birth for the foreign-born population - Ireland (%)
Place of birth for the foreign-born population - Denmark (%)
Place of birth for the foreign-born population - Norway (%)
Place of birth for the foreign-born population - Sweden (%)
Place of birth for the foreign-born population - United Kingdom (%)
Place of birth for the foreign-born population - England (%)
Place of birth for the foreign-born population - Scotland (%)
Place of birth for the foreign-born population - Other Northern Europe (%)
Place of birth for the foreign-born population - Austria (%)
Place of birth for the foreign-born population - Belgium (%)
Place of birth for the foreign-born population - France (%)
Place of birth for the foreign-born population - Germany (%)
Place of birth for the foreign-born population - Netherlands (%)
Place of birth for the foreign-born population - Switzerland (%)
Place of birth for the foreign-born population - Other Western Europe (%)
Place of birth for the foreign-born population - Greece (%)
Place of birth for the foreign-born population - Italy (%)
Place of birth for the foreign-born population - Portugal (%)
Place of birth for the foreign-born population - Spain (%)
Place of birth for the foreign-born population - Other Southern Europe (%)
Place of birth for the foreign-born population - Albania (%)
Place of birth for the foreign-born population - Belarus (%)
Place of birth for the foreign-born population - Bosnia and Herzegovina (%)
Place of birth for the foreign-born population - Bulgaria (%)
Place of birth for the foreign-born population - Croatia (%)
Place of birth for the foreign-born population - Czechoslovakia (%)
Place of birth for the foreign-born population - Hungary (%)
Place of birth for the foreign-born population - Latvia (%)
Place of birth for the foreign-born population - Lithuania (%)
Place of birth for the foreign-born population - North Macedonia (Macedonia) (%)
Place of birth for the foreign-born population - Moldova (%)
Place of birth for the foreign-born population - Poland (%)
Place of birth for the foreign-born population - Romania (%)
Place of birth for the foreign-born population - Russia (%)
Place of birth for the foreign-born population - Serbia (%)
Place of birth for the foreign-born population - Ukraine (%)
Place of birth for the foreign-born population - Other Eastern Europe (%)
Place of birth for the foreign-born population - China (%)
Place of birth for the foreign-born population - Hong Kong (%)
Place of birth for the foreign-born population - Taiwan (%)
Place of birth for the foreign-born population - Japan (%)
Place of birth for the foreign-born population - Korea (%)
Place of birth for the foreign-born population - Other Eastern Asia (%)
Place of birth for the foreign-born population - Afghanistan (%)
Place of birth for the foreign-born population - Bangladesh (%)
Place of birth for the foreign-born population - India (%)
Place of birth for the foreign-born population - Iran (%)
Place of birth for the foreign-born population - Kazakhstan (%)
Place of birth for the foreign-born population - Nepal (%)
Place of birth for the foreign-born population - Pakistan (%)
Place of birth for the foreign-born population - Sri Lanka (%)
Place of birth for the foreign-born population - Uzbekistan (%)
Place of birth for the foreign-born population - Other South Central Asia (%)
Place of birth for the foreign-born population - Burma (%)
Place of birth for the foreign-born population - Cambodia (%)
Place of birth for the foreign-born population - Indonesia (%)
Place of birth for the foreign-born population - Laos (%)
Place of birth for the foreign-born population - Malaysia (%)
Place of birth for the foreign-born population - Philippines (%)
Place of birth for the foreign-born population - Singapore (%)
Place of birth for the foreign-born population - Thailand (%)
Place of birth for the foreign-born population - Vietnam (%)
Place of birth for the foreign-born population - Other South Eastern Asia (%)
Place of birth for the foreign-born population - Armenia (%)
Place of birth for the foreign-born population - Iraq (%)
Place of birth for the foreign-born population - Israel (%)
Place of birth for the foreign-born population - Jordan (%)
Place of birth for the foreign-born population - Kuwait (%)
Place of birth for the foreign-born population - Lebanon (%)
Place of birth for the foreign-born population - Saudi Arabia (%)
Place of birth for the foreign-born population - Syria (%)
Place of birth for the foreign-born population - Turkey (%)
Place of birth for the foreign-born population - Yemen (%)
Place of birth for the foreign-born population - Other Western Asia (%)
Place of birth for the foreign-born population - Eritrea (%)
Place of birth for the foreign-born population - Ethiopia (%)
Place of birth for the foreign-born population - Kenya (%)
Place of birth for the foreign-born population - Somalia (%)
Place of birth for the foreign-born population - Uganda (%)
Place of birth for the foreign-born population - Zimbabwe (%)
Place of birth for the foreign-born population - Other Eastern Africa (%)
Place of birth for the foreign-born population - Cameroon (%)
Place of birth for the foreign-born population - Congo (%)
Place of birth for the foreign-born population - Democratic Republic of Congo (Zaire) (%)
Place of birth for the foreign-born population - Other Middle Africa (%)
Place of birth for the foreign-born population - Egypt (%)
Place of birth for the foreign-born population - Morocco (%)
Place of birth for the foreign-born population - Sudan (%)
Place of birth for the foreign-born population - Other Northern Africa (%)
Place of birth for the foreign-born population - South Africa (%)
Place of birth for the foreign-born population - Other Southern Africa (%)
Place of birth for the foreign-born population - Cabo Verde (%)
Place of birth for the foreign-born population - Ghana (%)
Place of birth for the foreign-born population - Liberia (%)
Place of birth for the foreign-born population - Nigeria (%)
Place of birth for the foreign-born population - Senegal (%)
Place of birth for the foreign-born population - Sierra Leone (%)
Place of birth for the foreign-born population - Other Western Africa (%)
Place of birth for the foreign-born population - Australia (%)
Place of birth for the foreign-born population - New Zealand (%)
Place of birth for the foreign-born population - Fiji (%)
Place of birth for the foreign-born population - Micronesia (%)
Place of birth for the foreign-born population - Bahamas (%)
Place of birth for the foreign-born population - Barbados (%)
Place of birth for the foreign-born population - Cuba (%)
Place of birth for the foreign-born population - Dominica (%)
Place of birth for the foreign-born population - Dominican Republic (%)
Place of birth for the foreign-born population - Grenada (%)
Place of birth for the foreign-born population - Haiti (%)
Place of birth for the foreign-born population - Jamaica (%)
Place of birth for the foreign-born population - St. Vincent and the Grenadines (%)
Place of birth for the foreign-born population - Trinidad and Tobago (%)
Place of birth for the foreign-born population - West Indies (%)
Place of birth for the foreign-born population - Other Caribbean (%)
Place of birth for the foreign-born population - Belize (%)
Place of birth for the foreign-born population - Costa Rica (%)
Place of birth for the foreign-born population - El Salvador (%)
Place of birth for the foreign-born population - Guatemala (%)
Place of birth for the foreign-born population - Honduras (%)
Place of birth for the foreign-born population - Mexico (%)
Place of birth for the foreign-born population - Nicaragua (%)
Place of birth for the foreign-born population - Panama (%)
Place of birth for the foreign-born population - Other Central America (%)
Place of birth for the foreign-born population - Argentina (%)
Place of birth for the foreign-born population - Bolivia (%)
Place of birth for the foreign-born population - Brazil (%)
Place of birth for the foreign-born population - Chile (%)
Place of birth for the foreign-born population - Colombia (%)
Place of birth for the foreign-born population - Ecuador (%)
Place of birth for the foreign-born population - Guyana (%)
Place of birth for the foreign-born population - Peru (%)
Place of birth for the foreign-born population - Uruguay (%)
Place of birth for the foreign-born population - Venezuela (%)
Place of birth for the foreign-born population - Other South America (%)
Place of birth for the foreign-born population - Canada (%)
Place of birth for the foreign-born population - Other Northern America (%)
Place of birth for the foreign-born population - Other (%)
Latest news about races in Newington, CT collected exclusively by city-data.com from local newspapers, TV, and radio stations
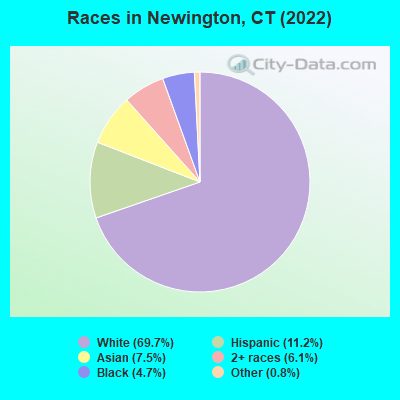
According to 2022 data, the most numerous races in Newington, CT are White alone (21,309 residents), Hispanic (3,420 residents), and Black alone (1,444 residents). 70.4% of Newington residents speak English at home. 22.0% of Newington, CT residents are foreign-born (10.2% born in Europe, 5.2% born in Asia, 4.9% born in Latin America), which is 31.7% greater than the foreign-born rate of 15.0% across the entire state of Connecticut.
Race distribution in Newington
2000 2022
2,638,845 77.5% White alone 320,323 9.4% Hispanic 295,571 8.7% Black alone 81,564 2.4% Asian alone 52,896 1.6% Two or more races 8,141 0.2% Other race alone 7,267 0.2% American Indian alone 958 0.03% Native Hawaiian and Other
2,246,913 62.0% White alone 658,978 18.2% Hispanic 353,973 9.8% Black alone 172,929 4.8% Asian alone 159,631 4.4% Two or more races 29,761 0.8% Other race alone 3,428 0.09% American Indian alone 592 0.02% Native Hawaiian and Other
Income and house value in Newington Median household income in 2022 $96,169 White non-Hispanic householders$130,162 Black householders$108,288 Asian householders$60,397 Some other race householders$101,197 Two or more races householders$94,201 Hispanic or Latino race householdersMedian 2022 house value $292,179 White Non-Hispanic householders$309,521 Black or African American householders $367,594 Asian householders$237,736 Some other race householders$261,126 Two or more races householders$243,583 Hispanic or Latino householders
Median age by race in Newington
50.3 Median age for White residents48.4 51.7 38.6 Median age for Black or African American residents41.3 38.3 27.9 Median age for American Indian / Alaska Native residents15.6 -704,477,611.2 33.6 Median age for Asian residents30.3 43.4 -641,269,840.6 Median age for Native Hawaiian / Pacific Islander residents-414,239,481.8 -691,588,784.4 36.5 Median age for Other race residents25.9 38.4 32.0 Median age for Two or more races residents28.6 33.9 50.3 Median age for White alone residents49.0 51.8 32.7 Median age for Hispanic or Latino residents28.5 38.5
Owner/renter occupied households by race in Newington
House owners and renters - White residents 8,073 80.5% Owner occupied1,957 19.5% Renter occupiedHouse owners and renters - Black or African American residents 333 74.3% Owner occupied115 25.7% Renter occupiedHouse owners and renters - Asian residents 562 65.4% Owner occupied297 34.6% Renter occupiedHouse owners and renters - Other race residents 306 73.9% Owner occupied108 26.1% Renter occupiedHouse owners and renters - Two or more races residents 511 61.0% Owner occupied327 39.0% Renter occupiedHouse owners and renters - White alone residents 7,868 80.1% Owner occupied1,960 19.9% Renter occupiedHouse owners and renters - Hispanic or Latino residents 776 73.7% Owner occupied276 26.3% Renter occupied
Language usage in Newington
English speakers - Total 70.4% of residents of Newington speak English at home.
7.7% of residents speak Spanish at home 1,739 77.3% Speak English very well512 22.7% Speak English less than very well21.8% of residents speak other language at home 3,977 62.3% Speak English very well2,407 37.7% Speak English less than very well
English speakers - Born in the United States 81.8% of residents of Newington speak English at home.
7.5% of residents speak Spanish at home 329 91.9% Speak English very well29 8.1% Speak English less than very well10.8% of residents speak other language at home 482 92.5% Speak English very well39 7.5% Speak English less than very well
English speakers - Native, born elsewhere 19.3% of residents of Newington speak English at home.
58.3% of residents speak Spanish at home 341 85.5% Speak English very well58 14.5% Speak English less than very well24.6% of residents speak other language at home 89 53.0% Speak English very well79 47.0% Speak English less than very well
English speakers - Foreign-born 22.1% of residents of Newington speak English at home.
12.6% of residents speak Spanish at home 466 55.3% Speak English very well377 44.7% Speak English less than very well63.9% of residents speak other language at home 2,113 49.5% Speak English very well2,159 50.5% Speak English less than very well
White (Caucasian) - Speak only English Native:
91.0% (16,480)Foreign-born:
10.7% (305)
White (Caucasian) - Speak another language Native:
8.1% (1,471)Foreign-born:
85.7% (2,442)
Black or African American - Speak only English Native:
99.1% (533)Foreign-born:
86.5% (773)
Asian - Speak only English Native:
27.2% (216)Foreign-born:
19.4% (261)
Asian - Speak another language Native:
71.4% (565)Foreign-born:
80.3% (1,078)
Other race - Speak only English Native:
25.8% (184)Foreign-born:
25.0% (92)
Other race - Speak another language Native:
73.0% (522)Foreign-born:
71.5% (265)
Two or more races - Speak only English Native:
75.0% (1,844)Foreign-born:
15.1% (95)
Two or more races - Speak another language Native:
22.8% (561)Foreign-born:
81.4% (511)
White alone - Speak only English Native:
92.3% (16,262)Foreign-born:
9.3% (274)
White alone - Speak another language Native:
7.8% (1,369)Foreign-born:
89.9% (2,637)
Hispanic or Latino - Speak only English Native:
40.5% (908)Foreign-born:
6.4% (56)
Hispanic or Latino - Speak another language Native:
59.4% (1,329)Foreign-born:
93.5% (826)
Foreign-born residents in Newington 6,719 residents are foreign born (10.2% Europe , 5.2% Asia , 4.9% Latin America ).
This city:
22.0%Connecticut:
15.0%
Marital status for residents in Newington Marital status - White (Caucasian) population 15 years and over
Males 33.9% Never married53.5% Now married0.1% Separated2.9% Widowed9.7% DivorcedFemales 26.0% Never married46.9% Now married0.5% Separated11.8% Widowed14.8% DivorcedWomen who gave birth in the past 12 months Now married:
65.8% (132)Unmarried:
34.2% (69)
Women who did not give birth in the past 12 months Now married:
42.8% (1,814)Unmarried:
57.2% (2,422)
Marital status - Black or African American population 15 years and over
Males 53.3% Never married39.7% Now married0.0% Separated0.0% Widowed7.0% DivorcedFemales 40.0% Never married39.3% Now married0.0% Separated2.8% Widowed18.0% DivorcedWomen who gave birth in the past 12 months Now married:
100.0% (21)Unmarried:
0.0% (0)
Women who did not give birth in the past 12 months Now married:
17.9% (59)Unmarried:
82.1% (270)
Marital status - American Indian / Alaska Native population 15 years and over
Males 100.0% Never married0.0% Now married0.0% Separated0.0% Widowed0.0% DivorcedFemales 0.0% Never married100.0% Now married0.0% Separated0.0% Widowed0.0% DivorcedMarital status - Asian population 15 years and over
Males 50.7% Never married47.3% Now married0.0% Separated0.7% Widowed1.3% DivorcedFemales 16.5% Never married73.3% Now married0.0% Separated4.1% Widowed6.2% DivorcedWomen who gave birth in the past 12 months Now married:
100.0% (29)Unmarried:
0.0% (0)
Women who did not give birth in the past 12 months Now married:
73.8% (304)Unmarried:
26.2% (108)
Marital status - Other race population 15 years and over
Males 20.3% Never married49.8% Now married0.0% Separated7.8% Widowed22.1% DivorcedFemales 38.4% Never married29.1% Now married10.9% Separated10.0% Widowed11.6% DivorcedWomen who did not give birth in the past 12 months Now married:
47.7% (188)Unmarried:
52.3% (206)
Marital status - Two or more races population 15 years and over
Males 60.8% Never married29.1% Now married0.0% Separated0.0% Widowed10.1% DivorcedFemales 53.4% Never married32.0% Now married0.0% Separated4.4% Widowed10.1% DivorcedWomen who gave birth in the past 12 months Now married:
100.0% (66)Unmarried:
0.0% (0)
Women who did not give birth in the past 12 months Now married:
21.7% (183)Unmarried:
78.3% (662)
Marital status - White alone, not Hispanic / Latino population 15 years and over
Males 32.8% Never married54.0% Now married0.1% Separated3.1% Widowed10.0% DivorcedFemales 27.1% Never married46.8% Now married0.1% Separated11.8% Widowed14.2% DivorcedWomen who gave birth in the past 12 months Now married:
63.4% (126)Unmarried:
36.6% (73)
Women who did not give birth in the past 12 months Now married:
41.5% (1,730)Unmarried:
58.5% (2,442)
Marital status - Hispanic or Latino population 15 years and over
Males 46.9% Never married37.9% Now married0.0% Separated1.5% Widowed13.7% DivorcedFemales 24.8% Never married39.3% Now married7.3% Separated9.2% Widowed19.4% DivorcedWomen who gave birth in the past 12 months Now married:
100.0% (15)Unmarried:
0.0% (0)
Women who did not give birth in the past 12 months Now married:
50.7% (434)Unmarried:
49.3% (422)
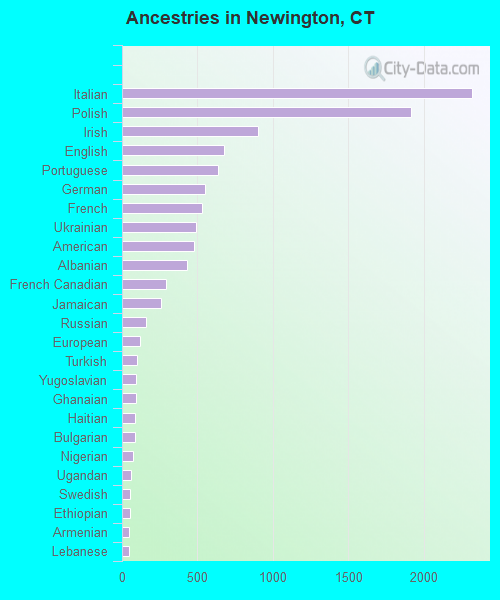
Ancestries in Newington
2,316 14.2% Italian1,915 11.7% Polish898 5.5% Irish678 4.2% English633 3.9% Portuguese550 3.4% German527 3.2% French491 3.0% Ukrainian480 2.9% American433 2.7% Albanian291 1.8% French Canadian256 1.6% Jamaican157 1.0% Russian122 0.7% European101 0.6% Turkish95 0.6% Yugoslavian92 0.6% Ghanaian89 0.5% Haitian86 0.5% Bulgarian74 0.5% Nigerian57 0.3% Ugandan54 0.3% Swedish52 0.3% Ethiopian47 0.3% Armenian45 0.3% Lebanese41 0.3% British36 0.2% Greek29 0.2% Eastern European29 0.2% Scottish28 0.2% Scotch-Irish27 0.2% Syrian22 0.1% Austrian18 0.1% Arab18 0.1% Canadian18 0.1% Lithuanian17 0.1% Romanian16 0.10% Croatian14 0.09% British West Indian14 0.09% Slovak13 0.08% Palestinian13 0.08% Dutch12 0.07% Danish11 0.07% Norwegian11 0.07% Czech10 0.06% Welsh6 0.04% Latvian6 0.04% Scandinavian4 0.02% Hungarian
Geographical mobility in Newington Same house 1 year ago 20,424 93.6% White (Caucasian)1,274 89.4% Black or African American16 94.8% American Indian / Alaska Native1,943 85.8% Asian804 69.3% Other race2,842 88.2% Two or more races19,679 93.0% White alone, not Hispanic / Latino3,084 90.9% Hispanic or LatinoMoved within same county 791 3.6% White / Caucasian82 5.7% Black or African American145 6.4% Asian172 14.8% Other race127 3.9% Two or more races866 4.1% White alone, not Hispanic / Latino158 4.6% Hispanic or LatinoMoved within same state 184 0.8% White / Caucasian34 2.4% Black or African American13 1.1% Other race218 6.8% Two or more races192 0.9% White alone, not Hispanic / Latino18 0.5% Hispanic or LatinoMoved from different state 205 0.9% White / Caucasian74 3.3% Asian150 12.9% Other race15 0.5% Two or more races182 0.9% White alone, not Hispanic / Latino166 4.9% Hispanic or LatinoMoved from abroad 80 0.4% White80 3.5% Asian29 0.9% Two or more races86 0.4% White alone, not Hispanic / Latino19 0.6% Hispanic or Latino
Children Nativity (place of birth) in Newington
Children under 6 years - Living with two parents Both parents native 653 100.0% NativeBoth parents foreign-born 336 88.4% Native44 11.6% Foreign-bornOne native, one foreign-born parent 84 100.0% NativeChildren under 6 years - Living with one parent Native parent 275 100.0% NativeForeign-born parent 102 71.0% Native42 29.0% Foreign-bornChildren 6 to 17 years - Living with two parents Both parents native 1,197 100.0% NativeBoth parents foreign-born 620 80.4% Native151 19.6% Foreign-bornOne native, one foreign-born parent 438 100.0% NativeChildren 6 to 17 years - Living with one parent Native parent 734 100.0% NativeForeign-born parent 272 60.6% Native177 39.4% Foreign-born
Grandparents responsible for own grandchildren in Newington
Grandparents (30 to 59 years) White / Caucasian 5 8.3% Responsible for grandchildren55 91.7% Not responsible for grandchildrenBlack or African American 16 100.0% Responsible for grandchildrenTwo or more races 48 100.0% Not responsible for grandchildrenWhite alone, not Hispanic / Latino 6 7.1% Responsible for grandchildren74 92.9% Not responsible for grandchildrenGrandparents (60 years and over) White / Caucasian 78 46.8% Responsible for grandchildren89 53.2% Not responsible for grandchildrenTwo or more races 19 20.6% Responsible for grandchildren74 79.4% Not responsible for grandchildrenWhite alone, not Hispanic / Latino 83 47.5% Responsible for grandchildren91 52.5% Not responsible for grandchildren