Races in Newton, Kansas (KS) Detailed Stats
Data:
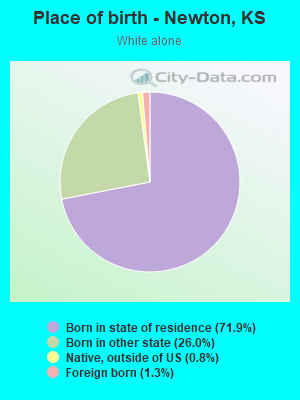
Races - White alone (%)
Races - White alone (% change since 2000)
Races - Black alone (%)
Races - Black alone (% change since 2000)
Races - American Indian alone (%)
Races - American Indian alone (% change since 2000)
Races - Asian alone (%)
Races - Asian alone (% change since 2000)
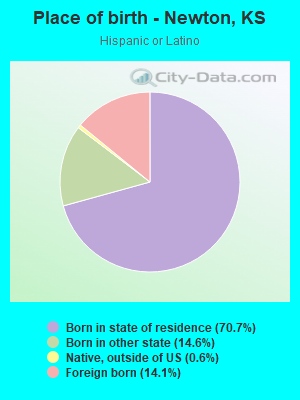
Races - Hispanic (%)
Races - Hispanic (% change since 2000)
Races - Native Hawaiian and Other Pacific Islander alone (%)
Races - Native Hawaiian and Other Pacific Islander alone (% change since 2000)
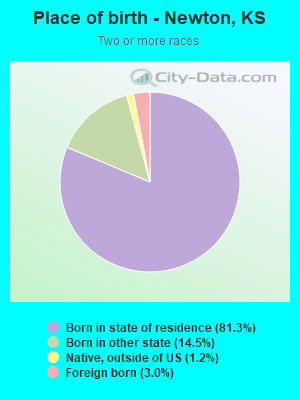
Races - Two or more races(%)
Races - Two or more races(% change since 2000)
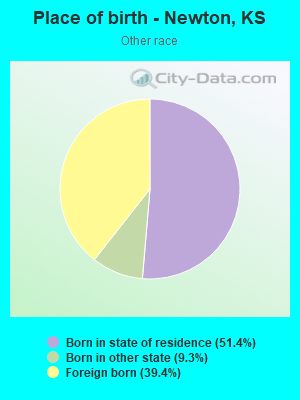
Races - Other race alone (%)
Races - Other race alone (% change since 2000)
Racial diversity
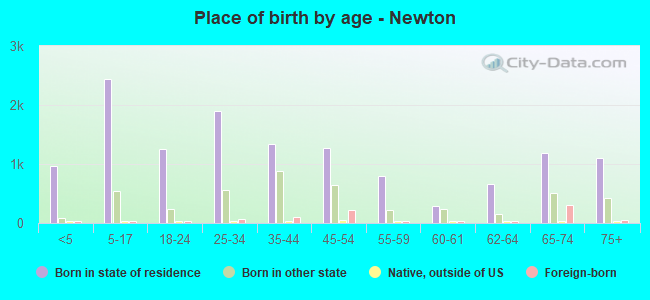
Place of birth - Born in state of residence (%)
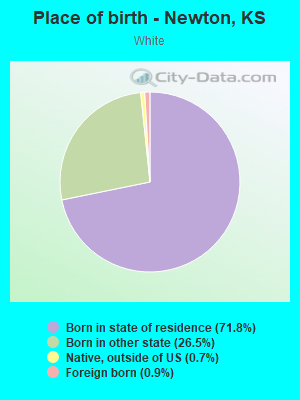
Place of birth - Born in state of residence (%) - White
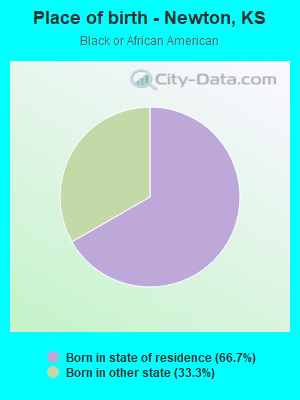
Place of birth - Born in state of residence (%) - Black or African American
Place of birth - Born in state of residence (%) - Asian
Place of birth - Born in state of residence (%) - Hispanic or Latino
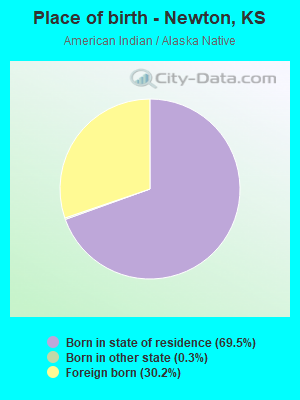
Place of birth - Born in state of residence (%) - American Indian and Alaska Native
Place of birth - Born in state of residence (%) - Multirace
Place of birth - Born in state of residence (%) - Other Race
Place of birth - Born in other state (%)
Place of birth - Born in other state (%) - White
Place of birth - Born in other state (%) - Black or African American
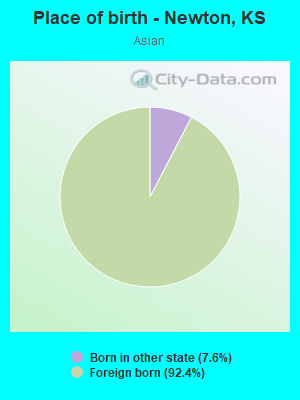
Place of birth - Born in other state (%) - Asian
Place of birth - Born in other state (%) - Hispanic or Latino
Place of birth - Born in other state (%) - American Indian and Alaska Native
Place of birth - Born in other state (%) - Multirace
Place of birth - Born in other state (%) - Other Race
Place of birth - Native, outside of US (%)
Place of birth - Native, outside of US (%) - White
Place of birth - Native, outside of US (%) - Black or African American
Place of birth - Native, outside of US (%) - Asian
Place of birth - Native, outside of US (%) - Hispanic or Latino
Place of birth - Native, outside of US (%) - American Indian and Alaska Native
Place of birth - Native, outside of US (%) - Multirace
Place of birth - Native, outside of US (%) - Other Race
Place of birth - Foreign born (%)
Place of birth - Foreign born (%) - White
Place of birth - Foreign born (%) - Black or African American
Place of birth - Foreign born (%) - Asian
Place of birth - Foreign born (%) - Hispanic or Latino
Place of birth - Foreign born (%) - American Indian and Alaska Native
Place of birth - Foreign born (%) - Multirace
Place of birth - Foreign born (%) - Other Race
Residents speaking English at home (%)
Residents speaking English at home - Born in the United States (%)
Residents speaking English at home - Native, born elsewhere (%)
Residents speaking English at home - Foreign born (%)
Residents speaking Spanish at home (%)
Residents speaking Spanish at home - Born in the United States (%)
Residents speaking Spanish at home - Native, born elsewhere (%)
Residents speaking Spanish at home - Foreign born (%)
Residents speaking other language at home (%)
Residents speaking other language at home - Born in the United States (%)
Residents speaking other language at home - Native, born elsewhere (%)
Residents speaking other language at home - Foreign born (%)
Marital status - Never married (%)
Marital status - Now married (%)
Marital status - Separated (%)
Marital status - Widowed (%)
Marital status - Divorced (%)
Ancestries Reported - Arab (%)
Ancestries Reported - Czech (%)
Ancestries Reported - Danish (%)
Ancestries Reported - Dutch (%)
Ancestries Reported - English (%)
Ancestries Reported - French (%)
Ancestries Reported - French Canadian (%)
Ancestries Reported - German (%)
Ancestries Reported - Greek (%)
Ancestries Reported - Hungarian (%)
Ancestries Reported - Irish (%)
Ancestries Reported - Italian (%)
Ancestries Reported - Lithuanian (%)
Ancestries Reported - Norwegian (%)
Ancestries Reported - Polish (%)
Ancestries Reported - Portuguese (%)
Ancestries Reported - Russian (%)
Ancestries Reported - Scotch-Irish (%)
Ancestries Reported - Scottish (%)
Ancestries Reported - Slovak (%)
Ancestries Reported - Subsaharan African (%)
Ancestries Reported - Swedish (%)
Ancestries Reported - Swiss (%)
Ancestries Reported - Ukrainian (%)
Ancestries Reported - United States (%)
Ancestries Reported - Welsh (%)
Ancestries Reported - West Indian (%)
Ancestries Reported - Other (%)
Geographical mobility - Same house 1 year ago (%)
Geographical mobility - Same house 1 year ago (%) - White
Geographical mobility - Same house 1 year ago (%) - Black or African American
Geographical mobility - Same house 1 year ago (%) - Asian
Geographical mobility - Same house 1 year ago (%) - Hispanic or Latino
Geographical mobility - Same house 1 year ago (%) - American Indian and Alaska Native
Geographical mobility - Same house 1 year ago (%) - Multirace
Geographical mobility - Same house 1 year ago (%) - Other Race
Geographical mobility - Moved within same county (%)
Geographical mobility - Moved within same county (%) - White
Geographical mobility - Moved within same county (%) - Black or African American
Geographical mobility - Moved within same county (%) - Asian
Geographical mobility - Moved within same county (%) - Hispanic or Latino
Geographical mobility - Moved within same county (%) - American Indian and Alaska Native
Geographical mobility - Moved within same county (%) - Multirace
Geographical mobility - Moved within same county (%) - Other Race
Geographical mobility - Moved from different county within same state (%)
Geographical mobility - Moved from different county within same state (%) - White
Geographical mobility - Moved from different county within same state (%) - Black or African American
Geographical mobility - Moved from different county within same state (%) - Asian
Geographical mobility - Moved from different county within same state (%) - Hispanic or Latino
Geographical mobility - Moved from different county within same state (%) - American Indian and Alaska Native
Geographical mobility - Moved from different county within same state (%) - Multirace
Geographical mobility - Moved from different county within same state (%) - Other Race
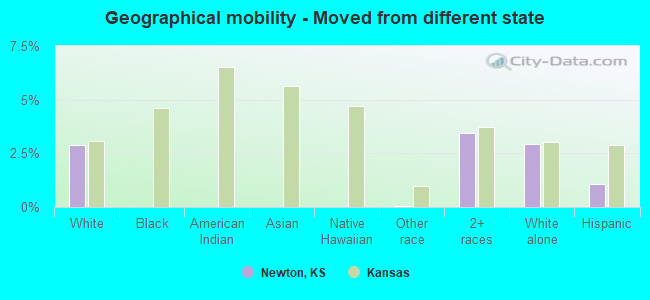
Geographical mobility - Moved from different state (%)
Geographical mobility - Moved from different state (%) - White
Geographical mobility - Moved from different state (%) - Black or African American
Geographical mobility - Moved from different state (%) - Asian
Geographical mobility - Moved from different state (%) - Hispanic or Latino
Geographical mobility - Moved from different state (%) - American Indian and Alaska Native
Geographical mobility - Moved from different state (%) - Multirace
Geographical mobility - Moved from different state (%) - Other Race
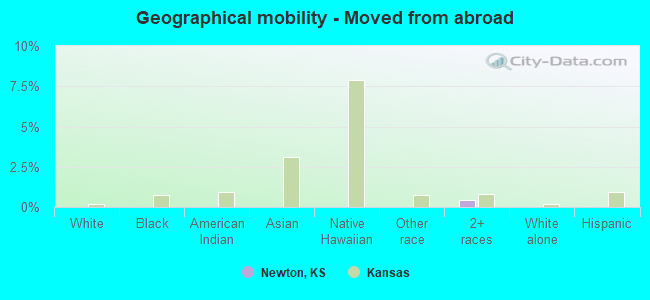
Geographical mobility - Moved from abroad (%)
Geographical mobility - Moved from abroad (%) - White
Geographical mobility - Moved from abroad (%) - Black or African American
Geographical mobility - Moved from abroad (%) - Asian
Geographical mobility - Moved from abroad (%) - Hispanic or Latino
Geographical mobility - Moved from abroad (%) - American Indian and Alaska Native
Geographical mobility - Moved from abroad (%) - Multirace
Geographical mobility - Moved from abroad (%) - Other Race
Place of birth for the foreign-born population - Ireland (%)
Place of birth for the foreign-born population - Denmark (%)
Place of birth for the foreign-born population - Norway (%)
Place of birth for the foreign-born population - Sweden (%)
Place of birth for the foreign-born population - United Kingdom (%)
Place of birth for the foreign-born population - England (%)
Place of birth for the foreign-born population - Scotland (%)
Place of birth for the foreign-born population - Other Northern Europe (%)
Place of birth for the foreign-born population - Austria (%)
Place of birth for the foreign-born population - Belgium (%)
Place of birth for the foreign-born population - France (%)
Place of birth for the foreign-born population - Germany (%)
Place of birth for the foreign-born population - Netherlands (%)
Place of birth for the foreign-born population - Switzerland (%)
Place of birth for the foreign-born population - Other Western Europe (%)
Place of birth for the foreign-born population - Greece (%)
Place of birth for the foreign-born population - Italy (%)
Place of birth for the foreign-born population - Portugal (%)
Place of birth for the foreign-born population - Spain (%)
Place of birth for the foreign-born population - Other Southern Europe (%)
Place of birth for the foreign-born population - Albania (%)
Place of birth for the foreign-born population - Belarus (%)
Place of birth for the foreign-born population - Bosnia and Herzegovina (%)
Place of birth for the foreign-born population - Bulgaria (%)
Place of birth for the foreign-born population - Croatia (%)
Place of birth for the foreign-born population - Czechoslovakia (%)
Place of birth for the foreign-born population - Hungary (%)
Place of birth for the foreign-born population - Latvia (%)
Place of birth for the foreign-born population - Lithuania (%)
Place of birth for the foreign-born population - North Macedonia (Macedonia) (%)
Place of birth for the foreign-born population - Moldova (%)
Place of birth for the foreign-born population - Poland (%)
Place of birth for the foreign-born population - Romania (%)
Place of birth for the foreign-born population - Russia (%)
Place of birth for the foreign-born population - Serbia (%)
Place of birth for the foreign-born population - Ukraine (%)
Place of birth for the foreign-born population - Other Eastern Europe (%)
Place of birth for the foreign-born population - China (%)
Place of birth for the foreign-born population - Hong Kong (%)
Place of birth for the foreign-born population - Taiwan (%)
Place of birth for the foreign-born population - Japan (%)
Place of birth for the foreign-born population - Korea (%)
Place of birth for the foreign-born population - Other Eastern Asia (%)
Place of birth for the foreign-born population - Afghanistan (%)
Place of birth for the foreign-born population - Bangladesh (%)
Place of birth for the foreign-born population - India (%)
Place of birth for the foreign-born population - Iran (%)
Place of birth for the foreign-born population - Kazakhstan (%)
Place of birth for the foreign-born population - Nepal (%)
Place of birth for the foreign-born population - Pakistan (%)
Place of birth for the foreign-born population - Sri Lanka (%)
Place of birth for the foreign-born population - Uzbekistan (%)
Place of birth for the foreign-born population - Other South Central Asia (%)
Place of birth for the foreign-born population - Burma (%)
Place of birth for the foreign-born population - Cambodia (%)
Place of birth for the foreign-born population - Indonesia (%)
Place of birth for the foreign-born population - Laos (%)
Place of birth for the foreign-born population - Malaysia (%)
Place of birth for the foreign-born population - Philippines (%)
Place of birth for the foreign-born population - Singapore (%)
Place of birth for the foreign-born population - Thailand (%)
Place of birth for the foreign-born population - Vietnam (%)
Place of birth for the foreign-born population - Other South Eastern Asia (%)
Place of birth for the foreign-born population - Armenia (%)
Place of birth for the foreign-born population - Iraq (%)
Place of birth for the foreign-born population - Israel (%)
Place of birth for the foreign-born population - Jordan (%)
Place of birth for the foreign-born population - Kuwait (%)
Place of birth for the foreign-born population - Lebanon (%)
Place of birth for the foreign-born population - Saudi Arabia (%)
Place of birth for the foreign-born population - Syria (%)
Place of birth for the foreign-born population - Turkey (%)
Place of birth for the foreign-born population - Yemen (%)
Place of birth for the foreign-born population - Other Western Asia (%)
Place of birth for the foreign-born population - Eritrea (%)
Place of birth for the foreign-born population - Ethiopia (%)
Place of birth for the foreign-born population - Kenya (%)
Place of birth for the foreign-born population - Somalia (%)
Place of birth for the foreign-born population - Uganda (%)
Place of birth for the foreign-born population - Zimbabwe (%)
Place of birth for the foreign-born population - Other Eastern Africa (%)
Place of birth for the foreign-born population - Cameroon (%)
Place of birth for the foreign-born population - Congo (%)
Place of birth for the foreign-born population - Democratic Republic of Congo (Zaire) (%)
Place of birth for the foreign-born population - Other Middle Africa (%)
Place of birth for the foreign-born population - Egypt (%)
Place of birth for the foreign-born population - Morocco (%)
Place of birth for the foreign-born population - Sudan (%)
Place of birth for the foreign-born population - Other Northern Africa (%)
Place of birth for the foreign-born population - South Africa (%)
Place of birth for the foreign-born population - Other Southern Africa (%)
Place of birth for the foreign-born population - Cabo Verde (%)
Place of birth for the foreign-born population - Ghana (%)
Place of birth for the foreign-born population - Liberia (%)
Place of birth for the foreign-born population - Nigeria (%)
Place of birth for the foreign-born population - Senegal (%)
Place of birth for the foreign-born population - Sierra Leone (%)
Place of birth for the foreign-born population - Other Western Africa (%)
Place of birth for the foreign-born population - Australia (%)
Place of birth for the foreign-born population - New Zealand (%)
Place of birth for the foreign-born population - Fiji (%)
Place of birth for the foreign-born population - Micronesia (%)
Place of birth for the foreign-born population - Bahamas (%)
Place of birth for the foreign-born population - Barbados (%)
Place of birth for the foreign-born population - Cuba (%)
Place of birth for the foreign-born population - Dominica (%)
Place of birth for the foreign-born population - Dominican Republic (%)
Place of birth for the foreign-born population - Grenada (%)
Place of birth for the foreign-born population - Haiti (%)
Place of birth for the foreign-born population - Jamaica (%)
Place of birth for the foreign-born population - St. Vincent and the Grenadines (%)
Place of birth for the foreign-born population - Trinidad and Tobago (%)
Place of birth for the foreign-born population - West Indies (%)
Place of birth for the foreign-born population - Other Caribbean (%)
Place of birth for the foreign-born population - Belize (%)
Place of birth for the foreign-born population - Costa Rica (%)
Place of birth for the foreign-born population - El Salvador (%)
Place of birth for the foreign-born population - Guatemala (%)
Place of birth for the foreign-born population - Honduras (%)
Place of birth for the foreign-born population - Mexico (%)
Place of birth for the foreign-born population - Nicaragua (%)
Place of birth for the foreign-born population - Panama (%)
Place of birth for the foreign-born population - Other Central America (%)
Place of birth for the foreign-born population - Argentina (%)
Place of birth for the foreign-born population - Bolivia (%)
Place of birth for the foreign-born population - Brazil (%)
Place of birth for the foreign-born population - Chile (%)
Place of birth for the foreign-born population - Colombia (%)
Place of birth for the foreign-born population - Ecuador (%)
Place of birth for the foreign-born population - Guyana (%)
Place of birth for the foreign-born population - Peru (%)
Place of birth for the foreign-born population - Uruguay (%)
Place of birth for the foreign-born population - Venezuela (%)
Place of birth for the foreign-born population - Other South America (%)
Place of birth for the foreign-born population - Canada (%)
Place of birth for the foreign-born population - Other Northern America (%)
Place of birth for the foreign-born population - Other (%)
Latest news about races in Newton, KS collected exclusively by city-data.com from local newspapers, TV, and radio stations
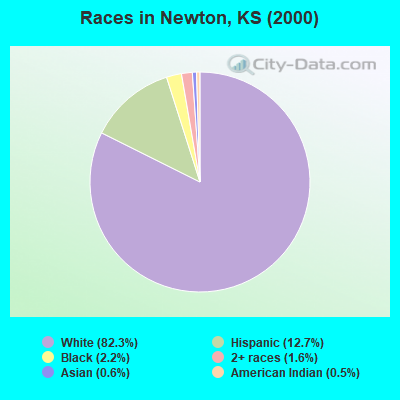
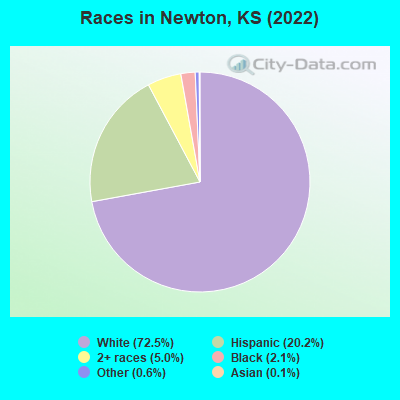
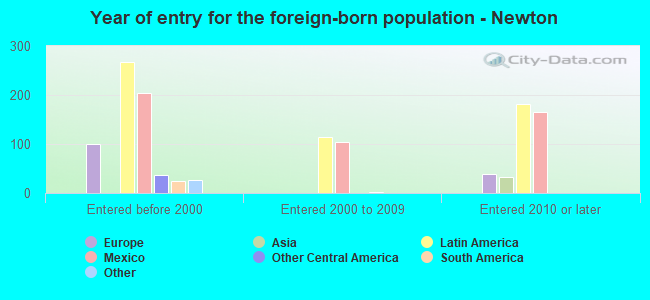
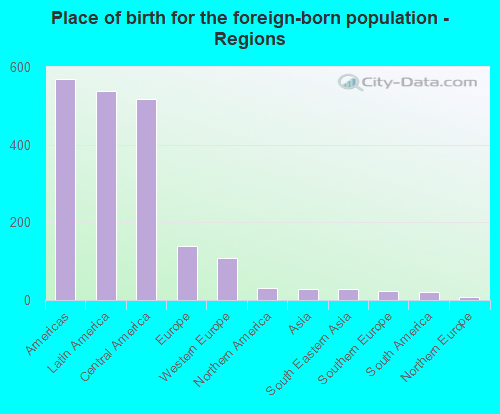
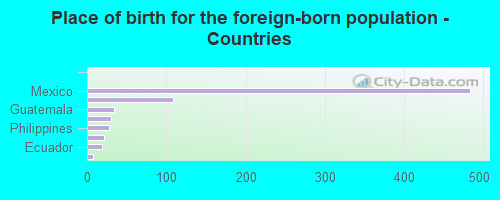
According to 2022 data, the most numerous races in Newton, KS are White alone (13,431 residents), Hispanic (3,736 residents), and Black alone (386 residents). 92.4% of Newton residents speak English at home. 4.0% of Newton, KS residents are foreign-born (2.8% born in Latin America, 0.7% born in Europe), which is 76.3% less than the foreign-born rate of 7.0% across the entire state of Kansas.
Race distribution in Newton
2000 2022
2,233,997 83.1% White alone 188,252 7.0% Hispanic 151,407 5.6% Black alone 46,301 1.7% Asian alone 42,508 1.6% Two or more races 22,322 0.8% American Indian alone 2,477 0.09% Other race alone 1,154 0.04% Native Hawaiian and Other
2,147,943 73.1% White alone 381,746 13.0% Hispanic 147,666 5.0% Black alone 145,362 4.9% Two or more races 85,085 2.9% Asian alone 13,263 0.5% Other race alone 12,065 0.4% American Indian alone 4,020 0.1% Native Hawaiian and Other
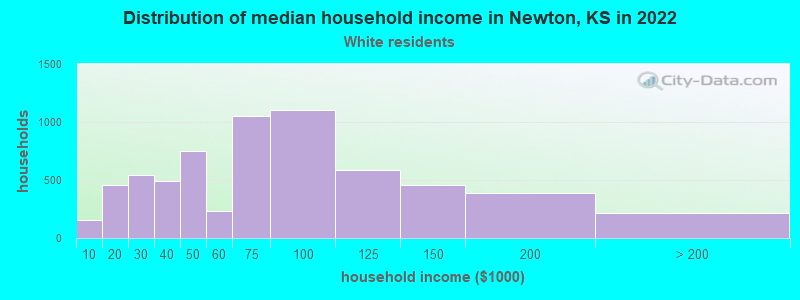
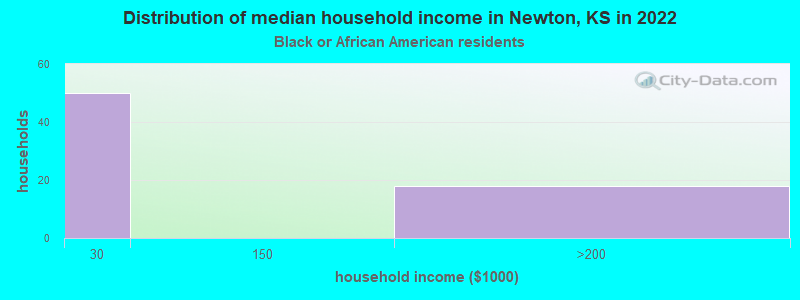
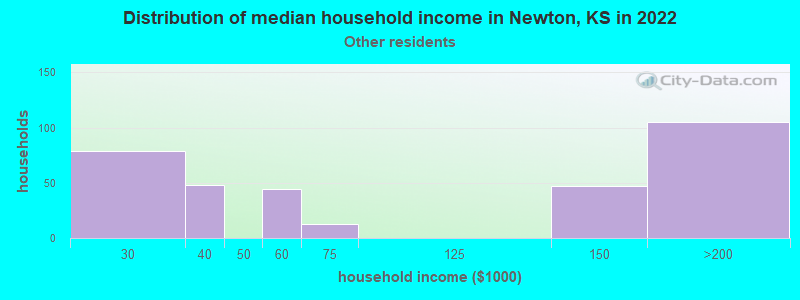
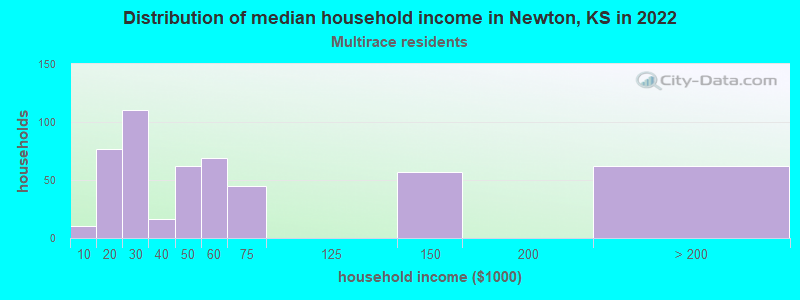
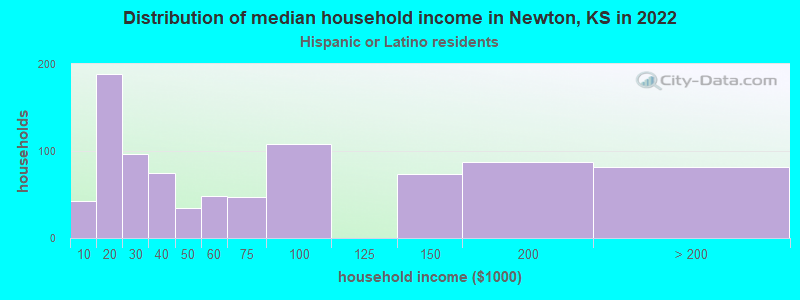
Income and house value in Newton Median household income in 2022 $69,500 White non-Hispanic householders$46,354 Two or more races householders$54,378 Hispanic or Latino race householdersMedian 2022 house value $156,598 White Non-Hispanic householders$119,165 Black or African American householders$159,478 American Indian or Alaska Native householders $283,738 Asian householders$102,553 Some other race householders$142,422 Two or more races householders$107,426 Hispanic or Latino householders
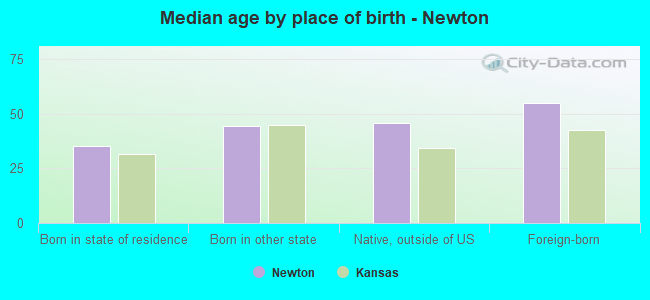
Median age by race in Newton
42.2 Median age for White residents40.9 42.5 34.1 Median age for Black or African American residents37.7 33.2 37.4 Median age for American Indian / Alaska Native residents15.2 39.5 -697,154,470.8 Median age for Asian residents-717,460,316.7 -674,418,604.0 -627,039,626.4 Median age for Native Hawaiian / Pacific Islander residents-669,240,668.6 -641,269,840.6 53.9 Median age for Other race residents39.6 54.4 32.0 Median age for Two or more races residents31.6 34.6 43.3 Median age for White alone residents41.8 45.1 31.4 Median age for Hispanic or Latino residents30.9 35.3
Owner/renter occupied households by race in Newton
House owners and renters - White residents 4,522 70.1% Owner occupied1,927 29.9% Renter occupiedHouse owners and renters - Black or African American residents 22 30.4% Owner occupied51 69.6% Renter occupiedHouse owners and renters - American Indian / Alaska Native residents 78 100.0% Owner occupiedHouse owners and renters - Native Hawaiian / Pacific Islander residents 7 100.0% Owner occupiedHouse owners and renters - Other race residents 266 82.1% Owner occupied58 17.9% Renter occupiedHouse owners and renters - Two or more races residents 344 60.4% Owner occupied225 39.6% Renter occupiedHouse owners and renters - White alone residents 4,395 70.8% Owner occupied1,808 29.2% Renter occupiedHouse owners and renters - Hispanic or Latino residents 546 61.2% Owner occupied345 38.8% Renter occupied
Language usage in Newton
English speakers - Total 92.4% of residents of Newton speak English at home.
6.9% of residents speak Spanish at home 858 71.0% Speak English very well351 29.0% Speak English less than very well0.9% of residents speak other language at home 152 100.0% Speak English very well
English speakers - Born in the United States 94.1% of residents of Newton speak English at home.
4.1% of residents speak Spanish at home 146 82.5% Speak English very well31 17.5% Speak English less than very well1.8% of residents speak other language at home 78 100.0% Speak English very well
English speakers - Native, born elsewhere 85.2% of residents of Newton speak English at home.
14.8% of residents speak Spanish at home 21 100.0% Speak English very well
English speakers - Foreign-born 22.4% of residents of Newton speak English at home.
72.6% of residents speak Spanish at home 218 41.5% Speak English very well307 58.5% Speak English less than very well6.8% of residents speak other language at home 49 100.0% Speak English very well
White (Caucasian) - Speak only English Native:
98.9% (13,438)Foreign-born:
100.0% (132)
White (Caucasian) - Speak another language Native:
1.5% (206)Foreign-born:
27.5% (36)
American Indian / Alaska Native - Speak another language Native:
100.0% (226)Foreign-born:
100.0% (112)
Asian - Speak another language Native:
84.7% (2)Foreign-born:
100.0% (26)
Other race - Speak another language Native:
13.5% (91)Foreign-born:
96.6% (428)
Two or more races - Speak another language Native:
15.0% (329)Foreign-born:
100.0% (79)
White alone - Speak only English Native:
98.2% (12,523)Foreign-born:
81.2% (142)
White alone - Speak another language Native:
1.7% (223)Foreign-born:
13.0% (23)
Hispanic or Latino - Speak another language Native:
18.4% (537)Foreign-born:
98.4% (522)
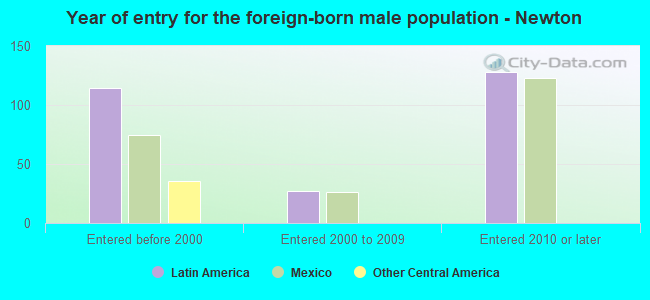
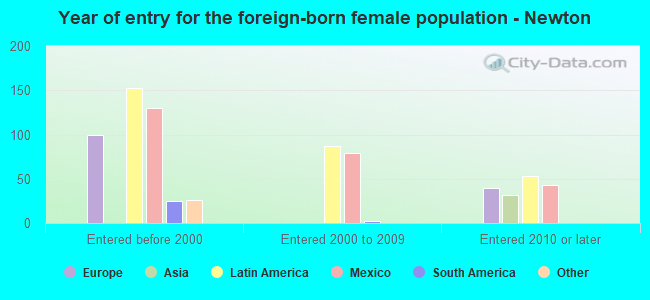
Foreign-born residents in Newton 736 residents are foreign born (2.8% Latin America , 0.7% Europe ).
This city:
4.0%Kansas:
7.1%
Marital status for residents in Newton Marital status - White (Caucasian) population 15 years and over
Males 23.0% Never married54.6% Now married1.2% Separated3.7% Widowed17.6% DivorcedFemales 26.9% Never married46.3% Now married2.5% Separated9.1% Widowed15.3% DivorcedWomen who gave birth in the past 12 months Now married:
81.2% (259)Unmarried:
18.8% (60)
Women who did not give birth in the past 12 months Now married:
41.0% (1,211)Unmarried:
59.0% (1,742)
Marital status - Black or African American population 15 years and over
Males 34.4% Never married44.4% Now married0.0% Separated0.0% Widowed21.2% DivorcedFemales 31.7% Never married15.4% Now married0.0% Separated0.0% Widowed52.9% DivorcedWomen who did not give birth in the past 12 months Now married:
15.4% (16)Unmarried:
84.6% (90)
Marital status - American Indian / Alaska Native population 15 years and over
Males 15.5% Never married84.5% Now married0.0% Separated0.0% Widowed0.0% DivorcedFemales 0.0% Never married98.6% Now married0.0% Separated0.0% Widowed1.4% DivorcedWomen who did not give birth in the past 12 months Now married:
100.0% (52)Unmarried:
0.0% (0)
Marital status - Asian population 15 years and over
Males 0.0% Never married100.0% Now married0.0% Separated0.0% Widowed0.0% DivorcedFemales 0.0% Never married100.0% Now married0.0% Separated0.0% Widowed0.0% DivorcedWomen who did not give birth in the past 12 months Now married:
100.0% (28)Unmarried:
0.0% (0)
Marital status - Other race population 15 years and over
Males 36.9% Never married51.2% Now married0.0% Separated0.0% Widowed11.9% DivorcedFemales 0.3% Never married80.2% Now married0.0% Separated0.0% Widowed19.5% DivorcedWomen who did not give birth in the past 12 months Now married:
100.0% (88)Unmarried:
0.0% (0)
Marital status - Two or more races population 15 years and over
Males 70.0% Never married19.2% Now married4.7% Separated6.1% Widowed0.0% DivorcedFemales 19.2% Never married36.9% Now married0.0% Separated16.8% Widowed27.1% DivorcedWomen who gave birth in the past 12 months Now married:
59.3% (42)Unmarried:
40.7% (29)
Women who did not give birth in the past 12 months Now married:
7.7% (22)Unmarried:
92.3% (268)
Marital status - White alone, not Hispanic / Latino population 15 years and over
Males 22.6% Never married55.6% Now married1.2% Separated3.4% Widowed17.2% DivorcedFemales 25.5% Never married45.8% Now married2.7% Separated9.6% Widowed16.3% DivorcedWomen who gave birth in the past 12 months Now married:
63.5% (92)Unmarried:
36.5% (53)
Women who did not give birth in the past 12 months Now married:
42.7% (1,172)Unmarried:
57.3% (1,574)
Marital status - Hispanic or Latino population 15 years and over
Males 54.6% Never married29.9% Now married2.7% Separated3.9% Widowed8.9% DivorcedFemales 22.8% Never married60.7% Now married0.0% Separated1.2% Widowed15.2% DivorcedWomen who gave birth in the past 12 months Now married:
86.8% (215)Unmarried:
13.2% (33)
Women who did not give birth in the past 12 months Now married:
42.9% (215)Unmarried:
57.1% (286)
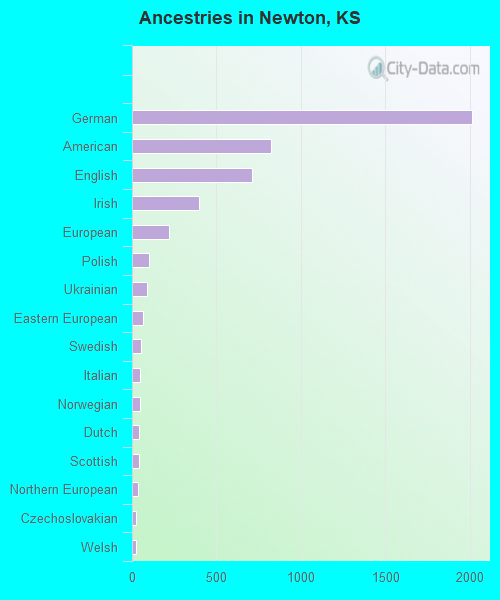
Ancestries in Newton
2,012 24.4% German825 10.0% American710 8.6% English398 4.8% Irish220 2.7% European102 1.2% Polish89 1.1% Ukrainian68 0.8% Eastern European51 0.6% Swedish48 0.6% Italian45 0.5% Norwegian43 0.5% Dutch43 0.5% Scottish38 0.5% Northern European26 0.3% Czechoslovakian24 0.3% Welsh18 0.2% French17 0.2% British9 0.1% Belgian9 0.1% Scotch-Irish9 0.1% Swiss7 0.08% Czech
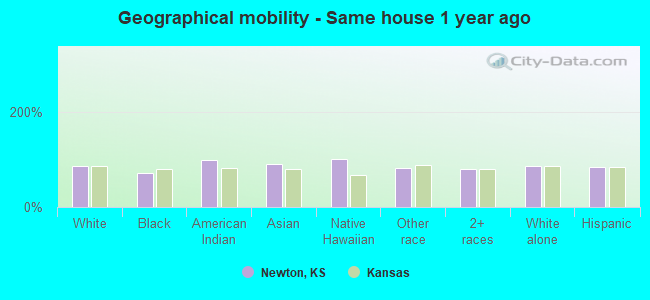
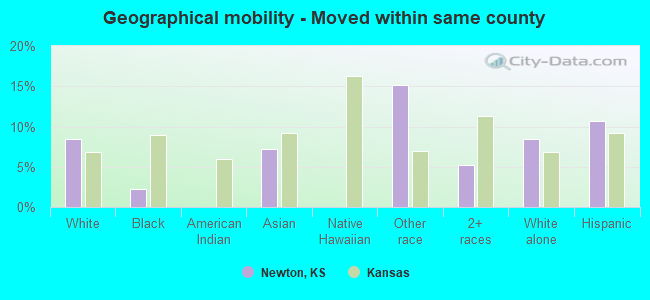
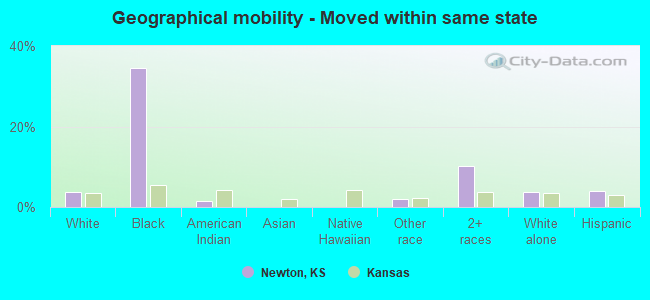
Geographical mobility in Newton Same house 1 year ago 11,948 84.7% White (Caucasian)281 72.1% Black or African American309 98.2% American Indian / Alaska Native27 91.3% Asian10 100.0% Native Hawaiian / Pacific Islander916 81.7% Other race2,056 79.4% Two or more races11,265 84.6% White alone, not Hispanic / Latino3,062 84.1% Hispanic or LatinoMoved within same county 1,194 8.5% White / Caucasian9 2.2% Black or African American2 7.2% Asian171 15.2% Other race135 5.2% Two or more races1,129 8.5% White alone, not Hispanic / Latino391 10.7% Hispanic or LatinoMoved within same state 532 3.8% White / Caucasian135 34.6% Black or African American5 1.5% American Indian / Alaska Native22 2.0% Other race263 10.2% Two or more races507 3.8% White alone, not Hispanic / Latino145 4.0% Hispanic or LatinoMoved from different state 405 2.9% White / Caucasian0 0.0% Other race90 3.5% Two or more races390 2.9% White alone, not Hispanic / Latino40 1.1% Hispanic or LatinoMoved from abroad 11 0.4% Two or more races
Children Nativity (place of birth) in Newton
Children under 6 years - Living with two parents Both parents native 786 100.0% NativeOne native, one foreign-born parent 38 100.0% NativeChildren under 6 years - Living with one parent Native parent 380 100.0% Native
Children 6 to 17 years - Living with two parents Both parents native 1,422 100.0% NativeOne native, one foreign-born parent 297 100.0% NativeChildren 6 to 17 years - Living with one parent Native parent 883 100.0% Native
Grandparents responsible for own grandchildren in Newton
Grandparents (30 to 59 years) White / Caucasian 28 15.5% Responsible for grandchildren153 84.5% Not responsible for grandchildrenWhite alone, not Hispanic / Latino 30 16.9% Responsible for grandchildren146 83.1% Not responsible for grandchildrenHispanic or Latino 25 100.0% Not responsible for grandchildrenGrandparents (60 years and over) White / Caucasian 23 30.9% Responsible for grandchildren52 69.1% Not responsible for grandchildrenWhite alone, not Hispanic / Latino 24 37.0% Responsible for grandchildren41 63.0% Not responsible for grandchildrenHispanic or Latino 19 58.4% Responsible for grandchildren14 41.6% Not responsible for grandchildren