Races in Nome, Alaska (AK) Detailed Stats
Data:
Races - White alone (%)
Races - White alone (% change since 2000)
Races - Black alone (%)
Races - Black alone (% change since 2000)
Races - American Indian alone (%)
Races - American Indian alone (% change since 2000)
Races - Asian alone (%)
Races - Asian alone (% change since 2000)
Races - Hispanic (%)
Races - Hispanic (% change since 2000)
Races - Native Hawaiian and Other Pacific Islander alone (%)
Races - Native Hawaiian and Other Pacific Islander alone (% change since 2000)
Races - Two or more races(%)
Races - Two or more races(% change since 2000)
Races - Other race alone (%)
Races - Other race alone (% change since 2000)
Racial diversity
Place of birth - Born in state of residence (%)
Place of birth - Born in state of residence (%) - White
Place of birth - Born in state of residence (%) - Black or African American
Place of birth - Born in state of residence (%) - Asian
Place of birth - Born in state of residence (%) - Hispanic or Latino
Place of birth - Born in state of residence (%) - American Indian and Alaska Native
Place of birth - Born in state of residence (%) - Multirace
Place of birth - Born in state of residence (%) - Other Race
Place of birth - Born in other state (%)
Place of birth - Born in other state (%) - White
Place of birth - Born in other state (%) - Black or African American
Place of birth - Born in other state (%) - Asian
Place of birth - Born in other state (%) - Hispanic or Latino
Place of birth - Born in other state (%) - American Indian and Alaska Native
Place of birth - Born in other state (%) - Multirace
Place of birth - Born in other state (%) - Other Race
Place of birth - Native, outside of US (%)
Place of birth - Native, outside of US (%) - White
Place of birth - Native, outside of US (%) - Black or African American
Place of birth - Native, outside of US (%) - Asian
Place of birth - Native, outside of US (%) - Hispanic or Latino
Place of birth - Native, outside of US (%) - American Indian and Alaska Native
Place of birth - Native, outside of US (%) - Multirace
Place of birth - Native, outside of US (%) - Other Race
Place of birth - Foreign born (%)
Place of birth - Foreign born (%) - White
Place of birth - Foreign born (%) - Black or African American
Place of birth - Foreign born (%) - Asian
Place of birth - Foreign born (%) - Hispanic or Latino
Place of birth - Foreign born (%) - American Indian and Alaska Native
Place of birth - Foreign born (%) - Multirace
Place of birth - Foreign born (%) - Other Race
Residents speaking English at home (%)
Residents speaking English at home - Born in the United States (%)
Residents speaking English at home - Native, born elsewhere (%)
Residents speaking English at home - Foreign born (%)
Residents speaking Spanish at home (%)
Residents speaking Spanish at home - Born in the United States (%)
Residents speaking Spanish at home - Native, born elsewhere (%)
Residents speaking Spanish at home - Foreign born (%)
Residents speaking other language at home (%)
Residents speaking other language at home - Born in the United States (%)
Residents speaking other language at home - Native, born elsewhere (%)
Residents speaking other language at home - Foreign born (%)
Marital status - Never married (%)
Marital status - Now married (%)
Marital status - Separated (%)
Marital status - Widowed (%)
Marital status - Divorced (%)
Ancestries Reported - Arab (%)
Ancestries Reported - Czech (%)
Ancestries Reported - Danish (%)
Ancestries Reported - Dutch (%)
Ancestries Reported - English (%)
Ancestries Reported - French (%)
Ancestries Reported - French Canadian (%)
Ancestries Reported - German (%)
Ancestries Reported - Greek (%)
Ancestries Reported - Hungarian (%)
Ancestries Reported - Irish (%)
Ancestries Reported - Italian (%)
Ancestries Reported - Lithuanian (%)
Ancestries Reported - Norwegian (%)
Ancestries Reported - Polish (%)
Ancestries Reported - Portuguese (%)
Ancestries Reported - Russian (%)
Ancestries Reported - Scotch-Irish (%)
Ancestries Reported - Scottish (%)
Ancestries Reported - Slovak (%)
Ancestries Reported - Subsaharan African (%)
Ancestries Reported - Swedish (%)
Ancestries Reported - Swiss (%)
Ancestries Reported - Ukrainian (%)
Ancestries Reported - United States (%)
Ancestries Reported - Welsh (%)
Ancestries Reported - West Indian (%)
Ancestries Reported - Other (%)
Geographical mobility - Same house 1 year ago (%)
Geographical mobility - Same house 1 year ago (%) - White
Geographical mobility - Same house 1 year ago (%) - Black or African American
Geographical mobility - Same house 1 year ago (%) - Asian
Geographical mobility - Same house 1 year ago (%) - Hispanic or Latino
Geographical mobility - Same house 1 year ago (%) - American Indian and Alaska Native
Geographical mobility - Same house 1 year ago (%) - Multirace
Geographical mobility - Same house 1 year ago (%) - Other Race
Geographical mobility - Moved within same county (%)
Geographical mobility - Moved within same county (%) - White
Geographical mobility - Moved within same county (%) - Black or African American
Geographical mobility - Moved within same county (%) - Asian
Geographical mobility - Moved within same county (%) - Hispanic or Latino
Geographical mobility - Moved within same county (%) - American Indian and Alaska Native
Geographical mobility - Moved within same county (%) - Multirace
Geographical mobility - Moved within same county (%) - Other Race
Geographical mobility - Moved from different county within same state (%)
Geographical mobility - Moved from different county within same state (%) - White
Geographical mobility - Moved from different county within same state (%) - Black or African American
Geographical mobility - Moved from different county within same state (%) - Asian
Geographical mobility - Moved from different county within same state (%) - Hispanic or Latino
Geographical mobility - Moved from different county within same state (%) - American Indian and Alaska Native
Geographical mobility - Moved from different county within same state (%) - Multirace
Geographical mobility - Moved from different county within same state (%) - Other Race
Geographical mobility - Moved from different state (%)
Geographical mobility - Moved from different state (%) - White
Geographical mobility - Moved from different state (%) - Black or African American
Geographical mobility - Moved from different state (%) - Asian
Geographical mobility - Moved from different state (%) - Hispanic or Latino
Geographical mobility - Moved from different state (%) - American Indian and Alaska Native
Geographical mobility - Moved from different state (%) - Multirace
Geographical mobility - Moved from different state (%) - Other Race
Geographical mobility - Moved from abroad (%)
Geographical mobility - Moved from abroad (%) - White
Geographical mobility - Moved from abroad (%) - Black or African American
Geographical mobility - Moved from abroad (%) - Asian
Geographical mobility - Moved from abroad (%) - Hispanic or Latino
Geographical mobility - Moved from abroad (%) - American Indian and Alaska Native
Geographical mobility - Moved from abroad (%) - Multirace
Geographical mobility - Moved from abroad (%) - Other Race
Place of birth for the foreign-born population - Ireland (%)
Place of birth for the foreign-born population - Denmark (%)
Place of birth for the foreign-born population - Norway (%)
Place of birth for the foreign-born population - Sweden (%)
Place of birth for the foreign-born population - United Kingdom (%)
Place of birth for the foreign-born population - England (%)
Place of birth for the foreign-born population - Scotland (%)
Place of birth for the foreign-born population - Other Northern Europe (%)
Place of birth for the foreign-born population - Austria (%)
Place of birth for the foreign-born population - Belgium (%)
Place of birth for the foreign-born population - France (%)
Place of birth for the foreign-born population - Germany (%)
Place of birth for the foreign-born population - Netherlands (%)
Place of birth for the foreign-born population - Switzerland (%)
Place of birth for the foreign-born population - Other Western Europe (%)
Place of birth for the foreign-born population - Greece (%)
Place of birth for the foreign-born population - Italy (%)
Place of birth for the foreign-born population - Portugal (%)
Place of birth for the foreign-born population - Spain (%)
Place of birth for the foreign-born population - Other Southern Europe (%)
Place of birth for the foreign-born population - Albania (%)
Place of birth for the foreign-born population - Belarus (%)
Place of birth for the foreign-born population - Bosnia and Herzegovina (%)
Place of birth for the foreign-born population - Bulgaria (%)
Place of birth for the foreign-born population - Croatia (%)
Place of birth for the foreign-born population - Czechoslovakia (%)
Place of birth for the foreign-born population - Hungary (%)
Place of birth for the foreign-born population - Latvia (%)
Place of birth for the foreign-born population - Lithuania (%)
Place of birth for the foreign-born population - North Macedonia (Macedonia) (%)
Place of birth for the foreign-born population - Moldova (%)
Place of birth for the foreign-born population - Poland (%)
Place of birth for the foreign-born population - Romania (%)
Place of birth for the foreign-born population - Russia (%)
Place of birth for the foreign-born population - Serbia (%)
Place of birth for the foreign-born population - Ukraine (%)
Place of birth for the foreign-born population - Other Eastern Europe (%)
Place of birth for the foreign-born population - China (%)
Place of birth for the foreign-born population - Hong Kong (%)
Place of birth for the foreign-born population - Taiwan (%)
Place of birth for the foreign-born population - Japan (%)
Place of birth for the foreign-born population - Korea (%)
Place of birth for the foreign-born population - Other Eastern Asia (%)
Place of birth for the foreign-born population - Afghanistan (%)
Place of birth for the foreign-born population - Bangladesh (%)
Place of birth for the foreign-born population - India (%)
Place of birth for the foreign-born population - Iran (%)
Place of birth for the foreign-born population - Kazakhstan (%)
Place of birth for the foreign-born population - Nepal (%)
Place of birth for the foreign-born population - Pakistan (%)
Place of birth for the foreign-born population - Sri Lanka (%)
Place of birth for the foreign-born population - Uzbekistan (%)
Place of birth for the foreign-born population - Other South Central Asia (%)
Place of birth for the foreign-born population - Burma (%)
Place of birth for the foreign-born population - Cambodia (%)
Place of birth for the foreign-born population - Indonesia (%)
Place of birth for the foreign-born population - Laos (%)
Place of birth for the foreign-born population - Malaysia (%)
Place of birth for the foreign-born population - Philippines (%)
Place of birth for the foreign-born population - Singapore (%)
Place of birth for the foreign-born population - Thailand (%)
Place of birth for the foreign-born population - Vietnam (%)
Place of birth for the foreign-born population - Other South Eastern Asia (%)
Place of birth for the foreign-born population - Armenia (%)
Place of birth for the foreign-born population - Iraq (%)
Place of birth for the foreign-born population - Israel (%)
Place of birth for the foreign-born population - Jordan (%)
Place of birth for the foreign-born population - Kuwait (%)
Place of birth for the foreign-born population - Lebanon (%)
Place of birth for the foreign-born population - Saudi Arabia (%)
Place of birth for the foreign-born population - Syria (%)
Place of birth for the foreign-born population - Turkey (%)
Place of birth for the foreign-born population - Yemen (%)
Place of birth for the foreign-born population - Other Western Asia (%)
Place of birth for the foreign-born population - Eritrea (%)
Place of birth for the foreign-born population - Ethiopia (%)
Place of birth for the foreign-born population - Kenya (%)
Place of birth for the foreign-born population - Somalia (%)
Place of birth for the foreign-born population - Uganda (%)
Place of birth for the foreign-born population - Zimbabwe (%)
Place of birth for the foreign-born population - Other Eastern Africa (%)
Place of birth for the foreign-born population - Cameroon (%)
Place of birth for the foreign-born population - Congo (%)
Place of birth for the foreign-born population - Democratic Republic of Congo (Zaire) (%)
Place of birth for the foreign-born population - Other Middle Africa (%)
Place of birth for the foreign-born population - Egypt (%)
Place of birth for the foreign-born population - Morocco (%)
Place of birth for the foreign-born population - Sudan (%)
Place of birth for the foreign-born population - Other Northern Africa (%)
Place of birth for the foreign-born population - South Africa (%)
Place of birth for the foreign-born population - Other Southern Africa (%)
Place of birth for the foreign-born population - Cabo Verde (%)
Place of birth for the foreign-born population - Ghana (%)
Place of birth for the foreign-born population - Liberia (%)
Place of birth for the foreign-born population - Nigeria (%)
Place of birth for the foreign-born population - Senegal (%)
Place of birth for the foreign-born population - Sierra Leone (%)
Place of birth for the foreign-born population - Other Western Africa (%)
Place of birth for the foreign-born population - Australia (%)
Place of birth for the foreign-born population - New Zealand (%)
Place of birth for the foreign-born population - Fiji (%)
Place of birth for the foreign-born population - Micronesia (%)
Place of birth for the foreign-born population - Bahamas (%)
Place of birth for the foreign-born population - Barbados (%)
Place of birth for the foreign-born population - Cuba (%)
Place of birth for the foreign-born population - Dominica (%)
Place of birth for the foreign-born population - Dominican Republic (%)
Place of birth for the foreign-born population - Grenada (%)
Place of birth for the foreign-born population - Haiti (%)
Place of birth for the foreign-born population - Jamaica (%)
Place of birth for the foreign-born population - St. Vincent and the Grenadines (%)
Place of birth for the foreign-born population - Trinidad and Tobago (%)
Place of birth for the foreign-born population - West Indies (%)
Place of birth for the foreign-born population - Other Caribbean (%)
Place of birth for the foreign-born population - Belize (%)
Place of birth for the foreign-born population - Costa Rica (%)
Place of birth for the foreign-born population - El Salvador (%)
Place of birth for the foreign-born population - Guatemala (%)
Place of birth for the foreign-born population - Honduras (%)
Place of birth for the foreign-born population - Mexico (%)
Place of birth for the foreign-born population - Nicaragua (%)
Place of birth for the foreign-born population - Panama (%)
Place of birth for the foreign-born population - Other Central America (%)
Place of birth for the foreign-born population - Argentina (%)
Place of birth for the foreign-born population - Bolivia (%)
Place of birth for the foreign-born population - Brazil (%)
Place of birth for the foreign-born population - Chile (%)
Place of birth for the foreign-born population - Colombia (%)
Place of birth for the foreign-born population - Ecuador (%)
Place of birth for the foreign-born population - Guyana (%)
Place of birth for the foreign-born population - Peru (%)
Place of birth for the foreign-born population - Uruguay (%)
Place of birth for the foreign-born population - Venezuela (%)
Place of birth for the foreign-born population - Other South America (%)
Place of birth for the foreign-born population - Canada (%)
Place of birth for the foreign-born population - Other Northern America (%)
Place of birth for the foreign-born population - Other (%)
Latest news about races in Nome, AK collected exclusively by city-data.com from local newspapers, TV, and radio stations
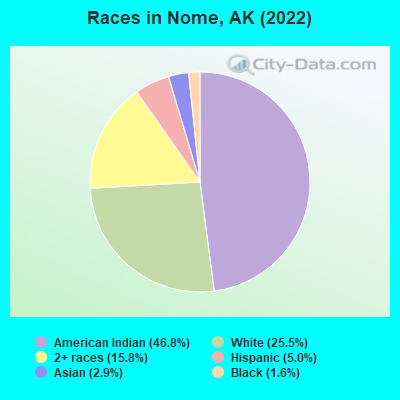
According to 2022 data, the most numerous races in Nome, AK are White alone (916 residents), American Indian alone (2,172 residents), and Two or more races (474 residents). 78.6% of Nome residents speak English at home. 3.0% of Nome, AK residents are foreign-born (1.0% born in Europe, 0.9% born in Latin America, 0.4% born in Asia, 0.3% born in Africa), which is 129.9% less than the foreign-born rate of 7.0% across the entire state of Alaska.
Race distribution in Nome
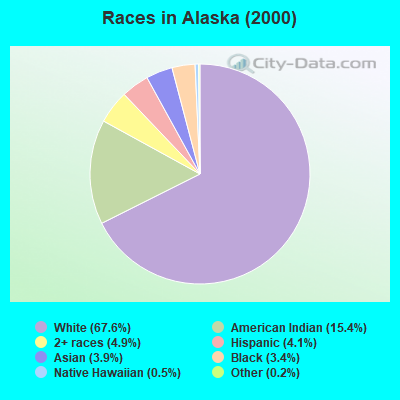
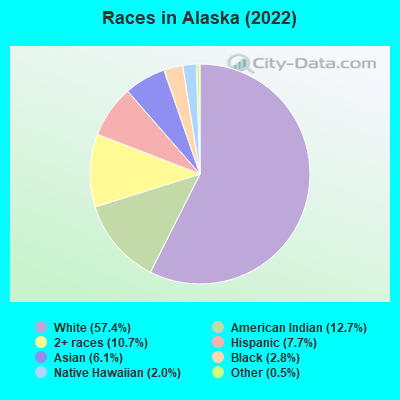
2000 2022
423,788 67.6% White alone 96,505 15.4% American Indian alone 30,454 4.9% Two or more races 25,852 4.1% Hispanic 24,741 3.9% Asian alone 21,073 3.4% Black alone 3,181 0.5% Native Hawaiian and Other 1,338 0.2% Other race alone
421,104 57.4% White alone 93,294 12.7% American Indian alone 78,552 10.7% Two or more races 56,491 7.7% Hispanic 44,905 6.1% Asian alone 20,664 2.8% Black alone 14,539 2.0% Native Hawaiian and Other 4,034 0.5% Other race alone
Income and house value in Nome Median household income in 2022 $118,022 White non-Hispanic householders$113,447 Black householders$67,281 American Indian and Alaska Native householders$115,380 Asian householders$50,120 Some other race householders$104,214 Two or more races householders$111,384 Hispanic or Latino race householdersMedian 2022 house value $344,746 White Non-Hispanic householders$197,873 American Indian or Alaska Native householders $183,897 Asian householders$275,846 Some other race householders$239,066 Two or more races householders$168,695 Hispanic or Latino householders
Median age by race in Nome
44.0 Median age for White residents49.9 38.7 39.4 Median age for Black or African American residents24.9 39.3 29.4 Median age for American Indian / Alaska Native residents28.1 30.0 36.3 Median age for Asian residents65.4 1.9 23.1 Median age for Native Hawaiian / Pacific Islander residents58.6 Median age for Other race residents25.5 Median age for Two or more races residents29.1 20.9 45.5 Median age for White alone residents50.2 37.9 15.3 Median age for Hispanic or Latino residents14.8 18.6
Owner/renter occupied households by race in Nome
House owners and renters - White residents 271 60.3% Owner occupied179 39.7% Renter occupiedHouse owners and renters - Black or African American residents 7 23.7% Owner occupied22 76.3% Renter occupiedHouse owners and renters - American Indian / Alaska Native residents 285 39.8% Owner occupied430 60.2% Renter occupiedHouse owners and renters - Asian residents 5 34.9% Owner occupied10 65.1% Renter occupiedHouse owners and renters - Native Hawaiian / Pacific Islander residents 6 100.0% Renter occupiedHouse owners and renters - Two or more races residents 46 28.3% Owner occupied115 71.7% Renter occupiedHouse owners and renters - White alone residents 248 57.7% Owner occupied182 42.3% Renter occupiedHouse owners and renters - Hispanic or Latino residents 38 71.3% Owner occupied15 28.7% Renter occupied
Language usage in Nome
English speakers - Total 78.6% of residents of Nome speak English at home.
2.8% of residents speak Spanish at home 87 89.7% Speak English very well10 10.3% Speak English less than very well18.8% of residents speak other language at home 597 91.6% Speak English very well55 8.4% Speak English less than very well
English speakers - Born in the United States 88.7% of residents of Nome speak English at home.
4.9% of residents speak Spanish at home 42 100.0% Speak English very well5.6% of residents speak other language at home 45 93.8% Speak English very well3 6.3% Speak English less than very well
English speakers - Native, born elsewhere 60.0% of residents of Nome speak English at home.
20.0% of residents speak Spanish at home 6 100.0% Speak English very well20.0% of residents speak other language at home 6 100.0% Speak English very well
English speakers - Foreign-born 27.8% of residents of Nome speak English at home.
7.8% of residents speak Spanish at home 5 55.6% Speak English very well4 44.4% Speak English less than very well64.3% of residents speak other language at home 59 79.7% Speak English very well15 20.3% Speak English less than very well
White (Caucasian) - Speak only English Native:
91.8% (818)Foreign-born:
21.7% (12)
White (Caucasian) - Speak another language Native:
7.8% (70)Foreign-born:
72.6% (42)
Black or African American - Speak only English Native:
82.6% (37)Foreign-born:
76.7% (17)
Black or African American - Speak another language Native:
26.2% (12)Foreign-born:
39.7% (9)
American Indian / Alaska Native - Speak only English Native:
75.8% (1,511)Foreign-born:
89.6% (5)
Asian - Speak only English Native:
58.2% (7)Foreign-born:
6.1% (1)
Asian - Speak another language Native:
41.3% (5)Foreign-born:
93.6% (15)
Other race - Speak another language Native:
72.4% (4)Foreign-born:
93.8% (6)
Two or more races - Speak only English Native:
87.9% (383)Foreign-born:
100.0% (2)
White alone - Speak only English Native:
93.9% (785)Foreign-born:
12.1% (6)
White alone - Speak another language Native:
5.4% (45)Foreign-born:
74.6% (38)
Hispanic or Latino - Speak only English Native:
54.4% (104)Foreign-born:
32.7% (5)
Hispanic or Latino - Speak another language Native:
46.4% (89)Foreign-born:
66.5% (11)
Foreign-born residents in Nome 116 residents are foreign born (1.0% Europe , 0.9% Latin America , 0.4% Asia , 0.3% Africa ).
This city:
3.0%Alaska:
100.0%
Marital status for residents in Nome Marital status - White (Caucasian) population 15 years and over
Males 20.8% Never married59.0% Now married1.0% Separated2.9% Widowed16.3% DivorcedFemales 17.0% Never married67.2% Now married1.5% Separated2.9% Widowed11.4% DivorcedWomen who gave birth in the past 12 months Now married:
100.0% (18)Unmarried:
0.0% (0)
Women who did not give birth in the past 12 months Now married:
67.5% (150)Unmarried:
32.5% (72)
Marital status - Black or African American population 15 years and over
Males 31.3% Never married68.8% Now married0.0% Separated0.0% Widowed0.0% DivorcedFemales 59.1% Never married13.6% Now married13.6% Separated0.0% Widowed13.6% DivorcedWomen who gave birth in the past 12 months Now married:
50.0% (5)Unmarried:
50.0% (5)
Women who did not give birth in the past 12 months Now married:
0.0% (0)Unmarried:
100.0% (16)
Marital status - American Indian / Alaska Native population 15 years and over
Males 63.5% Never married25.9% Now married1.3% Separated2.2% Widowed7.0% DivorcedFemales 38.6% Never married35.7% Now married4.0% Separated10.7% Widowed11.0% DivorcedWomen who gave birth in the past 12 months Now married:
33.3% (9)Unmarried:
66.7% (18)
Women who did not give birth in the past 12 months Now married:
38.4% (209)Unmarried:
61.6% (335)
Marital status - Asian population 15 years and over
Males 47.6% Never married14.3% Now married9.5% Separated0.0% Widowed28.6% DivorcedFemales 14.3% Never married71.4% Now married0.0% Separated0.0% Widowed14.3% DivorcedWomen who gave birth in the past 12 months Now married:
84.9% (1)Unmarried:
0.0% (0)
Women who did not give birth in the past 12 months Now married:
100.0% (2)Unmarried:
0.0% (0)
Marital status - Native Hawaiian / Pacific Islander population 15 years and over
Males 55.6% Never married0.0% Now married0.0% Separated0.0% Widowed44.4% DivorcedFemales 100.0% Never married0.0% Now married0.0% Separated0.0% Widowed0.0% DivorcedWomen who gave birth in the past 12 months Now married:
0.0% (0)Unmarried:
100.0% (5)
Marital status - Two or more races population 15 years and over
Males 57.0% Never married28.5% Now married3.2% Separated0.0% Widowed11.4% DivorcedFemales 53.8% Never married43.4% Now married0.0% Separated0.0% Widowed2.8% DivorcedWomen who gave birth in the past 12 months Now married:
0.0% (0)Unmarried:
100.0% (5)
Women who did not give birth in the past 12 months Now married:
29.1% (30)Unmarried:
70.9% (74)
Marital status - White alone, not Hispanic / Latino population 15 years and over
Males 19.6% Never married59.7% Now married1.0% Separated3.0% Widowed16.7% DivorcedFemales 17.2% Never married65.1% Now married1.6% Separated3.3% Widowed12.8% DivorcedWomen who gave birth in the past 12 months Now married:
100.0% (13)Unmarried:
0.0% (0)
Women who did not give birth in the past 12 months Now married:
65.7% (129)Unmarried:
34.3% (67)
Marital status - Hispanic or Latino population 15 years and over
Males 60.0% Never married22.0% Now married12.0% Separated0.0% Widowed6.0% DivorcedFemales 21.9% Never married78.1% Now married0.0% Separated0.0% Widowed0.0% DivorcedWomen who gave birth in the past 12 months Now married:
100.0% (6)Unmarried:
0.0% (0)
Women who did not give birth in the past 12 months Now married:
73.1% (38)Unmarried:
26.9% (14)
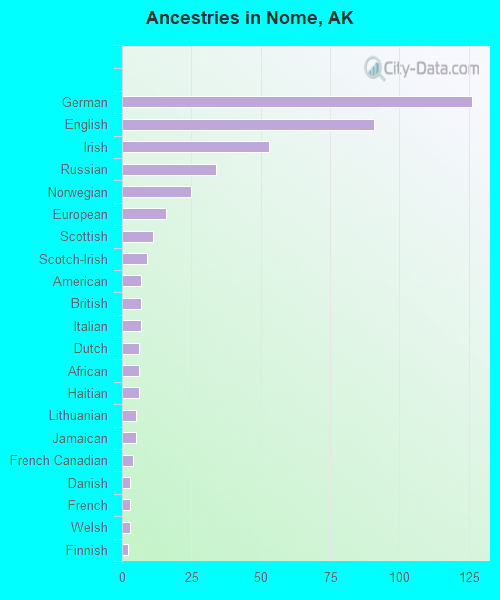
Ancestries in Nome
132 5.9% German48 2.1% English29 1.3% Jamaican24 1.1% Irish21 0.9% Italian20 0.9% Norwegian19 0.8% American16 0.7% Russian13 0.6% European13 0.6% French Canadian13 0.6% Scottish12 0.5% Polish12 0.5% Romanian9 0.4% Scotch-Irish8 0.4% Scandinavian8 0.4% Swedish6 0.3% Dutch6 0.3% French6 0.3% Lithuanian5 0.2% African3 0.1% British3 0.1% Finnish2 0.09% Belgian2 0.09% Swiss2 0.09% Welsh
Children Nativity (place of birth) in Nome
Children under 6 years - Living with two parents Both parents native 160 100.0% NativeBoth parents foreign-born 2 100.0% NativeOne native, one foreign-born parent 19 100.0% NativeChildren under 6 years - Living with one parent Native parent 189 100.0% NativeChildren 6 to 17 years - Living with two parents Both parents native 334 100.0% NativeBoth parents foreign-born 2 100.0% NativeChildren 6 to 17 years - Living with one parent Native parent 296 100.0% NativeForeign-born parent 3 48.3% Native3 51.7% Foreign-born
Grandparents responsible for own grandchildren in Nome
Grandparents (30 to 59 years) White / Caucasian 1 26.8% Responsible for grandchildren4 73.2% Not responsible for grandchildrenAmerican Indian / Alaska Native 4 10.8% Responsible for grandchildren34 89.2% Not responsible for grandchildrenWhite alone, not Hispanic / Latino 1 26.3% Responsible for grandchildren4 73.7% Not responsible for grandchildrenGrandparents (60 years and over) White / Caucasian 9 100.0% Responsible for grandchildrenAmerican Indian / Alaska Native 25 54.8% Responsible for grandchildren21 45.2% Not responsible for grandchildrenWhite alone, not Hispanic / Latino 9 100.0% Responsible for grandchildren