Races in Nutley, New Jersey (NJ) Detailed Stats
Ancestries, Foreign-born residents, place of birth

Recent posts about races in Nutley, New Jersey on our local forum with over 2,400,000 registered users:

Latest news about races in Nutley, NJ collected exclusively by city-data.com from local newspapers, TV, and radio stations
14.7% of Nutley, NJ residents are foreign-born (6.1% born in Asia, 4.6% born in Europe, 3.4% born in Latin America), which is 56.9% less than the foreign-born rate of 23.0% across the entire state of New Jersey.
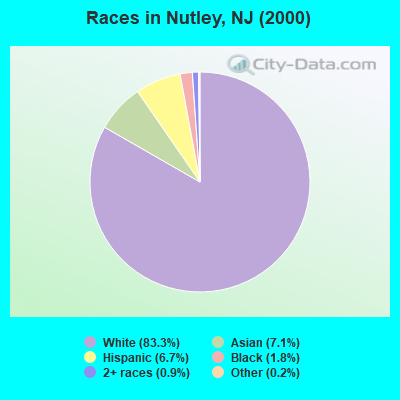
Race distribution in Nutley

- 22,79583.3%White alone
- 1,9347.1%Asian alone
- 1,8306.7%Hispanic
- 4841.8%Black alone
- 2500.9%Two or more races
- 500.2%Other race alone
- 100.04%American Indian alone
- 90.03%Native Hawaiian and Other
Pacific Islander alone
2000
2022
-
- 5,557,20966.0%White alone
- 1,117,19113.3%Hispanic
- 1,096,17113.0%Black alone
- 477,0125.7%Asian alone
- 133,6891.6%Two or more races
- 19,5650.2%Other race alone
- 11,3380.1%American Indian alone
- 2,1750.03%Native Hawaiian and Other
Pacific Islander alone

-
- 4,766,47651.5%White alone
- 2,028,47021.9%Hispanic
- 1,111,63212.0%Black alone
- 923,54610.0%Asian alone
- 332,2373.6%Two or more races
- 89,8471.0%Other race alone
- 8,5570.09%American Indian alone
- 9340.01%Native Hawaiian and Other
Pacific Islander alone

Income and house value in Nutley
- Median household income in 2022
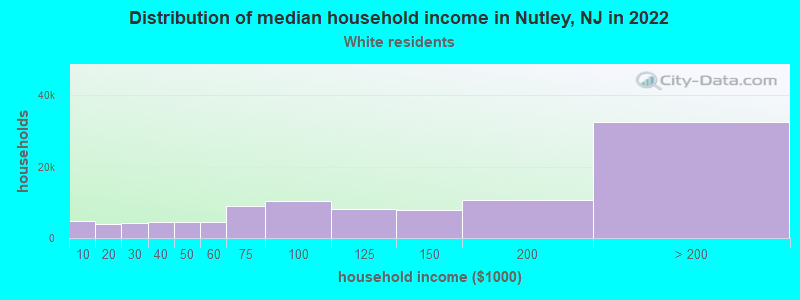
- $108,672White non-Hispanic householders
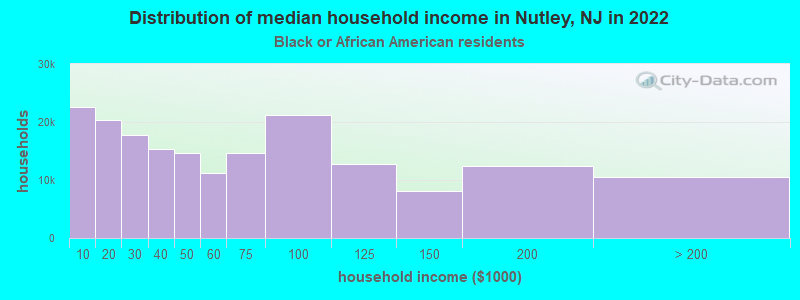
- $76,357Black householders
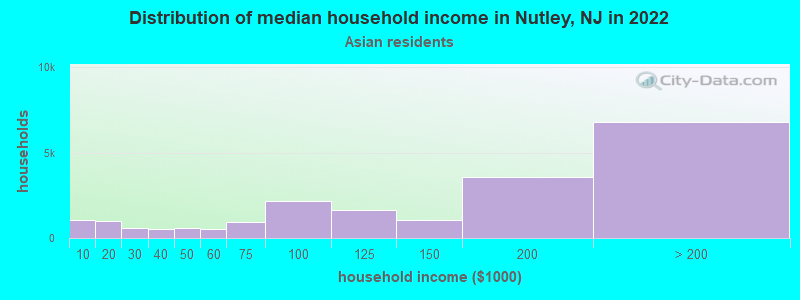
- $168,904Asian householders
- $101,910Some other race householders
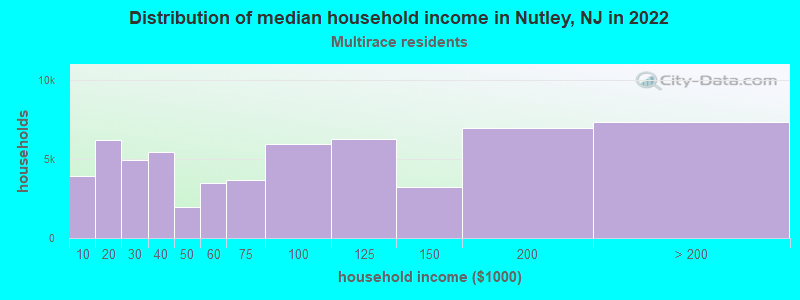
- $139,051Two or more races householders
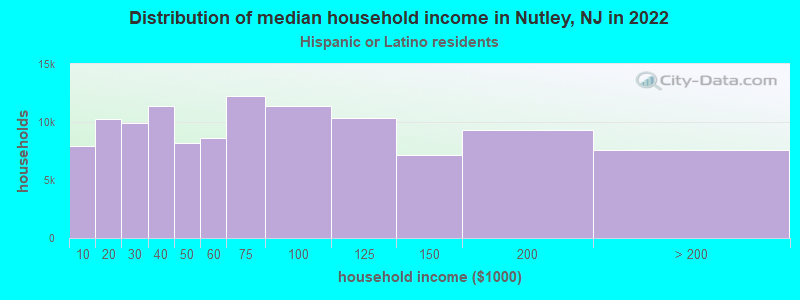
- $107,597Hispanic or Latino race householders
- Median 2022 house value
- $499,869White Non-Hispanic householders
- $490,690Black or African American householders
- $501,443Asian householders
- $438,500Some other race householders
- $402,833Two or more races householders
- $501,967Hispanic or Latino householders
Household income for White non-Hispanic householders
Household income for Black householders
Household income for Asian householders
Household income for Two or more races householders
Household income for Hispanic or Latino race householders
Foreign-born residents in Nutley
4,012 residents are foreign born (6.1% Asia, 4.6% Europe, 3.4% Latin America).
| This city: | 14.7% |
| New Jersey: | 17.5% |
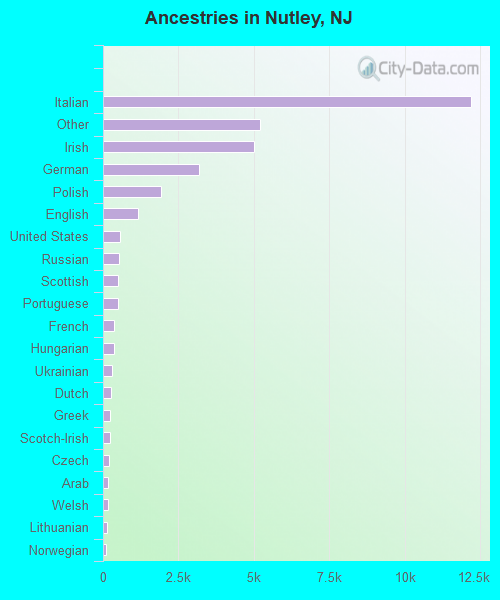
Ancestries in Nutley

- 12,18336.0%Italian
- 5,21915.4%Other
- 4,99914.8%Irish
- 3,1669.4%German
- 1,9125.7%Polish
- 1,1523.4%English
- 5631.7%United States
- 5311.6%Russian
- 4981.5%Scottish
- 4931.5%Portuguese
- 3641.1%French
- 3581.1%Hungarian
- 2920.9%Ukrainian
- 2610.8%Dutch
- 2470.7%Greek
- 2270.7%Scotch-Irish
- 2010.6%Czech
- 1750.5%Arab
- 1510.4%Welsh
- 1400.4%Lithuanian
- 1120.3%Norwegian
- 1090.3%West Indian
- 1020.3%Swedish
- 960.3%French Canadian
- 950.3%Slovak
- 880.3%Swiss
- 510.2%Danish
- 370.1%Subsaharan African
Zip codes: 07110.