Races in Oak Brook, Illinois (IL) Detailed Stats
Data:
Races - White alone (%)
Races - White alone (% change since 2000)
Races - Black alone (%)
Races - Black alone (% change since 2000)
Races - American Indian alone (%)
Races - American Indian alone (% change since 2000)
Races - Asian alone (%)
Races - Asian alone (% change since 2000)
Races - Hispanic (%)
Races - Hispanic (% change since 2000)
Races - Native Hawaiian and Other Pacific Islander alone (%)
Races - Native Hawaiian and Other Pacific Islander alone (% change since 2000)
Races - Two or more races(%)
Races - Two or more races(% change since 2000)
Races - Other race alone (%)
Races - Other race alone (% change since 2000)
Racial diversity
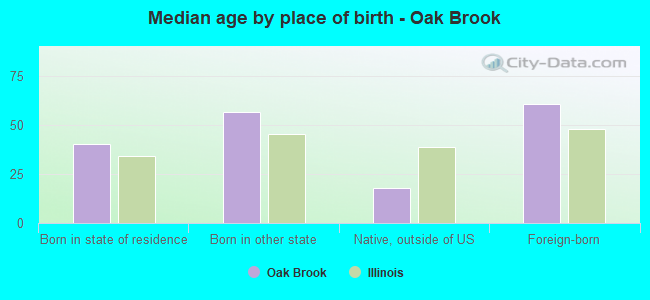
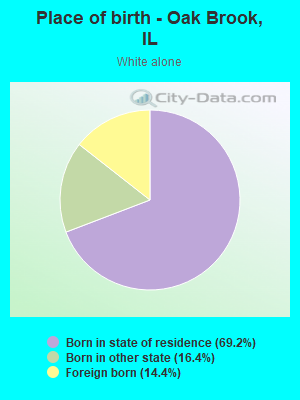
Place of birth - Born in state of residence (%)
Place of birth - Born in state of residence (%) - White
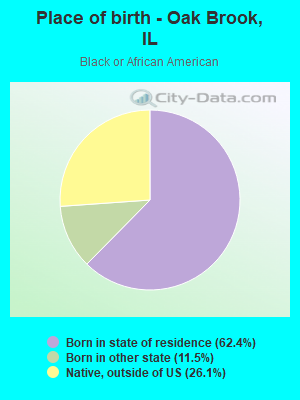
Place of birth - Born in state of residence (%) - Black or African American
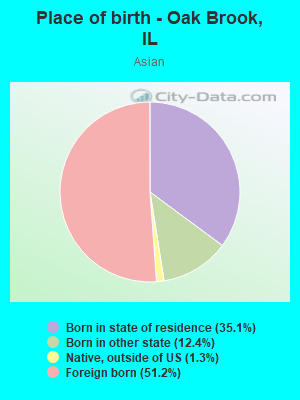
Place of birth - Born in state of residence (%) - Asian
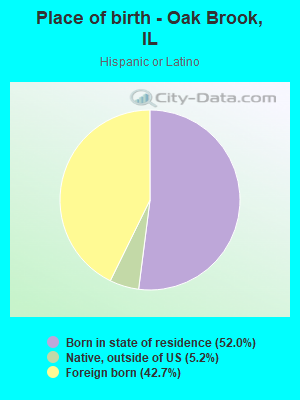
Place of birth - Born in state of residence (%) - Hispanic or Latino
Place of birth - Born in state of residence (%) - American Indian and Alaska Native
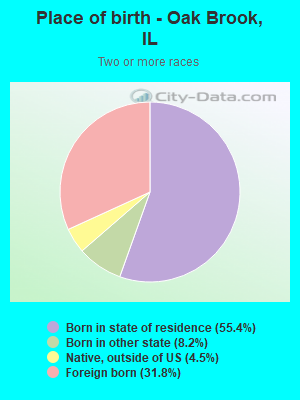
Place of birth - Born in state of residence (%) - Multirace
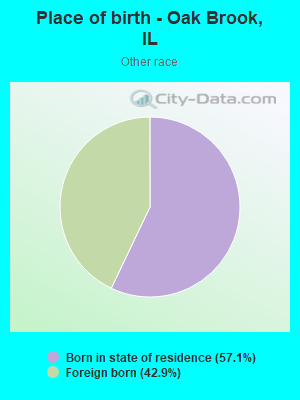
Place of birth - Born in state of residence (%) - Other Race
Place of birth - Born in other state (%)
Place of birth - Born in other state (%) - White
Place of birth - Born in other state (%) - Black or African American
Place of birth - Born in other state (%) - Asian
Place of birth - Born in other state (%) - Hispanic or Latino
Place of birth - Born in other state (%) - American Indian and Alaska Native
Place of birth - Born in other state (%) - Multirace
Place of birth - Born in other state (%) - Other Race
Place of birth - Native, outside of US (%)
Place of birth - Native, outside of US (%) - White
Place of birth - Native, outside of US (%) - Black or African American
Place of birth - Native, outside of US (%) - Asian
Place of birth - Native, outside of US (%) - Hispanic or Latino
Place of birth - Native, outside of US (%) - American Indian and Alaska Native
Place of birth - Native, outside of US (%) - Multirace
Place of birth - Native, outside of US (%) - Other Race
Place of birth - Foreign born (%)
Place of birth - Foreign born (%) - White
Place of birth - Foreign born (%) - Black or African American
Place of birth - Foreign born (%) - Asian
Place of birth - Foreign born (%) - Hispanic or Latino
Place of birth - Foreign born (%) - American Indian and Alaska Native
Place of birth - Foreign born (%) - Multirace
Place of birth - Foreign born (%) - Other Race
Residents speaking English at home (%)
Residents speaking English at home - Born in the United States (%)
Residents speaking English at home - Native, born elsewhere (%)
Residents speaking English at home - Foreign born (%)
Residents speaking Spanish at home (%)
Residents speaking Spanish at home - Born in the United States (%)
Residents speaking Spanish at home - Native, born elsewhere (%)
Residents speaking Spanish at home - Foreign born (%)
Residents speaking other language at home (%)
Residents speaking other language at home - Born in the United States (%)
Residents speaking other language at home - Native, born elsewhere (%)
Residents speaking other language at home - Foreign born (%)
Marital status - Never married (%)
Marital status - Now married (%)
Marital status - Separated (%)
Marital status - Widowed (%)
Marital status - Divorced (%)
Ancestries Reported - Arab (%)
Ancestries Reported - Czech (%)
Ancestries Reported - Danish (%)
Ancestries Reported - Dutch (%)
Ancestries Reported - English (%)
Ancestries Reported - French (%)
Ancestries Reported - French Canadian (%)
Ancestries Reported - German (%)
Ancestries Reported - Greek (%)
Ancestries Reported - Hungarian (%)
Ancestries Reported - Irish (%)
Ancestries Reported - Italian (%)
Ancestries Reported - Lithuanian (%)
Ancestries Reported - Norwegian (%)
Ancestries Reported - Polish (%)
Ancestries Reported - Portuguese (%)
Ancestries Reported - Russian (%)
Ancestries Reported - Scotch-Irish (%)
Ancestries Reported - Scottish (%)
Ancestries Reported - Slovak (%)
Ancestries Reported - Subsaharan African (%)
Ancestries Reported - Swedish (%)
Ancestries Reported - Swiss (%)
Ancestries Reported - Ukrainian (%)
Ancestries Reported - United States (%)
Ancestries Reported - Welsh (%)
Ancestries Reported - West Indian (%)
Ancestries Reported - Other (%)
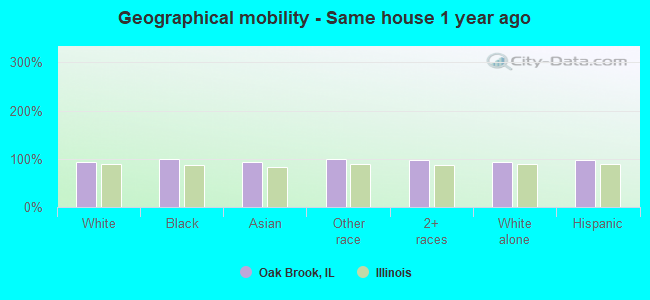
Geographical mobility - Same house 1 year ago (%)
Geographical mobility - Same house 1 year ago (%) - White
Geographical mobility - Same house 1 year ago (%) - Black or African American
Geographical mobility - Same house 1 year ago (%) - Asian
Geographical mobility - Same house 1 year ago (%) - Hispanic or Latino
Geographical mobility - Same house 1 year ago (%) - American Indian and Alaska Native
Geographical mobility - Same house 1 year ago (%) - Multirace
Geographical mobility - Same house 1 year ago (%) - Other Race
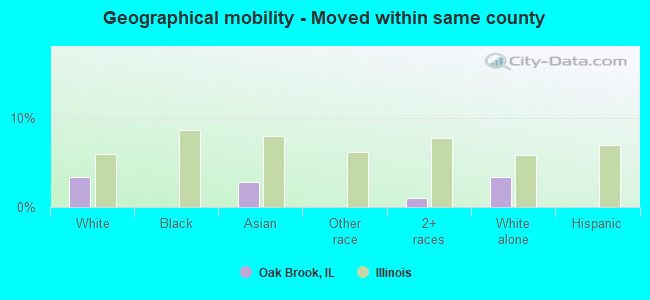
Geographical mobility - Moved within same county (%)
Geographical mobility - Moved within same county (%) - White
Geographical mobility - Moved within same county (%) - Black or African American
Geographical mobility - Moved within same county (%) - Asian
Geographical mobility - Moved within same county (%) - Hispanic or Latino
Geographical mobility - Moved within same county (%) - American Indian and Alaska Native
Geographical mobility - Moved within same county (%) - Multirace
Geographical mobility - Moved within same county (%) - Other Race
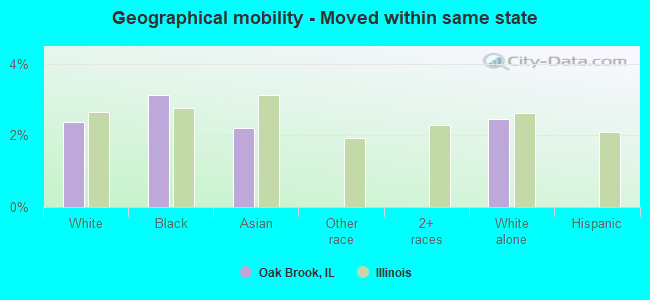
Geographical mobility - Moved from different county within same state (%)
Geographical mobility - Moved from different county within same state (%) - White
Geographical mobility - Moved from different county within same state (%) - Black or African American
Geographical mobility - Moved from different county within same state (%) - Asian
Geographical mobility - Moved from different county within same state (%) - Hispanic or Latino
Geographical mobility - Moved from different county within same state (%) - American Indian and Alaska Native
Geographical mobility - Moved from different county within same state (%) - Multirace
Geographical mobility - Moved from different county within same state (%) - Other Race
Geographical mobility - Moved from different state (%)
Geographical mobility - Moved from different state (%) - White
Geographical mobility - Moved from different state (%) - Black or African American
Geographical mobility - Moved from different state (%) - Asian
Geographical mobility - Moved from different state (%) - Hispanic or Latino
Geographical mobility - Moved from different state (%) - American Indian and Alaska Native
Geographical mobility - Moved from different state (%) - Multirace
Geographical mobility - Moved from different state (%) - Other Race
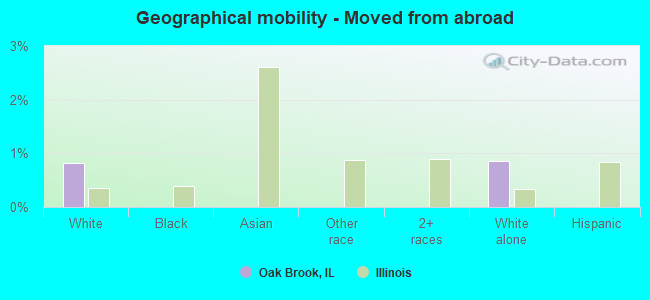
Geographical mobility - Moved from abroad (%)
Geographical mobility - Moved from abroad (%) - White
Geographical mobility - Moved from abroad (%) - Black or African American
Geographical mobility - Moved from abroad (%) - Asian
Geographical mobility - Moved from abroad (%) - Hispanic or Latino
Geographical mobility - Moved from abroad (%) - American Indian and Alaska Native
Geographical mobility - Moved from abroad (%) - Multirace
Geographical mobility - Moved from abroad (%) - Other Race
Place of birth for the foreign-born population - Ireland (%)
Place of birth for the foreign-born population - Denmark (%)
Place of birth for the foreign-born population - Norway (%)
Place of birth for the foreign-born population - Sweden (%)
Place of birth for the foreign-born population - United Kingdom (%)
Place of birth for the foreign-born population - England (%)
Place of birth for the foreign-born population - Scotland (%)
Place of birth for the foreign-born population - Other Northern Europe (%)
Place of birth for the foreign-born population - Austria (%)
Place of birth for the foreign-born population - Belgium (%)
Place of birth for the foreign-born population - France (%)
Place of birth for the foreign-born population - Germany (%)
Place of birth for the foreign-born population - Netherlands (%)
Place of birth for the foreign-born population - Switzerland (%)
Place of birth for the foreign-born population - Other Western Europe (%)
Place of birth for the foreign-born population - Greece (%)
Place of birth for the foreign-born population - Italy (%)
Place of birth for the foreign-born population - Portugal (%)
Place of birth for the foreign-born population - Spain (%)
Place of birth for the foreign-born population - Other Southern Europe (%)
Place of birth for the foreign-born population - Albania (%)
Place of birth for the foreign-born population - Belarus (%)
Place of birth for the foreign-born population - Bosnia and Herzegovina (%)
Place of birth for the foreign-born population - Bulgaria (%)
Place of birth for the foreign-born population - Croatia (%)
Place of birth for the foreign-born population - Czechoslovakia (%)
Place of birth for the foreign-born population - Hungary (%)
Place of birth for the foreign-born population - Latvia (%)
Place of birth for the foreign-born population - Lithuania (%)
Place of birth for the foreign-born population - North Macedonia (Macedonia) (%)
Place of birth for the foreign-born population - Moldova (%)
Place of birth for the foreign-born population - Poland (%)
Place of birth for the foreign-born population - Romania (%)
Place of birth for the foreign-born population - Russia (%)
Place of birth for the foreign-born population - Serbia (%)
Place of birth for the foreign-born population - Ukraine (%)
Place of birth for the foreign-born population - Other Eastern Europe (%)
Place of birth for the foreign-born population - China (%)
Place of birth for the foreign-born population - Hong Kong (%)
Place of birth for the foreign-born population - Taiwan (%)
Place of birth for the foreign-born population - Japan (%)
Place of birth for the foreign-born population - Korea (%)
Place of birth for the foreign-born population - Other Eastern Asia (%)
Place of birth for the foreign-born population - Afghanistan (%)
Place of birth for the foreign-born population - Bangladesh (%)
Place of birth for the foreign-born population - India (%)
Place of birth for the foreign-born population - Iran (%)
Place of birth for the foreign-born population - Kazakhstan (%)
Place of birth for the foreign-born population - Nepal (%)
Place of birth for the foreign-born population - Pakistan (%)
Place of birth for the foreign-born population - Sri Lanka (%)
Place of birth for the foreign-born population - Uzbekistan (%)
Place of birth for the foreign-born population - Other South Central Asia (%)
Place of birth for the foreign-born population - Burma (%)
Place of birth for the foreign-born population - Cambodia (%)
Place of birth for the foreign-born population - Indonesia (%)
Place of birth for the foreign-born population - Laos (%)
Place of birth for the foreign-born population - Malaysia (%)
Place of birth for the foreign-born population - Philippines (%)
Place of birth for the foreign-born population - Singapore (%)
Place of birth for the foreign-born population - Thailand (%)
Place of birth for the foreign-born population - Vietnam (%)
Place of birth for the foreign-born population - Other South Eastern Asia (%)
Place of birth for the foreign-born population - Armenia (%)
Place of birth for the foreign-born population - Iraq (%)
Place of birth for the foreign-born population - Israel (%)
Place of birth for the foreign-born population - Jordan (%)
Place of birth for the foreign-born population - Kuwait (%)
Place of birth for the foreign-born population - Lebanon (%)
Place of birth for the foreign-born population - Saudi Arabia (%)
Place of birth for the foreign-born population - Syria (%)
Place of birth for the foreign-born population - Turkey (%)
Place of birth for the foreign-born population - Yemen (%)
Place of birth for the foreign-born population - Other Western Asia (%)
Place of birth for the foreign-born population - Eritrea (%)
Place of birth for the foreign-born population - Ethiopia (%)
Place of birth for the foreign-born population - Kenya (%)
Place of birth for the foreign-born population - Somalia (%)
Place of birth for the foreign-born population - Uganda (%)
Place of birth for the foreign-born population - Zimbabwe (%)
Place of birth for the foreign-born population - Other Eastern Africa (%)
Place of birth for the foreign-born population - Cameroon (%)
Place of birth for the foreign-born population - Congo (%)
Place of birth for the foreign-born population - Democratic Republic of Congo (Zaire) (%)
Place of birth for the foreign-born population - Other Middle Africa (%)
Place of birth for the foreign-born population - Egypt (%)
Place of birth for the foreign-born population - Morocco (%)
Place of birth for the foreign-born population - Sudan (%)
Place of birth for the foreign-born population - Other Northern Africa (%)
Place of birth for the foreign-born population - South Africa (%)
Place of birth for the foreign-born population - Other Southern Africa (%)
Place of birth for the foreign-born population - Cabo Verde (%)
Place of birth for the foreign-born population - Ghana (%)
Place of birth for the foreign-born population - Liberia (%)
Place of birth for the foreign-born population - Nigeria (%)
Place of birth for the foreign-born population - Senegal (%)
Place of birth for the foreign-born population - Sierra Leone (%)
Place of birth for the foreign-born population - Other Western Africa (%)
Place of birth for the foreign-born population - Australia (%)
Place of birth for the foreign-born population - New Zealand (%)
Place of birth for the foreign-born population - Fiji (%)
Place of birth for the foreign-born population - Micronesia (%)
Place of birth for the foreign-born population - Bahamas (%)
Place of birth for the foreign-born population - Barbados (%)
Place of birth for the foreign-born population - Cuba (%)
Place of birth for the foreign-born population - Dominica (%)
Place of birth for the foreign-born population - Dominican Republic (%)
Place of birth for the foreign-born population - Grenada (%)
Place of birth for the foreign-born population - Haiti (%)
Place of birth for the foreign-born population - Jamaica (%)
Place of birth for the foreign-born population - St. Vincent and the Grenadines (%)
Place of birth for the foreign-born population - Trinidad and Tobago (%)
Place of birth for the foreign-born population - West Indies (%)
Place of birth for the foreign-born population - Other Caribbean (%)
Place of birth for the foreign-born population - Belize (%)
Place of birth for the foreign-born population - Costa Rica (%)
Place of birth for the foreign-born population - El Salvador (%)
Place of birth for the foreign-born population - Guatemala (%)
Place of birth for the foreign-born population - Honduras (%)
Place of birth for the foreign-born population - Mexico (%)
Place of birth for the foreign-born population - Nicaragua (%)
Place of birth for the foreign-born population - Panama (%)
Place of birth for the foreign-born population - Other Central America (%)
Place of birth for the foreign-born population - Argentina (%)
Place of birth for the foreign-born population - Bolivia (%)
Place of birth for the foreign-born population - Brazil (%)
Place of birth for the foreign-born population - Chile (%)
Place of birth for the foreign-born population - Colombia (%)
Place of birth for the foreign-born population - Ecuador (%)
Place of birth for the foreign-born population - Guyana (%)
Place of birth for the foreign-born population - Peru (%)
Place of birth for the foreign-born population - Uruguay (%)
Place of birth for the foreign-born population - Venezuela (%)
Place of birth for the foreign-born population - Other South America (%)
Place of birth for the foreign-born population - Canada (%)
Place of birth for the foreign-born population - Other Northern America (%)
Place of birth for the foreign-born population - Other (%)
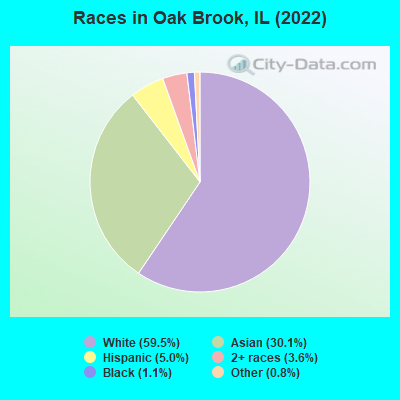
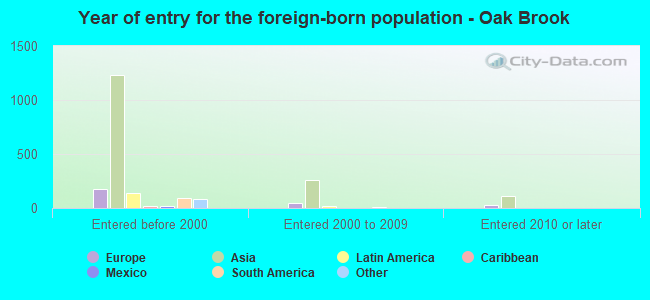
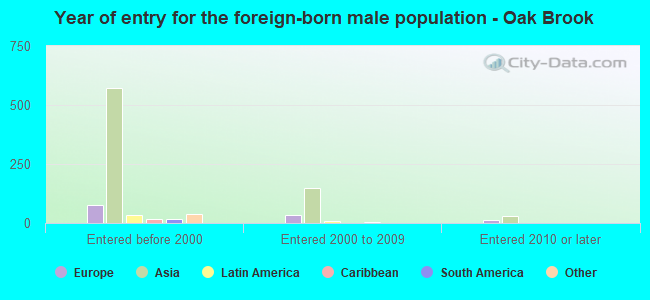
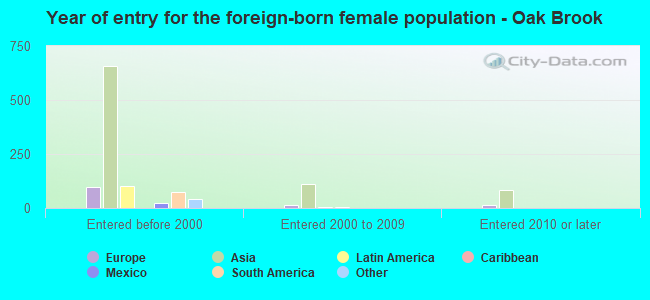
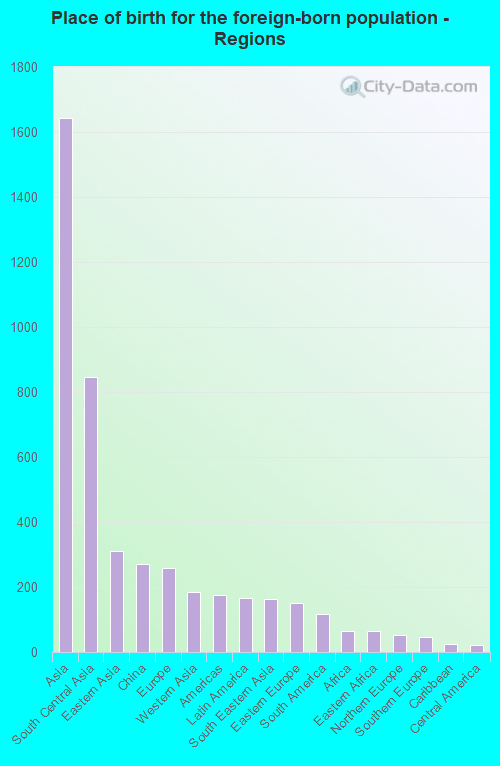
According to 2022 data, the most numerous races in Oak Brook, IL are White alone (4,752 residents), Hispanic (401 residents), and Black alone (86 residents). 65.1% of Oak Brook residents speak English at home. 26.9% of Oak Brook, IL residents are foreign-born (20.3% born in Asia, 3.2% born in Europe), which is 47.9% greater than the foreign-born rate of 14.0% across the entire state of Illinois.
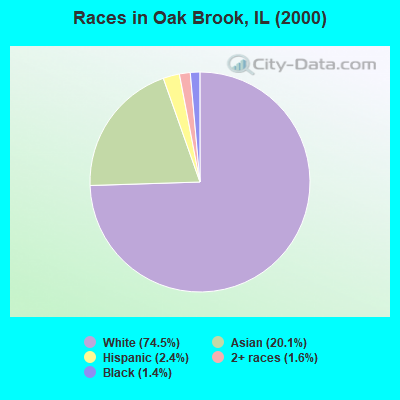
Race distribution in Oak Brook
2000 2022
8,424,140 67.8% White alone 1,856,152 14.9% Black alone 1,530,262 12.3% Hispanic 419,916 3.4% Asian alone 153,996 1.2% Two or more races 13,479 0.1% Other race alone 18,232 0.1% American Indian alone 3,116 0.03% Native Hawaiian and Other
7,356,301 58.5% White alone 2,299,726 18.3% Hispanic 1,660,423 13.2% Black alone 747,296 5.9% Asian alone 458,599 3.6% Two or more races 45,386 0.4% Other race alone 10,405 0.08% American Indian alone 3,896 0.03% Native Hawaiian and Other
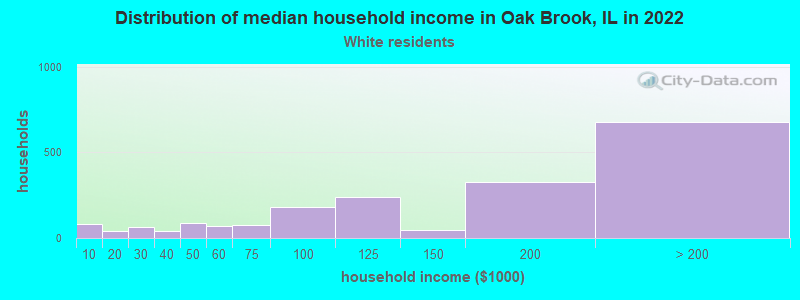
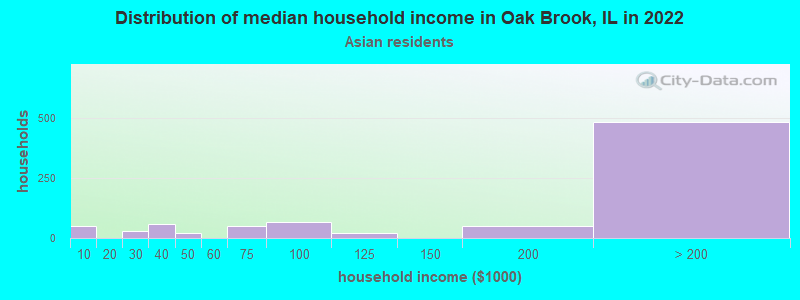
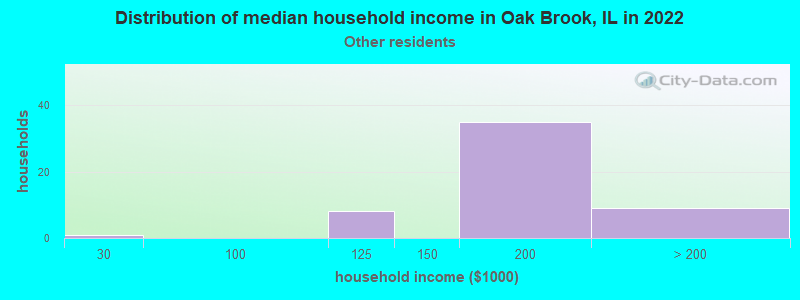
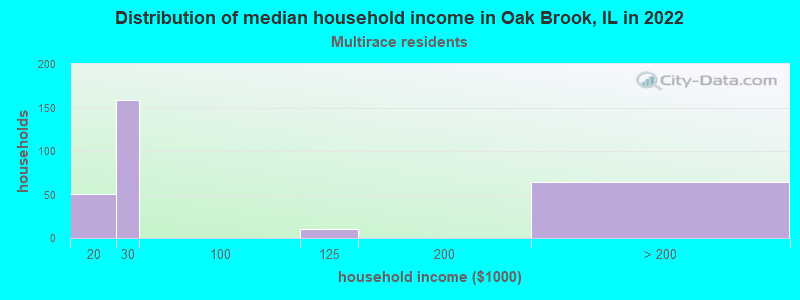
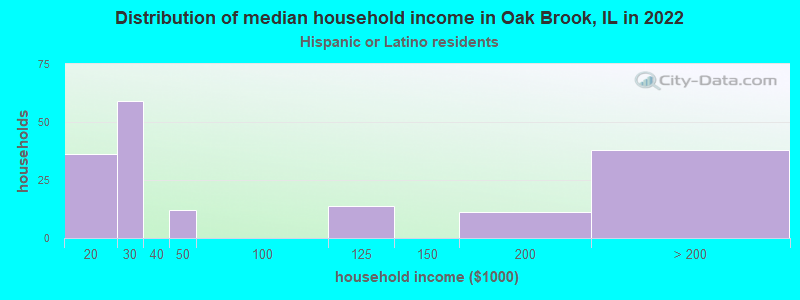
Income and house value in Oak Brook Median household income in 2022 $149,172 White non-Hispanic householdersover $200,000 Asian householders$148,383 Some other race householdersMedian 2022 house value $860,516 White Non-Hispanic householders$637,209 Black or African American householders over $1,000,000 Asian householdersover $1,000,000 Two or more races householders$566,408 Hispanic or Latino householders
Median age by race in Oak Brook
59.8 Median age for White residents59.3 60.4 7.7 Median age for Black or African American residents-684,095,859.9 23.4 -699,421,964.6 Median age for American Indian / Alaska Native residents-721,943,047.9 -545,253,862.6 46.3 Median age for Asian residents45.7 46.2 -593,236,714.4 Median age for Native Hawaiian / Pacific Islander residents-658,536,584.7 -576,015,108.0 65.8 Median age for Other race residents74.2 67.9 34.3 Median age for Two or more races residents24.4 39.4 58.7 Median age for White alone residents58.6 59.7 49.7 Median age for Hispanic or Latino residents35.2 54.2
Owner/renter occupied households by race in Oak Brook
House owners and renters - White residents 1,955 97.2% Owner occupied56 2.8% Renter occupiedHouse owners and renters - Black or African American residents 24 100.0% Owner occupiedHouse owners and renters - Asian residents 768 95.0% Owner occupied40 5.0% Renter occupiedHouse owners and renters - Other race residents 51 100.0% Owner occupiedHouse owners and renters - Two or more races residents 179 82.9% Owner occupied37 17.1% Renter occupiedHouse owners and renters - White alone residents 1,975 97.9% Owner occupied42 2.1% Renter occupiedHouse owners and renters - Hispanic or Latino residents 137 75.3% Owner occupied45 24.7% Renter occupied
Language usage in Oak Brook
English speakers - Total 65.1% of residents of Oak Brook speak English at home.
3.7% of residents speak Spanish at home 223 79.1% Speak English very well59 20.9% Speak English less than very well30.3% of residents speak other language at home 2,013 86.5% Speak English very well315 13.5% Speak English less than very well
English speakers - Born in the United States 78.6% of residents of Oak Brook speak English at home.
1.6% of residents speak Spanish at home 18 100.0% Speak English very well23.0% of residents speak other language at home 235 92.9% Speak English very well18 7.1% Speak English less than very well
English speakers - Native, born elsewhere 80.0% of residents of Oak Brook speak English at home.
9.5% of residents speak Spanish at home 10 100.0% Speak English less than very well10.5% of residents speak other language at home 11 100.0% Speak English very well
English speakers - Foreign-born 21.0% of residents of Oak Brook speak English at home.
7.4% of residents speak Spanish at home 123 77.4% Speak English very well36 22.6% Speak English less than very well68.9% of residents speak other language at home 1,216 82.7% Speak English very well255 17.3% Speak English less than very well
White (Caucasian) - Speak only English Native:
87.4% (3,383)Foreign-born:
21.8% (133)
White (Caucasian) - Speak another language Native:
10.7% (416)Foreign-born:
78.7% (479)
Asian - Speak only English Native:
66.6% (696)Foreign-born:
24.5% (304)
Asian - Speak another language Native:
35.0% (366)Foreign-born:
73.0% (906)
Other race - Speak another language Native:
23.7% (11)Foreign-born:
100.0% (36)
Two or more races - Speak another language Native:
5.7% (25)Foreign-born:
100.0% (211)
White alone - Speak only English Native:
86.6% (3,395)Foreign-born:
21.5% (147)
White alone - Speak another language Native:
12.7% (497)Foreign-born:
78.6% (536)
Hispanic or Latino - Speak another language Native:
28.8% (67)Foreign-born:
100.0% (173)
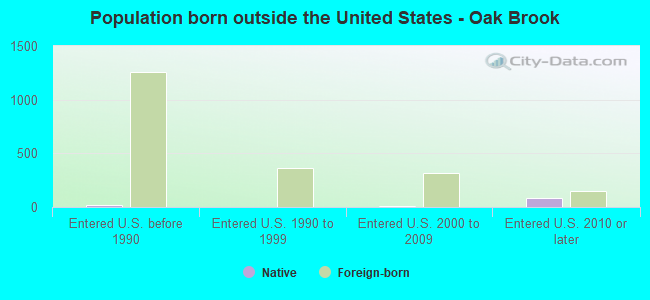
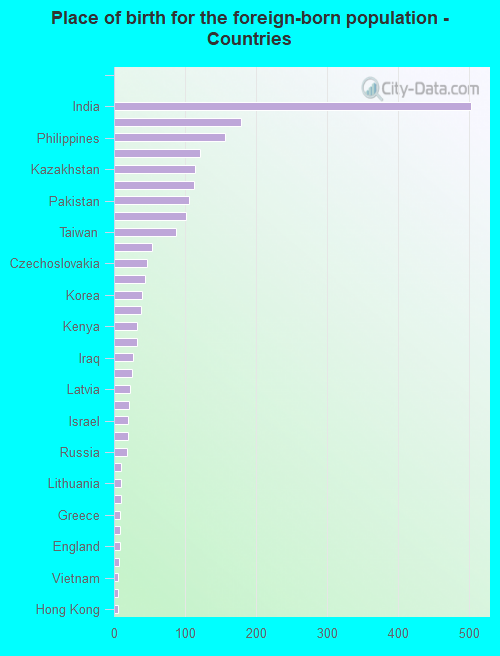
Foreign-born residents in Oak Brook 2,144 residents are foreign born (20.3% Asia , 3.2% Europe ).
This city:
26.9%Illinois:
14.1%
Marital status for residents in Oak Brook Marital status - White (Caucasian) population 15 years and over
Males 22.6% Never married56.2% Now married0.3% Separated12.2% Widowed8.6% DivorcedFemales 17.0% Never married58.3% Now married0.3% Separated19.2% Widowed5.1% DivorcedWomen who gave birth in the past 12 months Now married:
100.0% (39)Unmarried:
0.0% (0)
Women who did not give birth in the past 12 months Now married:
46.8% (247)Unmarried:
53.2% (280)
Marital status - Black or African American population 15 years and over
Males 0.0% Never married100.0% Now married0.0% Separated0.0% Widowed0.0% DivorcedFemales 0.0% Never married58.3% Now married0.0% Separated41.7% Widowed0.0% DivorcedWomen who did not give birth in the past 12 months Now married:
100.0% (11)Unmarried:
0.0% (0)
Marital status - Asian population 15 years and over
Males 25.5% Never married71.7% Now married0.0% Separated2.8% Widowed0.0% DivorcedFemales 22.5% Never married55.8% Now married6.8% Separated8.2% Widowed6.8% DivorcedWomen who gave birth in the past 12 months Now married:
100.0% (46)Unmarried:
0.0% (0)
Women who did not give birth in the past 12 months Now married:
43.9% (208)Unmarried:
56.1% (266)
Marital status - Other race population 15 years and over
Males 0.0% Never married100.0% Now married0.0% Separated0.0% Widowed0.0% DivorcedFemales 21.2% Never married75.8% Now married0.0% Separated0.0% Widowed3.0% DivorcedWomen who did not give birth in the past 12 months Now married:
0.0% (0)Unmarried:
100.0% (10)
Marital status - Two or more races population 15 years and over
Males 47.6% Never married44.8% Now married0.0% Separated7.6% Widowed0.0% DivorcedFemales 14.0% Never married33.2% Now married0.0% Separated52.8% Widowed0.0% DivorcedWomen who did not give birth in the past 12 months Now married:
37.3% (40)Unmarried:
62.7% (67)
Marital status - White alone, not Hispanic / Latino population 15 years and over
Males 22.7% Never married55.6% Now married0.3% Separated12.5% Widowed8.8% DivorcedFemales 16.9% Never married58.3% Now married0.3% Separated19.7% Widowed4.8% DivorcedWomen who gave birth in the past 12 months Now married:
100.0% (35)Unmarried:
0.0% (0)
Women who did not give birth in the past 12 months Now married:
46.8% (254)Unmarried:
53.2% (289)
Marital status - Hispanic or Latino population 15 years and over
Males 35.8% Never married56.6% Now married0.0% Separated7.5% Widowed0.0% DivorcedFemales 13.5% Never married28.0% Now married0.0% Separated52.8% Widowed5.7% DivorcedWomen who gave birth in the past 12 months Now married:
100.0% (7)Unmarried:
0.0% (0)
Women who did not give birth in the past 12 months Now married:
17.9% (10)Unmarried:
82.1% (48)
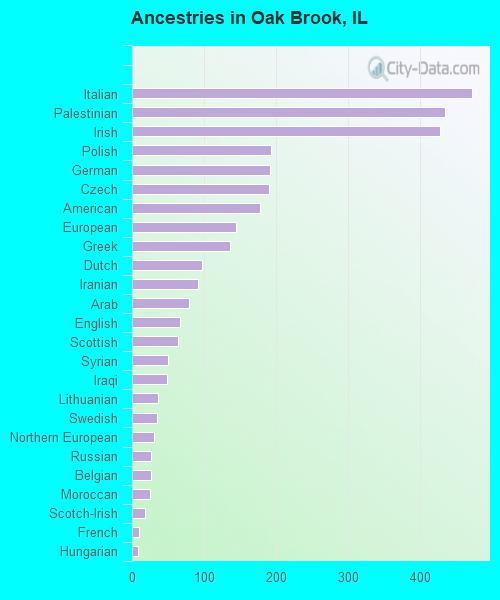
Ancestries in Oak Brook
472 9.4% Italian435 8.6% Palestinian428 8.5% Irish193 3.8% Polish191 3.8% German190 3.8% Czech178 3.5% American145 2.9% European136 2.7% Greek97 1.9% Dutch92 1.8% Iranian79 1.6% Arab67 1.3% English64 1.3% Scottish50 1.0% Syrian49 1.0% Iraqi36 0.7% Lithuanian35 0.7% Swedish31 0.6% Northern European27 0.5% Russian26 0.5% Belgian25 0.5% Moroccan18 0.4% Scotch-Irish10 0.2% French9 0.2% Hungarian8 0.2% Eastern European7 0.1% Norwegian7 0.1% Yugoslavian6 0.1% Austrian
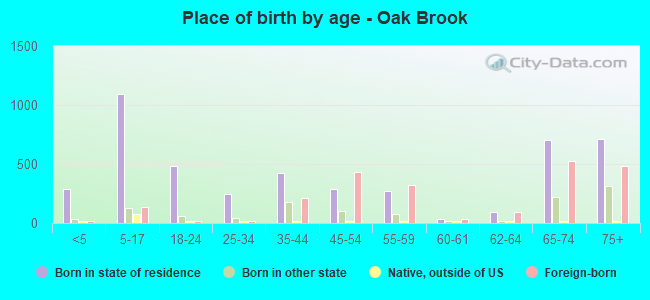
Children Nativity (place of birth) in Oak Brook
Children under 6 years - Living with two parents Both parents native 257 100.0% NativeOne native, one foreign-born parent 161 100.0% NativeChildren under 6 years - Living with one parent Native parent 0 29.5% NativeForeign-born parent 5 100.0% NativeChildren 6 to 17 years - Living with two parents Both parents native 573 100.0% NativeBoth parents foreign-born 232 88.8% Native29 11.2% Foreign-bornOne native, one foreign-born parent 206 100.0% NativeChildren 6 to 17 years - Living with one parent Native parent 105 100.0% NativeForeign-born parent 69 48.1% Native74 51.9% Foreign-born
Grandparents responsible for own grandchildren in Oak Brook
Grandparents (30 to 59 years) White / Caucasian 11 100.0% Responsible for grandchildrenAsian 4 100.0% Responsible for grandchildrenWhite alone, not Hispanic / Latino 12 100.0% Responsible for grandchildrenGrandparents (60 years and over) White / Caucasian 10 100.0% Not responsible for grandchildrenAsian 6 7.5% Responsible for grandchildren80 92.5% Not responsible for grandchildrenWhite alone, not Hispanic / Latino 10 100.0% Not responsible for grandchildren