Races in Oak Ridge, Georgia (GA) Detailed Stats
Ancestries, Foreign-born residents, place of birth
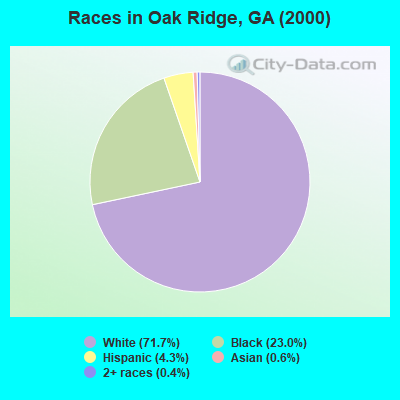
Race distribution in Oak Ridge

- 2,59171.7%White alone
- 83223.0%Black alone
- 1554.3%Hispanic
- 200.6%Asian alone
- 160.4%Two or more races
- 10.03%American Indian alone
- 10.03%Native Hawaiian and Other
Pacific Islander alone
2000
2022
-
- 5,128,66162.6%White alone
- 2,331,46528.5%Black alone
- 435,2275.3%Hispanic
- 171,5132.1%Asian alone
- 87,3641.1%Two or more races
- 17,6700.2%American Indian alone
- 11,2750.1%Other race alone
- 3,2780.04%Native Hawaiian and Other
Pacific Islander alone

-
- 5,415,65749.6%White alone
- 3,349,24030.7%Black alone
- 1,132,60410.4%Hispanic
- 479,1564.4%Asian alone
- 462,9234.2%Two or more races
- 54,4160.5%Other race alone
- 11,9230.1%American Indian alone
- 6,9570.06%Native Hawaiian and Other
Pacific Islander alone

Income and house value in Oak Ridge
- Median household income in 2022
- $61,019White non-Hispanic householders
- $73,428Black householders
- $29,791Asian householders
- $64,937Some other race householders
- $64,953Two or more races householders
- $60,696Hispanic or Latino race householders
- Median 2022 house value
- $218,605White Non-Hispanic householders
- $179,043Black or African American householders
- $215,562Two or more races householders
Household income for White non-Hispanic householders

Household income for Black householders

Household income for Asian householders

Household income for Two or more races householders

Household income for Hispanic or Latino race householders

Zip code: 31794