Races in Oakland, New Jersey (NJ) Detailed Stats
Data:
Races - White alone (%)
Races - White alone (% change since 2000)
Races - Black alone (%)
Races - Black alone (% change since 2000)
Races - American Indian alone (%)
Races - American Indian alone (% change since 2000)
Races - Asian alone (%)
Races - Asian alone (% change since 2000)
Races - Hispanic (%)
Races - Hispanic (% change since 2000)
Races - Native Hawaiian and Other Pacific Islander alone (%)
Races - Native Hawaiian and Other Pacific Islander alone (% change since 2000)
Races - Two or more races(%)
Races - Two or more races(% change since 2000)
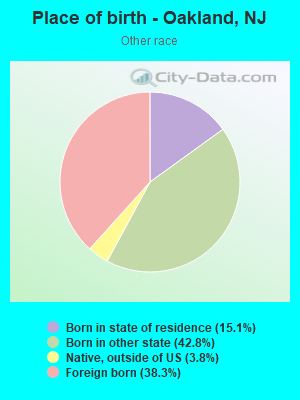
Races - Other race alone (%)
Races - Other race alone (% change since 2000)
Racial diversity
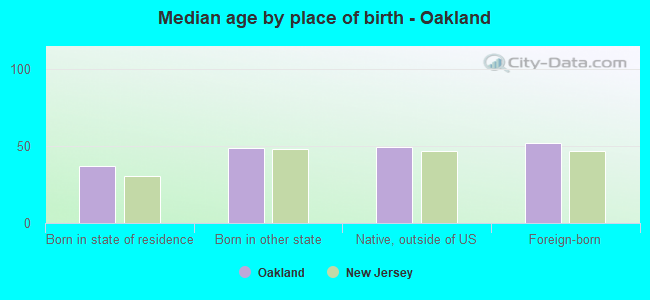
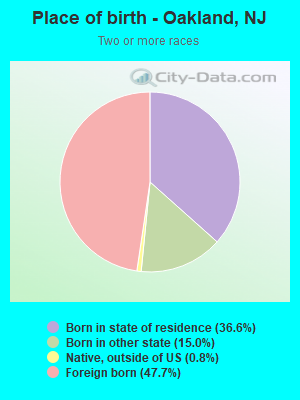
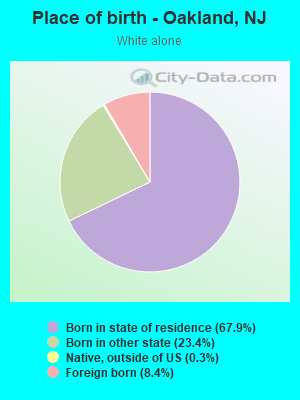
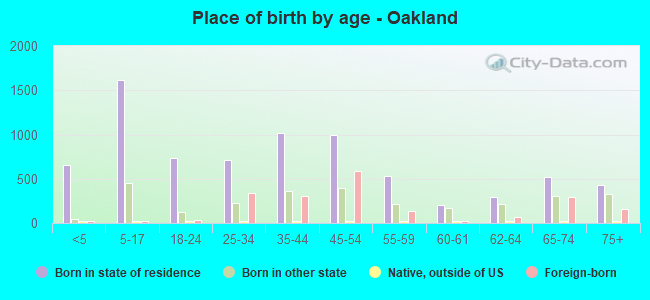
Place of birth - Born in state of residence (%)
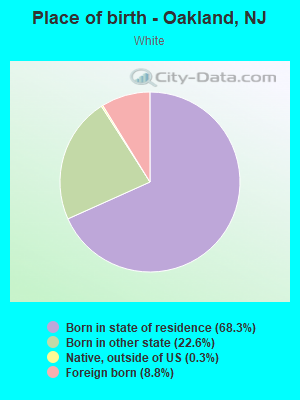
Place of birth - Born in state of residence (%) - White
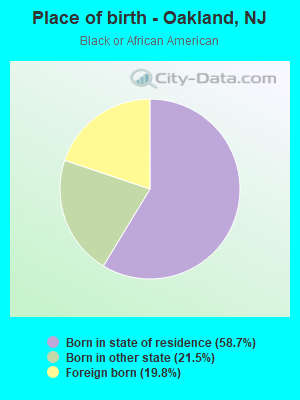
Place of birth - Born in state of residence (%) - Black or African American
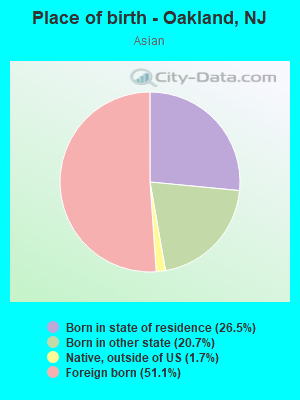
Place of birth - Born in state of residence (%) - Asian
Place of birth - Born in state of residence (%) - Hispanic or Latino
Place of birth - Born in state of residence (%) - American Indian and Alaska Native
Place of birth - Born in state of residence (%) - Multirace
Place of birth - Born in state of residence (%) - Other Race
Place of birth - Born in other state (%)
Place of birth - Born in other state (%) - White
Place of birth - Born in other state (%) - Black or African American
Place of birth - Born in other state (%) - Asian
Place of birth - Born in other state (%) - Hispanic or Latino
Place of birth - Born in other state (%) - American Indian and Alaska Native
Place of birth - Born in other state (%) - Multirace
Place of birth - Born in other state (%) - Other Race
Place of birth - Native, outside of US (%)
Place of birth - Native, outside of US (%) - White
Place of birth - Native, outside of US (%) - Black or African American
Place of birth - Native, outside of US (%) - Asian
Place of birth - Native, outside of US (%) - Hispanic or Latino
Place of birth - Native, outside of US (%) - American Indian and Alaska Native
Place of birth - Native, outside of US (%) - Multirace
Place of birth - Native, outside of US (%) - Other Race
Place of birth - Foreign born (%)
Place of birth - Foreign born (%) - White
Place of birth - Foreign born (%) - Black or African American
Place of birth - Foreign born (%) - Asian
Place of birth - Foreign born (%) - Hispanic or Latino
Place of birth - Foreign born (%) - American Indian and Alaska Native
Place of birth - Foreign born (%) - Multirace
Place of birth - Foreign born (%) - Other Race
Residents speaking English at home (%)
Residents speaking English at home - Born in the United States (%)
Residents speaking English at home - Native, born elsewhere (%)
Residents speaking English at home - Foreign born (%)
Residents speaking Spanish at home (%)
Residents speaking Spanish at home - Born in the United States (%)
Residents speaking Spanish at home - Native, born elsewhere (%)
Residents speaking Spanish at home - Foreign born (%)
Residents speaking other language at home (%)
Residents speaking other language at home - Born in the United States (%)
Residents speaking other language at home - Native, born elsewhere (%)
Residents speaking other language at home - Foreign born (%)
Marital status - Never married (%)
Marital status - Now married (%)
Marital status - Separated (%)
Marital status - Widowed (%)
Marital status - Divorced (%)
Ancestries Reported - Arab (%)
Ancestries Reported - Czech (%)
Ancestries Reported - Danish (%)
Ancestries Reported - Dutch (%)
Ancestries Reported - English (%)
Ancestries Reported - French (%)
Ancestries Reported - French Canadian (%)
Ancestries Reported - German (%)
Ancestries Reported - Greek (%)
Ancestries Reported - Hungarian (%)
Ancestries Reported - Irish (%)
Ancestries Reported - Italian (%)
Ancestries Reported - Lithuanian (%)
Ancestries Reported - Norwegian (%)
Ancestries Reported - Polish (%)
Ancestries Reported - Portuguese (%)
Ancestries Reported - Russian (%)
Ancestries Reported - Scotch-Irish (%)
Ancestries Reported - Scottish (%)
Ancestries Reported - Slovak (%)
Ancestries Reported - Subsaharan African (%)
Ancestries Reported - Swedish (%)
Ancestries Reported - Swiss (%)
Ancestries Reported - Ukrainian (%)
Ancestries Reported - United States (%)
Ancestries Reported - Welsh (%)
Ancestries Reported - West Indian (%)
Ancestries Reported - Other (%)
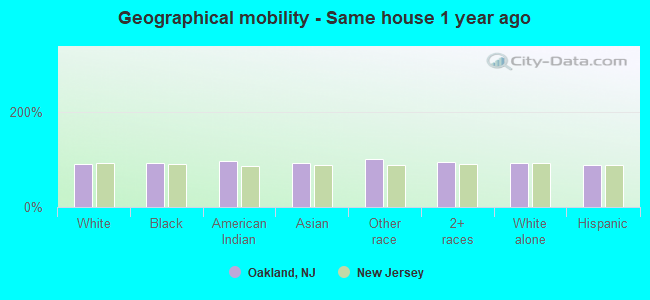
Geographical mobility - Same house 1 year ago (%)
Geographical mobility - Same house 1 year ago (%) - White
Geographical mobility - Same house 1 year ago (%) - Black or African American
Geographical mobility - Same house 1 year ago (%) - Asian
Geographical mobility - Same house 1 year ago (%) - Hispanic or Latino
Geographical mobility - Same house 1 year ago (%) - American Indian and Alaska Native
Geographical mobility - Same house 1 year ago (%) - Multirace
Geographical mobility - Same house 1 year ago (%) - Other Race
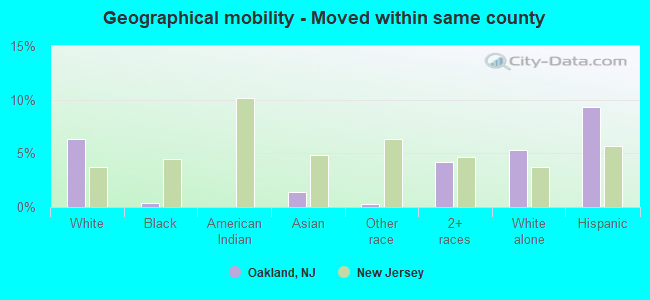
Geographical mobility - Moved within same county (%)
Geographical mobility - Moved within same county (%) - White
Geographical mobility - Moved within same county (%) - Black or African American
Geographical mobility - Moved within same county (%) - Asian
Geographical mobility - Moved within same county (%) - Hispanic or Latino
Geographical mobility - Moved within same county (%) - American Indian and Alaska Native
Geographical mobility - Moved within same county (%) - Multirace
Geographical mobility - Moved within same county (%) - Other Race
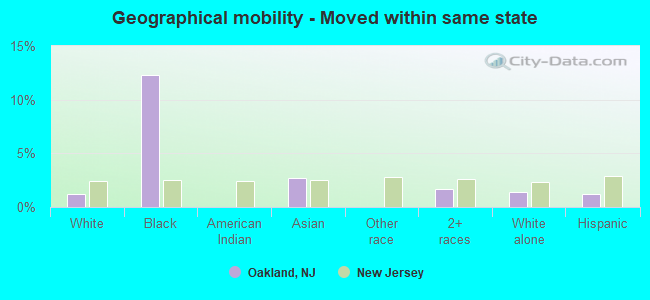
Geographical mobility - Moved from different county within same state (%)
Geographical mobility - Moved from different county within same state (%) - White
Geographical mobility - Moved from different county within same state (%) - Black or African American
Geographical mobility - Moved from different county within same state (%) - Asian
Geographical mobility - Moved from different county within same state (%) - Hispanic or Latino
Geographical mobility - Moved from different county within same state (%) - American Indian and Alaska Native
Geographical mobility - Moved from different county within same state (%) - Multirace
Geographical mobility - Moved from different county within same state (%) - Other Race
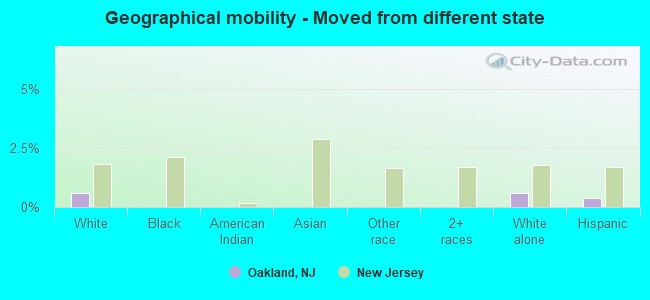
Geographical mobility - Moved from different state (%)
Geographical mobility - Moved from different state (%) - White
Geographical mobility - Moved from different state (%) - Black or African American
Geographical mobility - Moved from different state (%) - Asian
Geographical mobility - Moved from different state (%) - Hispanic or Latino
Geographical mobility - Moved from different state (%) - American Indian and Alaska Native
Geographical mobility - Moved from different state (%) - Multirace
Geographical mobility - Moved from different state (%) - Other Race
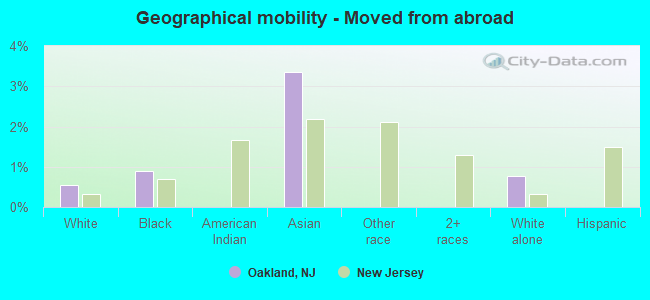
Geographical mobility - Moved from abroad (%)
Geographical mobility - Moved from abroad (%) - White
Geographical mobility - Moved from abroad (%) - Black or African American
Geographical mobility - Moved from abroad (%) - Asian
Geographical mobility - Moved from abroad (%) - Hispanic or Latino
Geographical mobility - Moved from abroad (%) - American Indian and Alaska Native
Geographical mobility - Moved from abroad (%) - Multirace
Geographical mobility - Moved from abroad (%) - Other Race
Place of birth for the foreign-born population - Ireland (%)
Place of birth for the foreign-born population - Denmark (%)
Place of birth for the foreign-born population - Norway (%)
Place of birth for the foreign-born population - Sweden (%)
Place of birth for the foreign-born population - United Kingdom (%)
Place of birth for the foreign-born population - England (%)
Place of birth for the foreign-born population - Scotland (%)
Place of birth for the foreign-born population - Other Northern Europe (%)
Place of birth for the foreign-born population - Austria (%)
Place of birth for the foreign-born population - Belgium (%)
Place of birth for the foreign-born population - France (%)
Place of birth for the foreign-born population - Germany (%)
Place of birth for the foreign-born population - Netherlands (%)
Place of birth for the foreign-born population - Switzerland (%)
Place of birth for the foreign-born population - Other Western Europe (%)
Place of birth for the foreign-born population - Greece (%)
Place of birth for the foreign-born population - Italy (%)
Place of birth for the foreign-born population - Portugal (%)
Place of birth for the foreign-born population - Spain (%)
Place of birth for the foreign-born population - Other Southern Europe (%)
Place of birth for the foreign-born population - Albania (%)
Place of birth for the foreign-born population - Belarus (%)
Place of birth for the foreign-born population - Bosnia and Herzegovina (%)
Place of birth for the foreign-born population - Bulgaria (%)
Place of birth for the foreign-born population - Croatia (%)
Place of birth for the foreign-born population - Czechoslovakia (%)
Place of birth for the foreign-born population - Hungary (%)
Place of birth for the foreign-born population - Latvia (%)
Place of birth for the foreign-born population - Lithuania (%)
Place of birth for the foreign-born population - North Macedonia (Macedonia) (%)
Place of birth for the foreign-born population - Moldova (%)
Place of birth for the foreign-born population - Poland (%)
Place of birth for the foreign-born population - Romania (%)
Place of birth for the foreign-born population - Russia (%)
Place of birth for the foreign-born population - Serbia (%)
Place of birth for the foreign-born population - Ukraine (%)
Place of birth for the foreign-born population - Other Eastern Europe (%)
Place of birth for the foreign-born population - China (%)
Place of birth for the foreign-born population - Hong Kong (%)
Place of birth for the foreign-born population - Taiwan (%)
Place of birth for the foreign-born population - Japan (%)
Place of birth for the foreign-born population - Korea (%)
Place of birth for the foreign-born population - Other Eastern Asia (%)
Place of birth for the foreign-born population - Afghanistan (%)
Place of birth for the foreign-born population - Bangladesh (%)
Place of birth for the foreign-born population - India (%)
Place of birth for the foreign-born population - Iran (%)
Place of birth for the foreign-born population - Kazakhstan (%)
Place of birth for the foreign-born population - Nepal (%)
Place of birth for the foreign-born population - Pakistan (%)
Place of birth for the foreign-born population - Sri Lanka (%)
Place of birth for the foreign-born population - Uzbekistan (%)
Place of birth for the foreign-born population - Other South Central Asia (%)
Place of birth for the foreign-born population - Burma (%)
Place of birth for the foreign-born population - Cambodia (%)
Place of birth for the foreign-born population - Indonesia (%)
Place of birth for the foreign-born population - Laos (%)
Place of birth for the foreign-born population - Malaysia (%)
Place of birth for the foreign-born population - Philippines (%)
Place of birth for the foreign-born population - Singapore (%)
Place of birth for the foreign-born population - Thailand (%)
Place of birth for the foreign-born population - Vietnam (%)
Place of birth for the foreign-born population - Other South Eastern Asia (%)
Place of birth for the foreign-born population - Armenia (%)
Place of birth for the foreign-born population - Iraq (%)
Place of birth for the foreign-born population - Israel (%)
Place of birth for the foreign-born population - Jordan (%)
Place of birth for the foreign-born population - Kuwait (%)
Place of birth for the foreign-born population - Lebanon (%)
Place of birth for the foreign-born population - Saudi Arabia (%)
Place of birth for the foreign-born population - Syria (%)
Place of birth for the foreign-born population - Turkey (%)
Place of birth for the foreign-born population - Yemen (%)
Place of birth for the foreign-born population - Other Western Asia (%)
Place of birth for the foreign-born population - Eritrea (%)
Place of birth for the foreign-born population - Ethiopia (%)
Place of birth for the foreign-born population - Kenya (%)
Place of birth for the foreign-born population - Somalia (%)
Place of birth for the foreign-born population - Uganda (%)
Place of birth for the foreign-born population - Zimbabwe (%)
Place of birth for the foreign-born population - Other Eastern Africa (%)
Place of birth for the foreign-born population - Cameroon (%)
Place of birth for the foreign-born population - Congo (%)
Place of birth for the foreign-born population - Democratic Republic of Congo (Zaire) (%)
Place of birth for the foreign-born population - Other Middle Africa (%)
Place of birth for the foreign-born population - Egypt (%)
Place of birth for the foreign-born population - Morocco (%)
Place of birth for the foreign-born population - Sudan (%)
Place of birth for the foreign-born population - Other Northern Africa (%)
Place of birth for the foreign-born population - South Africa (%)
Place of birth for the foreign-born population - Other Southern Africa (%)
Place of birth for the foreign-born population - Cabo Verde (%)
Place of birth for the foreign-born population - Ghana (%)
Place of birth for the foreign-born population - Liberia (%)
Place of birth for the foreign-born population - Nigeria (%)
Place of birth for the foreign-born population - Senegal (%)
Place of birth for the foreign-born population - Sierra Leone (%)
Place of birth for the foreign-born population - Other Western Africa (%)
Place of birth for the foreign-born population - Australia (%)
Place of birth for the foreign-born population - New Zealand (%)
Place of birth for the foreign-born population - Fiji (%)
Place of birth for the foreign-born population - Micronesia (%)
Place of birth for the foreign-born population - Bahamas (%)
Place of birth for the foreign-born population - Barbados (%)
Place of birth for the foreign-born population - Cuba (%)
Place of birth for the foreign-born population - Dominica (%)
Place of birth for the foreign-born population - Dominican Republic (%)
Place of birth for the foreign-born population - Grenada (%)
Place of birth for the foreign-born population - Haiti (%)
Place of birth for the foreign-born population - Jamaica (%)
Place of birth for the foreign-born population - St. Vincent and the Grenadines (%)
Place of birth for the foreign-born population - Trinidad and Tobago (%)
Place of birth for the foreign-born population - West Indies (%)
Place of birth for the foreign-born population - Other Caribbean (%)
Place of birth for the foreign-born population - Belize (%)
Place of birth for the foreign-born population - Costa Rica (%)
Place of birth for the foreign-born population - El Salvador (%)
Place of birth for the foreign-born population - Guatemala (%)
Place of birth for the foreign-born population - Honduras (%)
Place of birth for the foreign-born population - Mexico (%)
Place of birth for the foreign-born population - Nicaragua (%)
Place of birth for the foreign-born population - Panama (%)
Place of birth for the foreign-born population - Other Central America (%)
Place of birth for the foreign-born population - Argentina (%)
Place of birth for the foreign-born population - Bolivia (%)
Place of birth for the foreign-born population - Brazil (%)
Place of birth for the foreign-born population - Chile (%)
Place of birth for the foreign-born population - Colombia (%)
Place of birth for the foreign-born population - Ecuador (%)
Place of birth for the foreign-born population - Guyana (%)
Place of birth for the foreign-born population - Peru (%)
Place of birth for the foreign-born population - Uruguay (%)
Place of birth for the foreign-born population - Venezuela (%)
Place of birth for the foreign-born population - Other South America (%)
Place of birth for the foreign-born population - Canada (%)
Place of birth for the foreign-born population - Other Northern America (%)
Place of birth for the foreign-born population - Other (%)
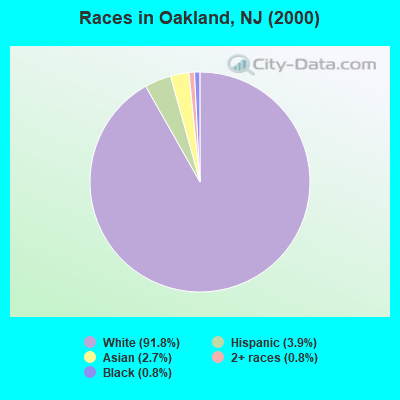
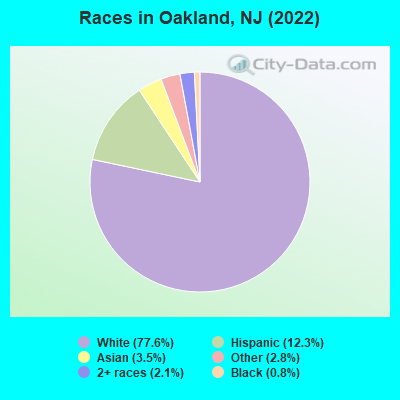
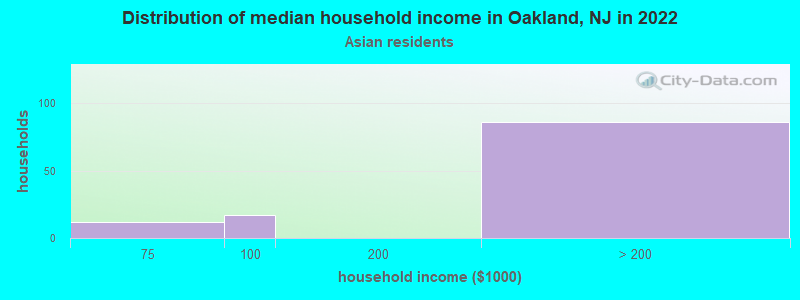
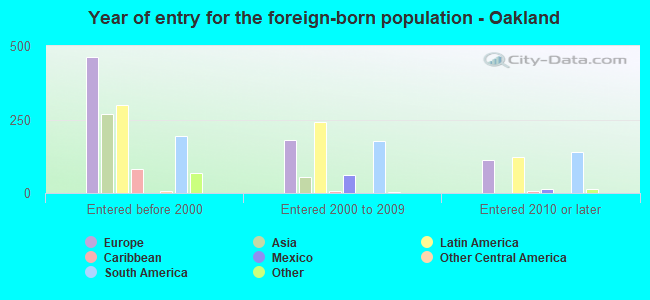
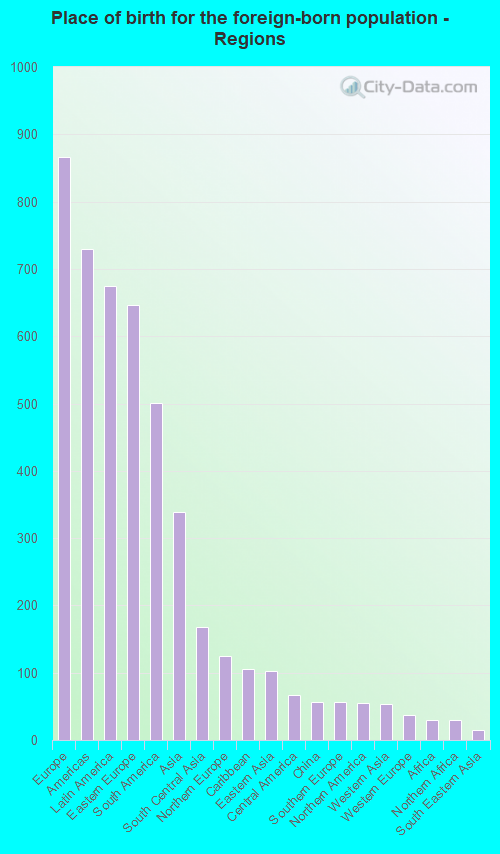
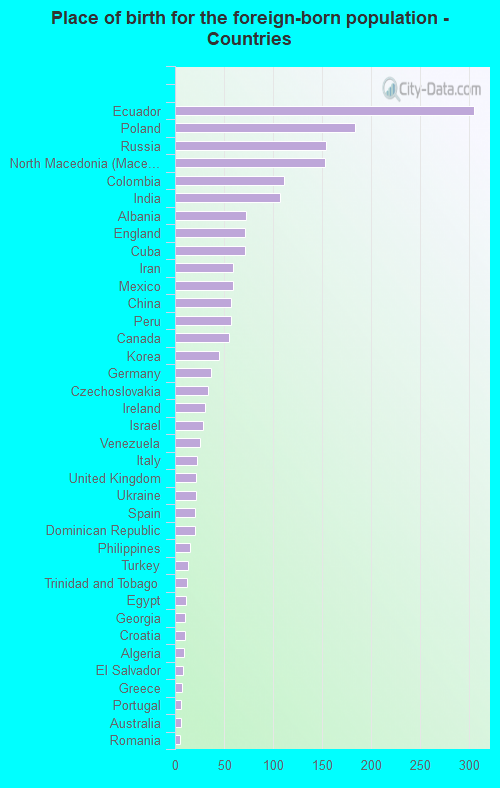
According to 2022 data, the most numerous races in Oakland, NJ are White alone (9,873 residents), Hispanic (1,567 residents), and Black alone (106 residents). 76.3% of Oakland residents speak English at home. 15.5% of Oakland, NJ residents are foreign-born (6.6% born in Europe, 5.2% born in Latin America, 2.6% born in Asia), which is 48.4% less than the foreign-born rate of 23.0% across the entire state of New Jersey.
Race distribution in Oakland
2000 2022
5,557,209 66.0% White alone 1,117,191 13.3% Hispanic 1,096,171 13.0% Black alone 477,012 5.7% Asian alone 133,689 1.6% Two or more races 19,565 0.2% Other race alone 11,338 0.1% American Indian alone 2,175 0.03% Native Hawaiian and Other
4,766,476 51.5% White alone 2,028,470 21.9% Hispanic 1,111,632 12.0% Black alone 923,546 10.0% Asian alone 332,237 3.6% Two or more races 89,847 1.0% Other race alone 8,557 0.09% American Indian alone 934 0.01% Native Hawaiian and Other
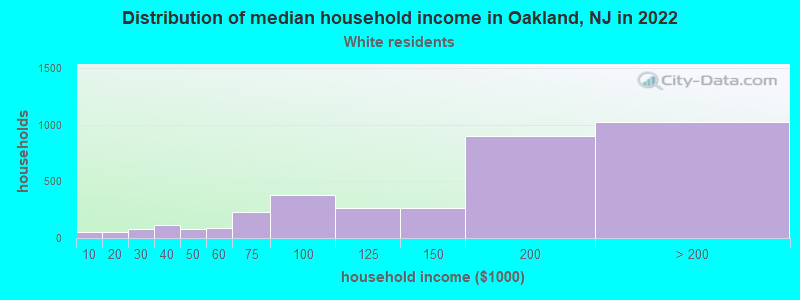
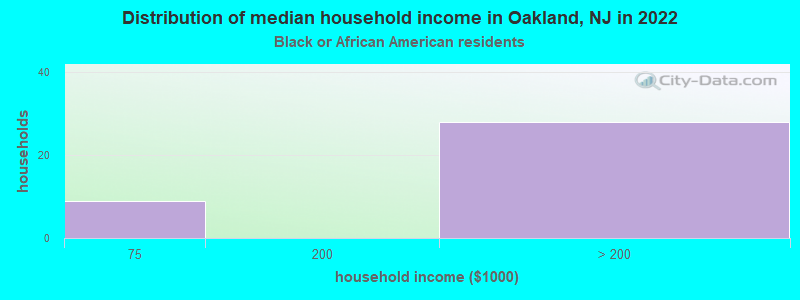
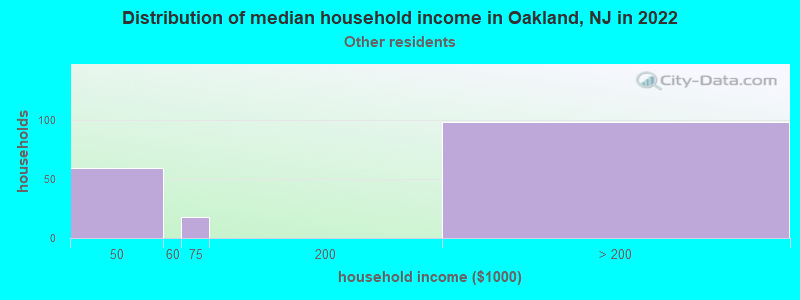
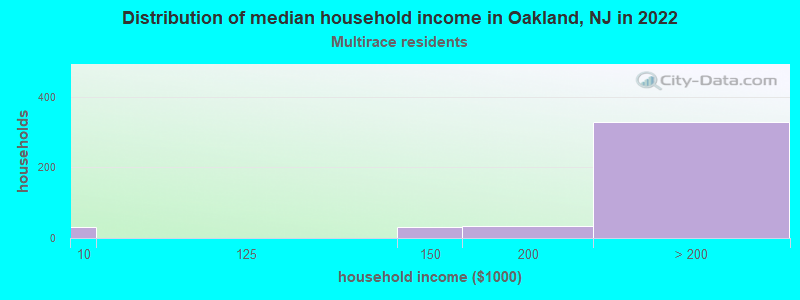
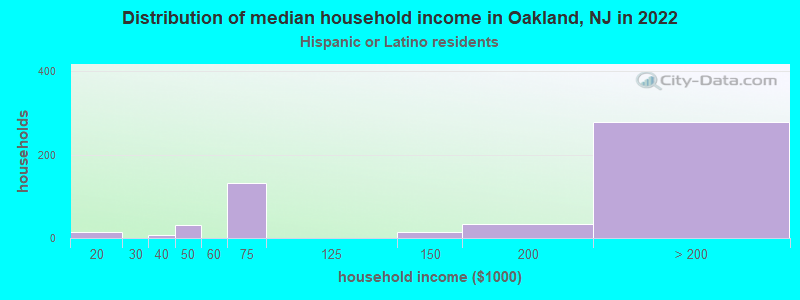
Income and house value in Oakland Median household income in 2022 $151,737 White non-Hispanic householdersover $200,000 Black householdersover $200,000 Asian householdersover $200,000 Some other race householdersover $200,000 Two or more races householders$199,901 Hispanic or Latino race householdersMedian 2022 house value $545,469 White Non-Hispanic householders$616,353 Black or African American householders $823,829 Asian householders$309,414 Some other race householders$787,600 Two or more races householders$661,134 Hispanic or Latino householders
Median age by race in Oakland
44.4 Median age for White residents43.2 45.4 55.6 Median age for Black or African American residents60.5 44.5 -766,197,182.3 Median age for American Indian / Alaska Native residents-686,322,685.6 -753,722,794.2 50.7 Median age for Asian residents52.8 39.4 -510,460,250.5 Median age for Native Hawaiian / Pacific Islander residents-514,767,932.0 -713,070,378.3 21.8 Median age for Other race residents10.9 49.8 36.9 Median age for Two or more races residents37.7 35.9 44.1 Median age for White alone residents42.3 45.2 36.0 Median age for Hispanic or Latino residents34.8 36.1
Owner/renter occupied households by race in Oakland
House owners and renters - White residents 3,353 92.9% Owner occupied256 7.1% Renter occupiedHouse owners and renters - Black or African American residents 39 100.0% Owner occupiedHouse owners and renters - Asian residents 105 91.1% Owner occupied10 8.9% Renter occupiedHouse owners and renters - Other race residents 111 65.1% Owner occupied59 34.9% Renter occupiedHouse owners and renters - Two or more races residents 381 86.3% Owner occupied61 13.7% Renter occupiedHouse owners and renters - White alone residents 3,328 92.3% Owner occupied278 7.7% Renter occupiedHouse owners and renters - Hispanic or Latino residents 462 88.9% Owner occupied58 11.1% Renter occupied
Language usage in Oakland
English speakers - Total 76.3% of residents of Oakland speak English at home.
10.5% of residents speak Spanish at home 927 73.7% Speak English very well330 26.3% Speak English less than very well12.2% of residents speak other language at home 997 68.2% Speak English very well465 31.8% Speak English less than very well
English speakers - Born in the United States 84.1% of residents of Oakland speak English at home.
6.5% of residents speak Spanish at home 185 100.0% Speak English very well8.3% of residents speak other language at home 238 100.0% Speak English very well
English speakers - Native, born elsewhere 80.5% of residents of Oakland speak English at home.
18.3% of residents speak Spanish at home 1 6.7% Speak English very well14 93.3% Speak English less than very well
English speakers - Foreign-born 19.9% of residents of Oakland speak English at home.
31.1% of residents speak Spanish at home 335 54.7% Speak English very well277 45.3% Speak English less than very well48.2% of residents speak other language at home 529 55.7% Speak English very well420 44.3% Speak English less than very well
White (Caucasian) - Speak only English Native:
95.3% (7,917)Foreign-born:
29.9% (257)
White (Caucasian) - Speak another language Native:
6.0% (500)Foreign-born:
72.0% (620)
Black or African American - Speak only English Native:
89.2% (79)Foreign-born:
100.0% (20)
Asian - Speak only English Native:
50.4% (107)Foreign-born:
7.4% (17)
Asian - Speak another language Native:
49.8% (106)Foreign-born:
92.8% (219)
Other race - Speak another language Native:
27.4% (88)Foreign-born:
100.0% (215)
Two or more races - Speak only English Native:
45.3% (293)Foreign-born:
18.3% (119)
Two or more races - Speak another language Native:
56.3% (364)Foreign-born:
80.6% (524)
White alone - Speak only English Native:
93.7% (7,928)Foreign-born:
27.7% (233)
White alone - Speak another language Native:
6.4% (546)Foreign-born:
72.1% (605)
Hispanic or Latino - Speak only English Native:
43.1% (339)Foreign-born:
18.2% (138)
Hispanic or Latino - Speak another language Native:
56.0% (440)Foreign-born:
83.3% (634)
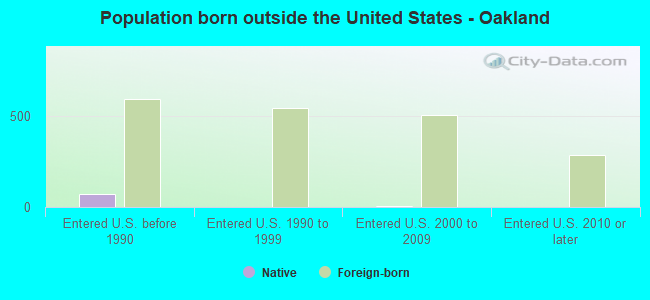
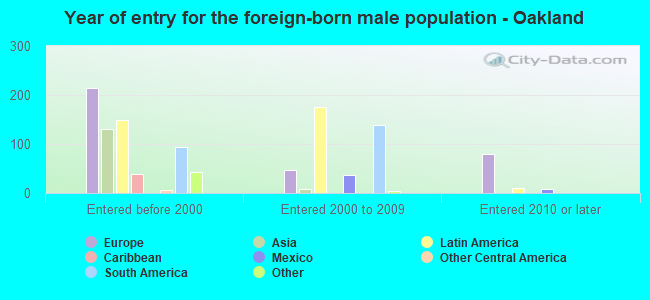
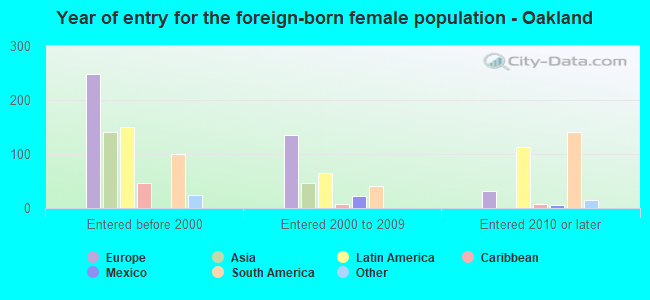
Foreign-born residents in Oakland 1,973 residents are foreign born (6.6% Europe , 5.2% Latin America , 2.6% Asia ).
This city:
15.5%New Jersey:
23.2%
Marital status for residents in Oakland Marital status - White (Caucasian) population 15 years and over
Males 28.1% Never married64.8% Now married0.2% Separated1.4% Widowed5.5% DivorcedFemales 23.6% Never married62.2% Now married0.8% Separated7.0% Widowed6.4% DivorcedWomen who gave birth in the past 12 months Now married:
82.4% (119)Unmarried:
17.6% (26)
Women who did not give birth in the past 12 months Now married:
51.3% (898)Unmarried:
48.7% (852)
Marital status - Black or African American population 15 years and over
Males 0.0% Never married53.2% Now married0.0% Separated0.0% Widowed46.8% DivorcedFemales 51.0% Never married30.6% Now married0.0% Separated18.4% Widowed0.0% DivorcedWomen who did not give birth in the past 12 months Now married:
0.0% (0)Unmarried:
100.0% (26)
Marital status - Asian population 15 years and over
Males 17.5% Never married82.5% Now married0.0% Separated0.0% Widowed0.0% DivorcedFemales 17.2% Never married79.6% Now married0.0% Separated3.2% Widowed0.0% DivorcedWomen who gave birth in the past 12 months Now married:
100.0% (10)Unmarried:
0.0% (0)
Women who did not give birth in the past 12 months Now married:
68.3% (67)Unmarried:
31.7% (31)
Marital status - Other race population 15 years and over
Males 38.6% Never married61.4% Now married0.0% Separated0.0% Widowed0.0% DivorcedFemales 33.3% Never married14.2% Now married0.0% Separated6.4% Widowed46.1% DivorcedWomen who did not give birth in the past 12 months Now married:
26.3% (35)Unmarried:
73.7% (99)
Marital status - Two or more races population 15 years and over
Males 14.6% Never married48.5% Now married0.0% Separated2.7% Widowed34.1% DivorcedFemales 15.5% Never married66.2% Now married0.0% Separated12.5% Widowed5.8% DivorcedWomen who did not give birth in the past 12 months Now married:
72.7% (283)Unmarried:
27.3% (107)
Marital status - White alone, not Hispanic / Latino population 15 years and over
Males 28.1% Never married64.5% Now married0.3% Separated1.4% Widowed5.8% DivorcedFemales 23.6% Never married61.8% Now married0.8% Separated7.2% Widowed6.5% DivorcedWomen who gave birth in the past 12 months Now married:
83.3% (128)Unmarried:
16.7% (26)
Women who did not give birth in the past 12 months Now married:
48.8% (890)Unmarried:
51.2% (933)
Marital status - Hispanic or Latino population 15 years and over
Males 20.5% Never married60.7% Now married0.0% Separated2.5% Widowed16.3% DivorcedFemales 20.1% Never married69.5% Now married0.0% Separated5.2% Widowed5.2% DivorcedWomen who gave birth in the past 12 months Now married:
71.4% (10)Unmarried:
28.6% (4)
Women who did not give birth in the past 12 months Now married:
71.8% (381)Unmarried:
28.2% (150)
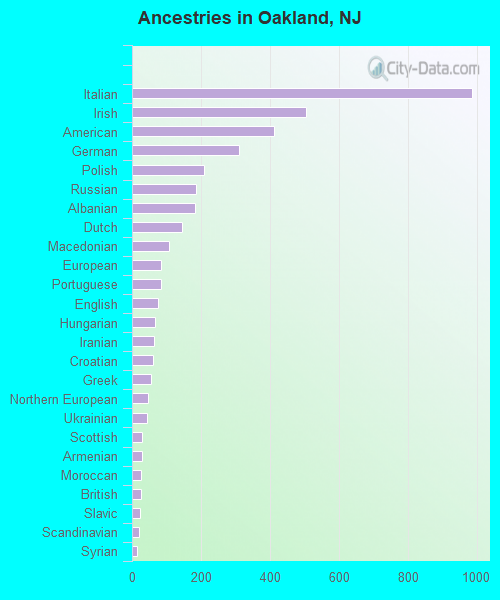
Ancestries in Oakland
986 17.9% Italian506 9.2% Irish413 7.5% American310 5.6% German210 3.8% Polish185 3.4% Russian183 3.3% Albanian145 2.6% Dutch108 2.0% Macedonian84 1.5% European83 1.5% Portuguese76 1.4% English66 1.2% Hungarian64 1.2% Iranian60 1.1% Croatian56 1.0% Greek46 0.8% Northern European43 0.8% Ukrainian30 0.5% Scottish29 0.5% Armenian25 0.5% Moroccan25 0.5% British22 0.4% Slavic19 0.3% Scandinavian15 0.3% Syrian14 0.3% Eastern European13 0.2% Serbian12 0.2% Turkish11 0.2% Canadian10 0.2% French10 0.2% Australian10 0.2% Scotch-Irish9 0.2% Slovak9 0.2% Jamaican9 0.2% Trinidadian and Tobagonian8 0.1% Alsatian7 0.1% Austrian6 0.1% Lebanese2 0.04% French Canadian2 0.04% Danish
Children Nativity (place of birth) in Oakland
Children under 6 years - Living with two parents Both parents native 574 100.0% NativeBoth parents foreign-born 3 100.0% NativeOne native, one foreign-born parent 118 100.0% NativeChildren under 6 years - Living with one parent Native parent 25 100.0% NativeForeign-born parent 89 100.0% NativeChildren 6 to 17 years - Living with two parents Both parents native 1,182 99.9% Native1 0.1% Foreign-bornBoth parents foreign-born 245 96.0% Native10 4.0% Foreign-bornOne native, one foreign-born parent 161 100.0% NativeChildren 6 to 17 years - Living with one parent Native parent 184 100.0% NativeForeign-born parent 68 49.5% Native69 50.5% Foreign-born
Grandparents responsible for own grandchildren in Oakland
Grandparents (30 to 59 years) White / Caucasian 17 51.4% Responsible for grandchildren16 48.6% Not responsible for grandchildrenWhite alone, not Hispanic / Latino 19 49.6% Responsible for grandchildren19 50.4% Not responsible for grandchildrenGrandparents (60 years and over) White / Caucasian 19 24.6% Responsible for grandchildren57 75.4% Not responsible for grandchildrenWhite alone, not Hispanic / Latino 19 22.6% Responsible for grandchildren66 77.4% Not responsible for grandchildren