Races in Oildale, California (CA) Detailed Stats
Data:
Races - White alone (%)
Races - White alone (% change since 2000)
Races - Black alone (%)
Races - Black alone (% change since 2000)
Races - American Indian alone (%)
Races - American Indian alone (% change since 2000)
Races - Asian alone (%)
Races - Asian alone (% change since 2000)
Races - Hispanic (%)
Races - Hispanic (% change since 2000)
Races - Native Hawaiian and Other Pacific Islander alone (%)
Races - Native Hawaiian and Other Pacific Islander alone (% change since 2000)
Races - Two or more races(%)
Races - Two or more races(% change since 2000)
Races - Other race alone (%)
Races - Other race alone (% change since 2000)
Racial diversity
Place of birth - Born in state of residence (%)
Place of birth - Born in state of residence (%) - White
Place of birth - Born in state of residence (%) - Black or African American
Place of birth - Born in state of residence (%) - Asian
Place of birth - Born in state of residence (%) - Hispanic or Latino
Place of birth - Born in state of residence (%) - American Indian and Alaska Native
Place of birth - Born in state of residence (%) - Multirace
Place of birth - Born in state of residence (%) - Other Race
Place of birth - Born in other state (%)
Place of birth - Born in other state (%) - White
Place of birth - Born in other state (%) - Black or African American
Place of birth - Born in other state (%) - Asian
Place of birth - Born in other state (%) - Hispanic or Latino
Place of birth - Born in other state (%) - American Indian and Alaska Native
Place of birth - Born in other state (%) - Multirace
Place of birth - Born in other state (%) - Other Race
Place of birth - Native, outside of US (%)
Place of birth - Native, outside of US (%) - White
Place of birth - Native, outside of US (%) - Black or African American
Place of birth - Native, outside of US (%) - Asian
Place of birth - Native, outside of US (%) - Hispanic or Latino
Place of birth - Native, outside of US (%) - American Indian and Alaska Native
Place of birth - Native, outside of US (%) - Multirace
Place of birth - Native, outside of US (%) - Other Race
Place of birth - Foreign born (%)
Place of birth - Foreign born (%) - White
Place of birth - Foreign born (%) - Black or African American
Place of birth - Foreign born (%) - Asian
Place of birth - Foreign born (%) - Hispanic or Latino
Place of birth - Foreign born (%) - American Indian and Alaska Native
Place of birth - Foreign born (%) - Multirace
Place of birth - Foreign born (%) - Other Race
Residents speaking English at home (%)
Residents speaking English at home - Born in the United States (%)
Residents speaking English at home - Native, born elsewhere (%)
Residents speaking English at home - Foreign born (%)
Residents speaking Spanish at home (%)
Residents speaking Spanish at home - Born in the United States (%)
Residents speaking Spanish at home - Native, born elsewhere (%)
Residents speaking Spanish at home - Foreign born (%)
Residents speaking other language at home (%)
Residents speaking other language at home - Born in the United States (%)
Residents speaking other language at home - Native, born elsewhere (%)
Residents speaking other language at home - Foreign born (%)
Marital status - Never married (%)
Marital status - Now married (%)
Marital status - Separated (%)
Marital status - Widowed (%)
Marital status - Divorced (%)
Ancestries Reported - Arab (%)
Ancestries Reported - Czech (%)
Ancestries Reported - Danish (%)
Ancestries Reported - Dutch (%)
Ancestries Reported - English (%)
Ancestries Reported - French (%)
Ancestries Reported - French Canadian (%)
Ancestries Reported - German (%)
Ancestries Reported - Greek (%)
Ancestries Reported - Hungarian (%)
Ancestries Reported - Irish (%)
Ancestries Reported - Italian (%)
Ancestries Reported - Lithuanian (%)
Ancestries Reported - Norwegian (%)
Ancestries Reported - Polish (%)
Ancestries Reported - Portuguese (%)
Ancestries Reported - Russian (%)
Ancestries Reported - Scotch-Irish (%)
Ancestries Reported - Scottish (%)
Ancestries Reported - Slovak (%)
Ancestries Reported - Subsaharan African (%)
Ancestries Reported - Swedish (%)
Ancestries Reported - Swiss (%)
Ancestries Reported - Ukrainian (%)
Ancestries Reported - United States (%)
Ancestries Reported - Welsh (%)
Ancestries Reported - West Indian (%)
Ancestries Reported - Other (%)
Geographical mobility - Same house 1 year ago (%)
Geographical mobility - Same house 1 year ago (%) - White
Geographical mobility - Same house 1 year ago (%) - Black or African American
Geographical mobility - Same house 1 year ago (%) - Asian
Geographical mobility - Same house 1 year ago (%) - Hispanic or Latino
Geographical mobility - Same house 1 year ago (%) - American Indian and Alaska Native
Geographical mobility - Same house 1 year ago (%) - Multirace
Geographical mobility - Same house 1 year ago (%) - Other Race
Geographical mobility - Moved within same county (%)
Geographical mobility - Moved within same county (%) - White
Geographical mobility - Moved within same county (%) - Black or African American
Geographical mobility - Moved within same county (%) - Asian
Geographical mobility - Moved within same county (%) - Hispanic or Latino
Geographical mobility - Moved within same county (%) - American Indian and Alaska Native
Geographical mobility - Moved within same county (%) - Multirace
Geographical mobility - Moved within same county (%) - Other Race
Geographical mobility - Moved from different county within same state (%)
Geographical mobility - Moved from different county within same state (%) - White
Geographical mobility - Moved from different county within same state (%) - Black or African American
Geographical mobility - Moved from different county within same state (%) - Asian
Geographical mobility - Moved from different county within same state (%) - Hispanic or Latino
Geographical mobility - Moved from different county within same state (%) - American Indian and Alaska Native
Geographical mobility - Moved from different county within same state (%) - Multirace
Geographical mobility - Moved from different county within same state (%) - Other Race
Geographical mobility - Moved from different state (%)
Geographical mobility - Moved from different state (%) - White
Geographical mobility - Moved from different state (%) - Black or African American
Geographical mobility - Moved from different state (%) - Asian
Geographical mobility - Moved from different state (%) - Hispanic or Latino
Geographical mobility - Moved from different state (%) - American Indian and Alaska Native
Geographical mobility - Moved from different state (%) - Multirace
Geographical mobility - Moved from different state (%) - Other Race
Geographical mobility - Moved from abroad (%)
Geographical mobility - Moved from abroad (%) - White
Geographical mobility - Moved from abroad (%) - Black or African American
Geographical mobility - Moved from abroad (%) - Asian
Geographical mobility - Moved from abroad (%) - Hispanic or Latino
Geographical mobility - Moved from abroad (%) - American Indian and Alaska Native
Geographical mobility - Moved from abroad (%) - Multirace
Geographical mobility - Moved from abroad (%) - Other Race
Place of birth for the foreign-born population - Ireland (%)
Place of birth for the foreign-born population - Denmark (%)
Place of birth for the foreign-born population - Norway (%)
Place of birth for the foreign-born population - Sweden (%)
Place of birth for the foreign-born population - United Kingdom (%)
Place of birth for the foreign-born population - England (%)
Place of birth for the foreign-born population - Scotland (%)
Place of birth for the foreign-born population - Other Northern Europe (%)
Place of birth for the foreign-born population - Austria (%)
Place of birth for the foreign-born population - Belgium (%)
Place of birth for the foreign-born population - France (%)
Place of birth for the foreign-born population - Germany (%)
Place of birth for the foreign-born population - Netherlands (%)
Place of birth for the foreign-born population - Switzerland (%)
Place of birth for the foreign-born population - Other Western Europe (%)
Place of birth for the foreign-born population - Greece (%)
Place of birth for the foreign-born population - Italy (%)
Place of birth for the foreign-born population - Portugal (%)
Place of birth for the foreign-born population - Spain (%)
Place of birth for the foreign-born population - Other Southern Europe (%)
Place of birth for the foreign-born population - Albania (%)
Place of birth for the foreign-born population - Belarus (%)
Place of birth for the foreign-born population - Bosnia and Herzegovina (%)
Place of birth for the foreign-born population - Bulgaria (%)
Place of birth for the foreign-born population - Croatia (%)
Place of birth for the foreign-born population - Czechoslovakia (%)
Place of birth for the foreign-born population - Hungary (%)
Place of birth for the foreign-born population - Latvia (%)
Place of birth for the foreign-born population - Lithuania (%)
Place of birth for the foreign-born population - North Macedonia (Macedonia) (%)
Place of birth for the foreign-born population - Moldova (%)
Place of birth for the foreign-born population - Poland (%)
Place of birth for the foreign-born population - Romania (%)
Place of birth for the foreign-born population - Russia (%)
Place of birth for the foreign-born population - Serbia (%)
Place of birth for the foreign-born population - Ukraine (%)
Place of birth for the foreign-born population - Other Eastern Europe (%)
Place of birth for the foreign-born population - China (%)
Place of birth for the foreign-born population - Hong Kong (%)
Place of birth for the foreign-born population - Taiwan (%)
Place of birth for the foreign-born population - Japan (%)
Place of birth for the foreign-born population - Korea (%)
Place of birth for the foreign-born population - Other Eastern Asia (%)
Place of birth for the foreign-born population - Afghanistan (%)
Place of birth for the foreign-born population - Bangladesh (%)
Place of birth for the foreign-born population - India (%)
Place of birth for the foreign-born population - Iran (%)
Place of birth for the foreign-born population - Kazakhstan (%)
Place of birth for the foreign-born population - Nepal (%)
Place of birth for the foreign-born population - Pakistan (%)
Place of birth for the foreign-born population - Sri Lanka (%)
Place of birth for the foreign-born population - Uzbekistan (%)
Place of birth for the foreign-born population - Other South Central Asia (%)
Place of birth for the foreign-born population - Burma (%)
Place of birth for the foreign-born population - Cambodia (%)
Place of birth for the foreign-born population - Indonesia (%)
Place of birth for the foreign-born population - Laos (%)
Place of birth for the foreign-born population - Malaysia (%)
Place of birth for the foreign-born population - Philippines (%)
Place of birth for the foreign-born population - Singapore (%)
Place of birth for the foreign-born population - Thailand (%)
Place of birth for the foreign-born population - Vietnam (%)
Place of birth for the foreign-born population - Other South Eastern Asia (%)
Place of birth for the foreign-born population - Armenia (%)
Place of birth for the foreign-born population - Iraq (%)
Place of birth for the foreign-born population - Israel (%)
Place of birth for the foreign-born population - Jordan (%)
Place of birth for the foreign-born population - Kuwait (%)
Place of birth for the foreign-born population - Lebanon (%)
Place of birth for the foreign-born population - Saudi Arabia (%)
Place of birth for the foreign-born population - Syria (%)
Place of birth for the foreign-born population - Turkey (%)
Place of birth for the foreign-born population - Yemen (%)
Place of birth for the foreign-born population - Other Western Asia (%)
Place of birth for the foreign-born population - Eritrea (%)
Place of birth for the foreign-born population - Ethiopia (%)
Place of birth for the foreign-born population - Kenya (%)
Place of birth for the foreign-born population - Somalia (%)
Place of birth for the foreign-born population - Uganda (%)
Place of birth for the foreign-born population - Zimbabwe (%)
Place of birth for the foreign-born population - Other Eastern Africa (%)
Place of birth for the foreign-born population - Cameroon (%)
Place of birth for the foreign-born population - Congo (%)
Place of birth for the foreign-born population - Democratic Republic of Congo (Zaire) (%)
Place of birth for the foreign-born population - Other Middle Africa (%)
Place of birth for the foreign-born population - Egypt (%)
Place of birth for the foreign-born population - Morocco (%)
Place of birth for the foreign-born population - Sudan (%)
Place of birth for the foreign-born population - Other Northern Africa (%)
Place of birth for the foreign-born population - South Africa (%)
Place of birth for the foreign-born population - Other Southern Africa (%)
Place of birth for the foreign-born population - Cabo Verde (%)
Place of birth for the foreign-born population - Ghana (%)
Place of birth for the foreign-born population - Liberia (%)
Place of birth for the foreign-born population - Nigeria (%)
Place of birth for the foreign-born population - Senegal (%)
Place of birth for the foreign-born population - Sierra Leone (%)
Place of birth for the foreign-born population - Other Western Africa (%)
Place of birth for the foreign-born population - Australia (%)
Place of birth for the foreign-born population - New Zealand (%)
Place of birth for the foreign-born population - Fiji (%)
Place of birth for the foreign-born population - Micronesia (%)
Place of birth for the foreign-born population - Bahamas (%)
Place of birth for the foreign-born population - Barbados (%)
Place of birth for the foreign-born population - Cuba (%)
Place of birth for the foreign-born population - Dominica (%)
Place of birth for the foreign-born population - Dominican Republic (%)
Place of birth for the foreign-born population - Grenada (%)
Place of birth for the foreign-born population - Haiti (%)
Place of birth for the foreign-born population - Jamaica (%)
Place of birth for the foreign-born population - St. Vincent and the Grenadines (%)
Place of birth for the foreign-born population - Trinidad and Tobago (%)
Place of birth for the foreign-born population - West Indies (%)
Place of birth for the foreign-born population - Other Caribbean (%)
Place of birth for the foreign-born population - Belize (%)
Place of birth for the foreign-born population - Costa Rica (%)
Place of birth for the foreign-born population - El Salvador (%)
Place of birth for the foreign-born population - Guatemala (%)
Place of birth for the foreign-born population - Honduras (%)
Place of birth for the foreign-born population - Mexico (%)
Place of birth for the foreign-born population - Nicaragua (%)
Place of birth for the foreign-born population - Panama (%)
Place of birth for the foreign-born population - Other Central America (%)
Place of birth for the foreign-born population - Argentina (%)
Place of birth for the foreign-born population - Bolivia (%)
Place of birth for the foreign-born population - Brazil (%)
Place of birth for the foreign-born population - Chile (%)
Place of birth for the foreign-born population - Colombia (%)
Place of birth for the foreign-born population - Ecuador (%)
Place of birth for the foreign-born population - Guyana (%)
Place of birth for the foreign-born population - Peru (%)
Place of birth for the foreign-born population - Uruguay (%)
Place of birth for the foreign-born population - Venezuela (%)
Place of birth for the foreign-born population - Other South America (%)
Place of birth for the foreign-born population - Canada (%)
Place of birth for the foreign-born population - Other Northern America (%)
Place of birth for the foreign-born population - Other (%)
Latest news about races in Oildale, CA collected exclusively by city-data.com from local newspapers, TV, and radio stations
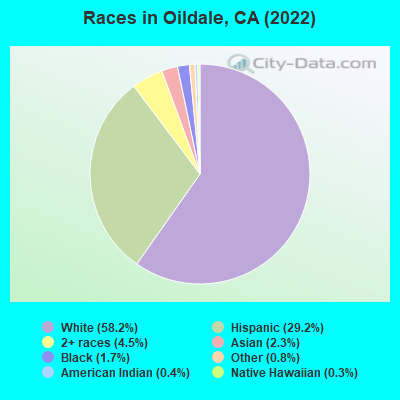
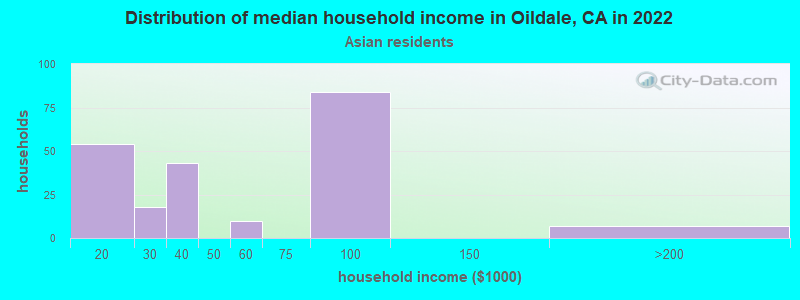
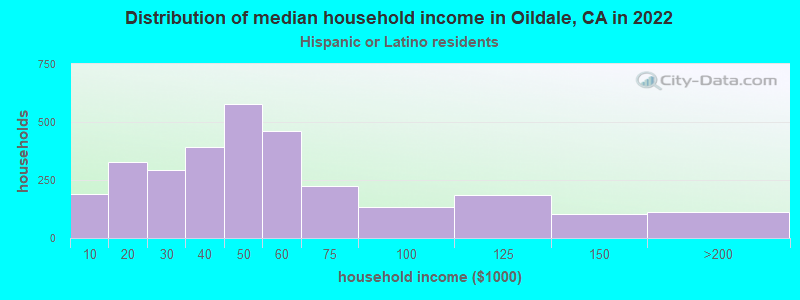
According to 2022 data, the most numerous races in Oildale, CA are Hispanic (8,150 residents), White alone (22,486 residents), and Asian alone (342 residents). 85.4% of Oildale residents speak English at home. 5.2% of Oildale, CA residents are foreign-born (2.6% born in Latin America, 2.0% born in Asia), which is 404.6% less than the foreign-born rate of 26.0% across the entire state of California.
Race distribution in Oildale
2000 2022
15,816,790 46.7% White alone 10,966,556 32.4% Hispanic 3,648,860 10.8% Asian alone 2,181,926 6.4% Black alone 903,115 2.7% Two or more races 178,984 0.5% American Indian alone 103,736 0.3% Native Hawaiian and Other 71,681 0.2% Other race alone
15,732,184 40.3% Hispanic 13,160,426 33.7% White alone 5,957,867 15.3% Asian alone 2,025,218 5.2% Black alone 1,663,222 4.3% Two or more races 251,618 0.6% Other race alone 135,777 0.3% Native Hawaiian and Other 103,030 0.3% American Indian alone
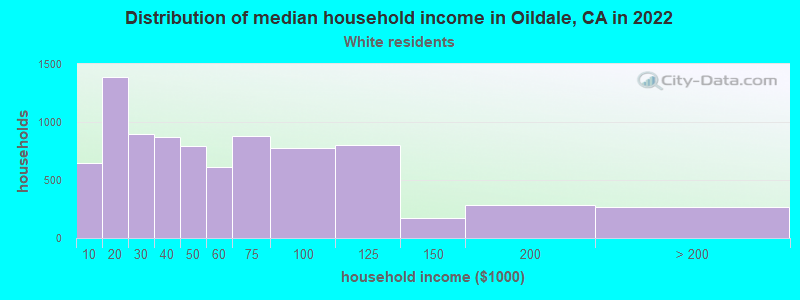
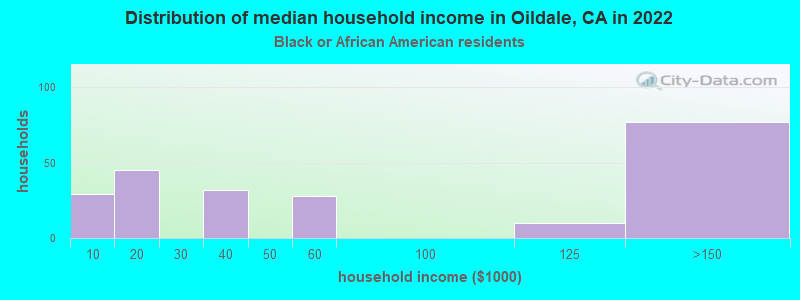
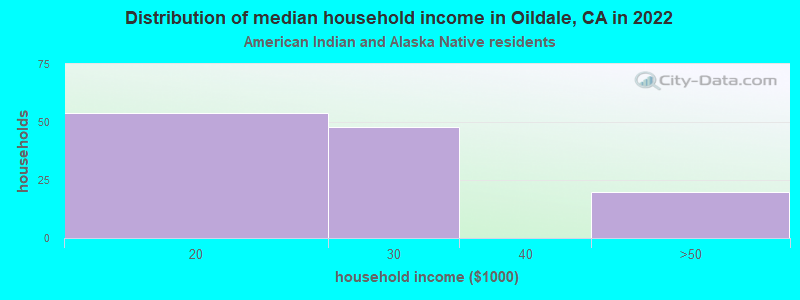
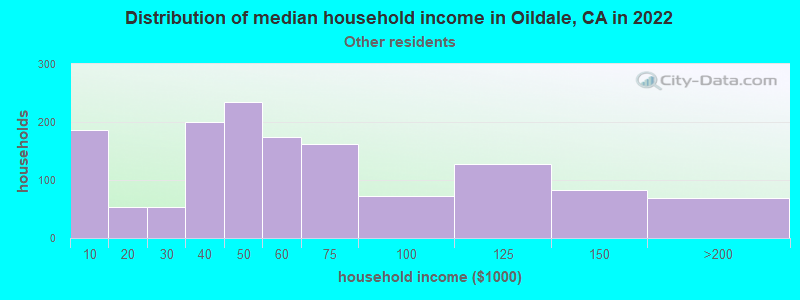
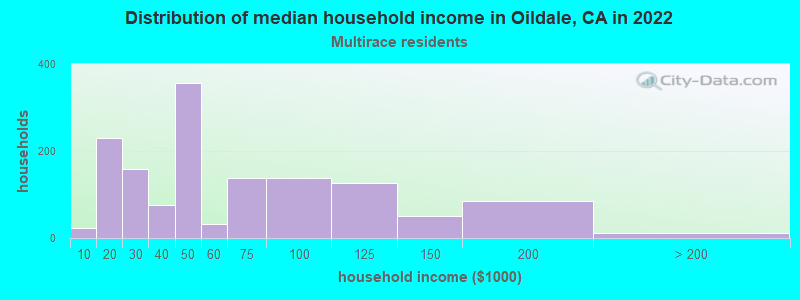
Income and house value in Oildale Median household income in 2022 $47,293 White non-Hispanic householders$38,319 Black householders$56,133 American Indian and Alaska Native householders$63,387 Asian householders$46,297 Some other race householders$31,312 Two or more races householders$51,051 Hispanic or Latino race householdersMedian 2022 house value $285,064 White Non-Hispanic householders$274,626 American Indian or Alaska Native householders$241,872 Some other race householders$294,422 Two or more races householders$251,230 Hispanic or Latino householders
Median age by race in Oildale
35.3 Median age for White residents34.6 36.1 19.5 Median age for Black or African American residents27.3 18.6 27.1 Median age for American Indian / Alaska Native residents19.5 41.4 31.8 Median age for Asian residents31.9 29.4 32.2 Median age for Other race residents38.5 28.4 25.9 Median age for Two or more races residents21.5 28.8 36.8 Median age for White alone residents35.5 37.4 26.5 Median age for Hispanic or Latino residents28.6 24.8
Owner/renter occupied households by race in Oildale
House owners and renters - White residents 3,366 37.2% Owner occupied5,685 62.8% Renter occupiedHouse owners and renters - Black or African American residents 45 26.1% Owner occupied128 73.9% Renter occupiedHouse owners and renters - American Indian / Alaska Native residents 47 62.9% Owner occupied28 37.1% Renter occupiedHouse owners and renters - Asian residents 46 42.2% Owner occupied63 57.8% Renter occupiedHouse owners and renters - Other race residents 265 27.9% Owner occupied686 72.1% Renter occupiedHouse owners and renters - Two or more races residents 591 31.1% Owner occupied1,308 68.9% Renter occupiedHouse owners and renters - White alone residents 3,334 38.4% Owner occupied5,360 61.6% Renter occupiedHouse owners and renters - Hispanic or Latino residents 699 28.6% Owner occupied1,742 71.4% Renter occupied
Language usage in Oildale
English speakers - Total 85.4% of residents of Oildale speak English at home.
10.9% of residents speak Spanish at home 2,901 83.3% Speak English very well580 16.7% Speak English less than very well4.2% of residents speak other language at home 895 66.0% Speak English very well462 34.0% Speak English less than very well
English speakers - Born in the United States 94.0% of residents of Oildale speak English at home.
3.9% of residents speak Spanish at home 170 100.0% Speak English very well1.9% of residents speak other language at home 81 100.0% Speak English very well
English speakers - Native, born elsewhere 45.3% of residents of Oildale speak English at home.
56.2% of residents speak Spanish at home 77 100.0% Speak English very well
English speakers - Foreign-born 13.5% of residents of Oildale speak English at home.
46.3% of residents speak Spanish at home 353 42.8% Speak English very well471 57.2% Speak English less than very well40.2% of residents speak other language at home 261 36.5% Speak English very well454 63.5% Speak English less than very well
White (Caucasian) - Speak only English Native:
96.5% (21,332)Foreign-born:
24.3% (172)
White (Caucasian) - Speak another language Native:
6.4% (1,404)Foreign-born:
77.9% (552)
Black or African American - Speak another language Native:
5.6% (31)Foreign-born:
82.6% (47)
Asian - Speak another language Native:
27.2% (70)Foreign-born:
97.0% (78)
Other race - Speak only English Native:
51.1% (952)Foreign-born:
4.8% (20)
Other race - Speak another language Native:
52.1% (970)Foreign-born:
95.4% (402)
Two or more races - Speak another language Native:
45.7% (2,177)Foreign-born:
100.0% (1,415)
White alone - Speak only English Native:
97.5% (19,522)Foreign-born:
19.3% (151)
White alone - Speak another language Native:
2.4% (475)Foreign-born:
86.0% (675)
Hispanic or Latino - Speak only English Native:
63.7% (4,334)Foreign-born:
9.2% (79)
Hispanic or Latino - Speak another language Native:
38.7% (2,636)Foreign-born:
91.7% (788)
Foreign-born residents in Oildale 1,820 residents are foreign born (2.6% Latin America , 2.0% Asia ).
This city:
5.2%California:
100.0%
Marital status for residents in Oildale Marital status - White (Caucasian) population 15 years and over
Males 41.3% Never married35.5% Now married3.8% Separated3.5% Widowed15.9% DivorcedFemales 32.7% Never married36.1% Now married4.1% Separated8.4% Widowed18.8% DivorcedWomen who gave birth in the past 12 months Now married:
62.3% (217)Unmarried:
37.7% (131)
Women who did not give birth in the past 12 months Now married:
36.7% (1,875)Unmarried:
63.3% (3,236)
Marital status - Black or African American population 15 years and over
Males 41.7% Never married53.6% Now married0.0% Separated0.0% Widowed4.7% DivorcedFemales 76.9% Never married20.5% Now married0.0% Separated0.0% Widowed2.6% DivorcedWomen who did not give birth in the past 12 months Now married:
18.1% (51)Unmarried:
81.9% (231)
Marital status - American Indian / Alaska Native population 15 years and over
Males 65.8% Never married24.6% Now married0.0% Separated0.0% Widowed9.6% DivorcedFemales 59.1% Never married27.3% Now married0.0% Separated0.0% Widowed13.6% DivorcedWomen who did not give birth in the past 12 months Now married:
31.6% (35)Unmarried:
68.4% (75)
Marital status - Asian population 15 years and over
Males 42.7% Never married57.3% Now married0.0% Separated0.0% Widowed0.0% DivorcedFemales 22.6% Never married77.4% Now married0.0% Separated0.0% Widowed0.0% DivorcedWomen who gave birth in the past 12 months Now married:
100.0% (40)Unmarried:
0.0% (0)
Women who did not give birth in the past 12 months Now married:
54.1% (42)Unmarried:
45.9% (36)
Marital status - Other race population 15 years and over
Males 24.9% Never married68.7% Now married1.4% Separated0.0% Widowed5.0% DivorcedFemales 14.2% Never married62.1% Now married0.0% Separated0.0% Widowed23.6% DivorcedWomen who gave birth in the past 12 months Now married:
14.1% (13)Unmarried:
85.9% (79)
Women who did not give birth in the past 12 months Now married:
85.8% (321)Unmarried:
14.2% (53)
Marital status - Two or more races population 15 years and over
Males 45.6% Never married19.4% Now married3.0% Separated0.0% Widowed31.9% DivorcedFemales 41.8% Never married13.2% Now married0.0% Separated26.9% Widowed18.2% DivorcedWomen who gave birth in the past 12 months Now married:
21.6% (28)Unmarried:
78.4% (100)
Women who did not give birth in the past 12 months Now married:
15.3% (200)Unmarried:
84.7% (1,108)
Marital status - White alone, not Hispanic / Latino population 15 years and over
Males 38.7% Never married35.8% Now married4.3% Separated3.6% Widowed17.5% DivorcedFemales 31.1% Never married35.9% Now married4.6% Separated9.6% Widowed18.8% DivorcedWomen who gave birth in the past 12 months Now married:
60.1% (214)Unmarried:
39.9% (142)
Women who did not give birth in the past 12 months Now married:
37.5% (1,794)Unmarried:
62.5% (2,987)
Marital status - Hispanic or Latino population 15 years and over
Males 45.9% Never married44.3% Now married0.9% Separated2.1% Widowed6.8% DivorcedFemales 33.9% Never married41.6% Now married0.9% Separated2.5% Widowed21.1% DivorcedWomen who gave birth in the past 12 months Now married:
39.6% (56)Unmarried:
60.4% (86)
Women who did not give birth in the past 12 months Now married:
38.9% (735)Unmarried:
61.1% (1,156)
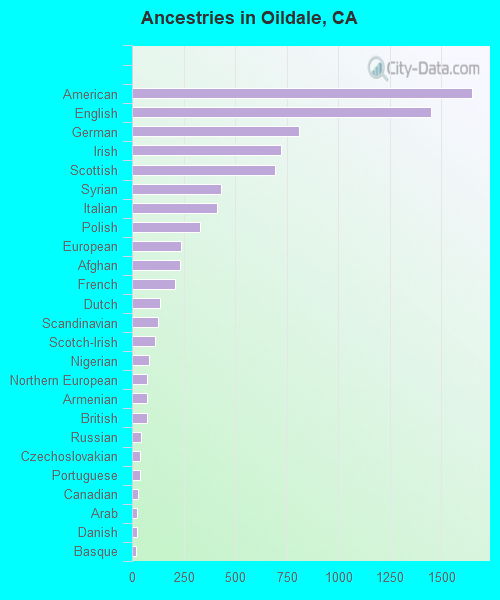
Ancestries in Oildale
1,686 9.8% English1,405 8.2% American1,120 6.5% German852 5.0% Irish608 3.5% Afghan467 2.7% European359 2.1% Italian210 1.2% Scandinavian165 1.0% Syrian134 0.8% Dutch132 0.8% Polish128 0.7% Armenian121 0.7% British105 0.6% Scottish99 0.6% Swedish88 0.5% Northern European81 0.5% Portuguese77 0.4% Russian74 0.4% Eastern European63 0.4% Welsh56 0.3% Scotch-Irish47 0.3% French41 0.2% Austrian37 0.2% Finnish31 0.2% Basque21 0.1% Arab18 0.1% Hungarian16 0.09% Norwegian14 0.08% Canadian12 0.07% Croatian10 0.06% German Russian
Geographical mobility in Oildale Same house 1 year ago 18,303 79.5% White (Caucasian)529 80.1% Black or African American347 92.4% American Indian / Alaska Native245 68.1% Asian9 100.0% Native Hawaiian / Pacific Islander1,406 72.1% Other race5,465 91.6% Two or more races18,406 81.4% White alone, not Hispanic / Latino5,670 72.2% Hispanic or LatinoMoved within same county 3,456 15.0% White / Caucasian101 15.2% Black or African American31 8.2% American Indian / Alaska Native95 26.3% Asian403 20.7% Other race327 5.5% Two or more races3,030 13.4% White alone, not Hispanic / Latino1,709 21.8% Hispanic or LatinoMoved within same state 474 2.1% White / Caucasian15 4.3% Asian33 1.7% Other race181 3.0% Two or more races504 2.2% White alone, not Hispanic / Latino154 2.0% Hispanic or LatinoMoved from different state 422 1.8% White / Caucasian50 0.8% Two or more races473 2.1% White alone, not Hispanic / Latino11 0.1% Hispanic or LatinoMoved from abroad 48 0.2% White15 0.7% Other race11 0.0% White alone, not Hispanic / Latino50 0.6% Hispanic or Latino
Children Nativity (place of birth) in Oildale
Children under 6 years - Living with two parents Both parents native 1,077 100.0% NativeBoth parents foreign-born 190 100.0% NativeOne native, one foreign-born parent 81 100.0% NativeChildren under 6 years - Living with one parent Native parent 1,242 100.0% NativeForeign-born parent 43 100.0% NativeChildren 6 to 17 years - Living with two parents Both parents native 2,572 100.0% Native0 0.0% Foreign-bornBoth parents foreign-born 156 79.9% Native39 20.1% Foreign-bornOne native, one foreign-born parent 296 100.0% NativeChildren 6 to 17 years - Living with one parent Native parent 3,115 100.0% NativeForeign-born parent 333 50.0% Native334 50.0% Foreign-born
Grandparents responsible for own grandchildren in Oildale
Grandparents (30 to 59 years) White / Caucasian 44 25.6% Responsible for grandchildren129 74.4% Not responsible for grandchildrenAsian 8 100.0% Responsible for grandchildrenOther race 37 100.0% Responsible for grandchildrenTwo or more races 32 30.0% Responsible for grandchildren73 70.0% Not responsible for grandchildrenWhite alone, not Hispanic / Latino 57 23.1% Responsible for grandchildren191 76.9% Not responsible for grandchildrenHispanic or Latino 37 95.7% Responsible for grandchildren2 4.3% Not responsible for grandchildrenGrandparents (60 years and over) White / Caucasian 75 38.5% Responsible for grandchildren119 61.5% Not responsible for grandchildrenOther race 12 100.0% Responsible for grandchildrenTwo or more races 591 100.0% Not responsible for grandchildrenWhite alone, not Hispanic / Latino 64 22.7% Responsible for grandchildren219 77.3% Not responsible for grandchildrenHispanic or Latino 45 100.0% Responsible for grandchildren