Races in Orange, New Jersey (NJ) Detailed Stats
Ancestries, Foreign-born residents, place of birth

Recent posts about races in Orange, New Jersey on our local forum with over 2,400,000 registered users:
 | Maplewood right next to Irvington - is this house worth it?? (23 replies) |
| Looking to Move from South Orange (15 replies) |
| West Orange pleasantdale area? (24 replies) |
| East Orange house from 80 years ago... (14 replies) |
| East Orange or no (66 replies) |
| Pleasantdale West Orange Nj opinions (15 replies) |
Latest news about races in Orange, NJ collected exclusively by city-data.com from local newspapers, TV, and radio stations
31.3% of Orange, NJ residents are foreign-born (27.2% born in Latin America), which is 26.6% greater than the foreign-born rate of 23.0% across the entire state of New Jersey.
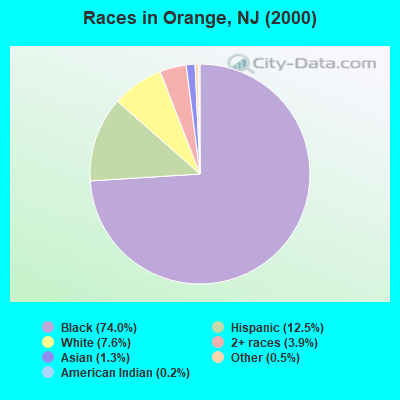
Race distribution in Orange

- 24,31874.0%Black alone
- 4,09712.5%Hispanic
- 2,5027.6%White alone
- 1,2733.9%Two or more races
- 4141.3%Asian alone
- 1680.5%Other race alone
- 790.2%American Indian alone
- 170.05%Native Hawaiian and Other
Pacific Islander alone
2000
2022
-
- 5,557,20966.0%White alone
- 1,117,19113.3%Hispanic
- 1,096,17113.0%Black alone
- 477,0125.7%Asian alone
- 133,6891.6%Two or more races
- 19,5650.2%Other race alone
- 11,3380.1%American Indian alone
- 2,1750.03%Native Hawaiian and Other
Pacific Islander alone

-
- 4,766,47651.5%White alone
- 2,028,47021.9%Hispanic
- 1,111,63212.0%Black alone
- 923,54610.0%Asian alone
- 332,2373.6%Two or more races
- 89,8471.0%Other race alone
- 8,5570.09%American Indian alone
- 9340.01%Native Hawaiian and Other
Pacific Islander alone

Income and house value in Orange
- Median household income in 2022
- $59,565White non-Hispanic householders
- $56,117Black householders
- $27,885American Indian and Alaska Native householders
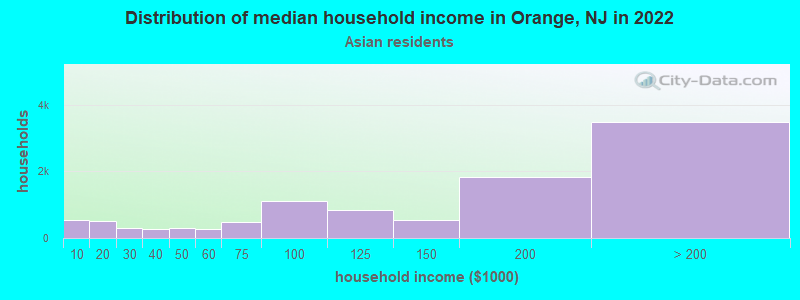
- $86,703Asian householders
- $59,061Some other race householders
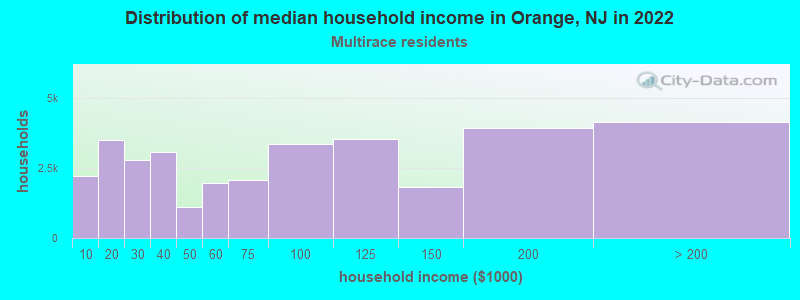
- $78,626Two or more races householders
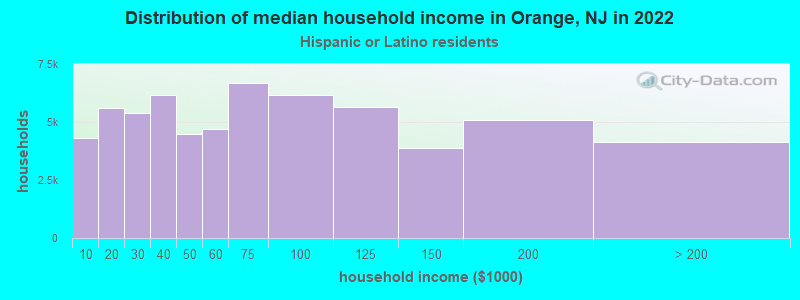
- $58,526Hispanic or Latino race householders
- Median 2022 house value
- $298,715White Non-Hispanic householders
- $354,839Black or African American householders
- $387,884Asian householders
- $300,813Some other race householders
- $411,487Two or more races householders
- $289,274Hispanic or Latino householders
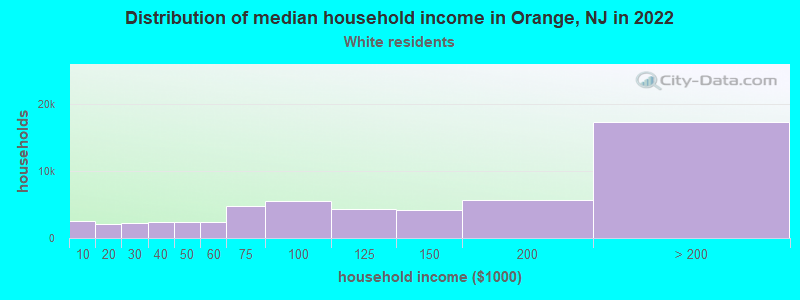
Household income for White non-Hispanic householders
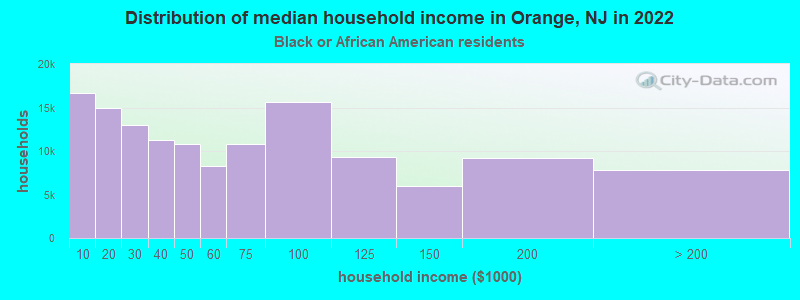
Household income for Black householders
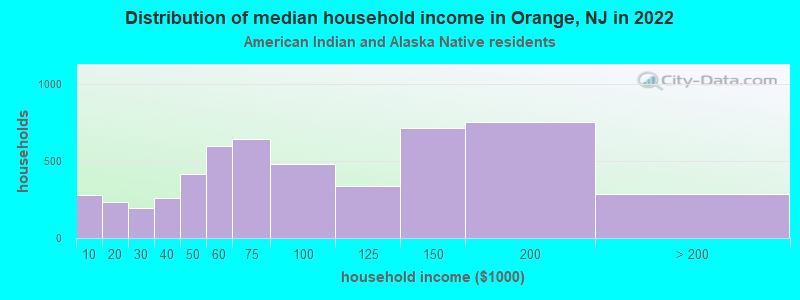
Household income for American Indian and Alaska Native householders
Household income for Asian householders
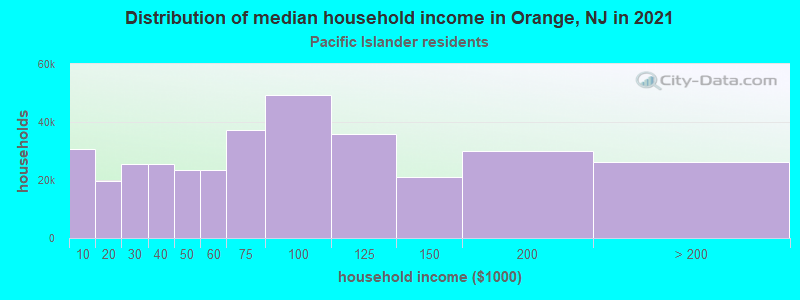
Household income for Native Hawaiian and other Pacific Islander householders
Household income for Two or more races householders
Household income for Hispanic or Latino race householders
Foreign-born residents in Orange
10,293 residents are foreign born (27.2% Latin America).
| This city: | 31.3% |
| New Jersey: | 17.5% |
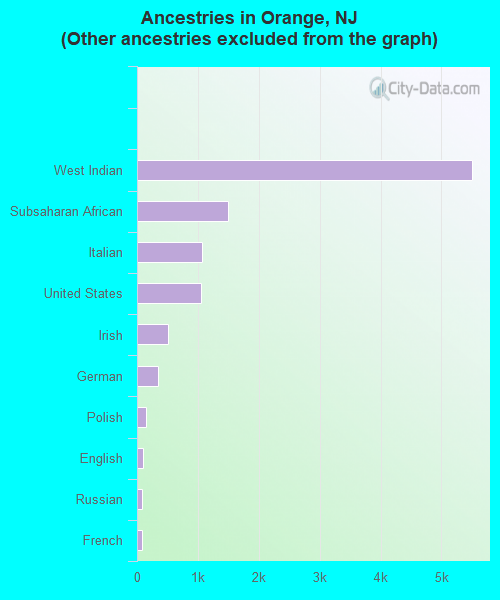
Ancestries in Orange

- 18,01262.9%Other
- 5,50519.2%West Indian
- 1,4925.2%Subsaharan African
- 1,0613.7%Italian
- 1,0513.7%United States
- 5081.8%Irish
- 3401.2%German
- 1400.5%Polish
- 920.3%English
- 820.3%Russian
- 780.3%French
- 460.2%Scottish
- 360.1%Greek
- 320.1%Ukrainian
- 260.09%Arab
- 230.08%Hungarian
- 190.07%Slovak
- 180.06%Swedish
- 160.06%Czech
- 140.05%Dutch
- 130.05%Scotch-Irish
- 110.04%Welsh
- 60.02%Portuguese
- 50.02%Danish
Zip codes: 07050.