Races in Orange, Texas (TX) Detailed Stats
Ancestries, Foreign-born residents, place of birth
Settings
X


Recent posts about races in Orange, Texas on our local forum with over 2,400,000 registered users:
 | Time to Leave Houston? (130 replies) |
| Things To Do Here? (17 replies) |
| Why do we have a public elementary school named Woodrow Wilson Montessori? (70 replies) |
| Potential Relocation to Dallas Area (10 replies) |
| Want land looking at East Texas (10 replies) |
| Houston metro vs. DFW(which cities suburbs are better for families?) (40 replies) |
Latest news about races in Orange, TX collected exclusively by city-data.com from local newspapers, TV, and radio stations
According to 2022 data, the most numerous races in Orange, TX are Hispanic (1,828 residents), White alone (10,644 residents), and Black alone (6,028 residents). 91.0% of Orange residents speak English at home. 4.4% of Orange, TX residents are foreign-born (3.5% born in Latin America, 0.5% born in Asia), which is 289.8% less than the foreign-born rate of 17.0% across the entire state of Texas.
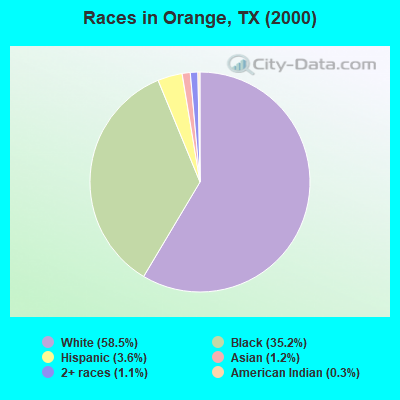
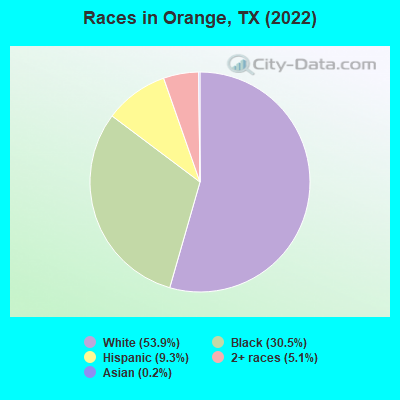
Race distribution in Orange
2000
2022

- 10,90958.5%White alone
- 6,55635.2%Black alone
- 6753.6%Hispanic
- 2181.2%Asian alone
- 2091.1%Two or more races
- 540.3%American Indian alone
- 130.07%Native Hawaiian and Other
Pacific Islander alone - 90.05%Other race alone
-
- 10,64453.9%White alone
- 6,02830.5%Black alone
- 1,8289.3%Hispanic
- 1,0015.1%Two or more races
- 420.2%Asian alone
- 130.07%American Indian alone
2000
2022
-
- 10,933,31352.4%White alone
- 6,669,66632.0%Hispanic
- 2,364,25511.3%Black alone
- 554,4452.7%Asian alone
- 230,5671.1%Two or more races
- 68,8590.3%American Indian alone
- 19,9580.10%Other race alone
- 10,7570.05%Native Hawaiian and Other
Pacific Islander alone

-
- 12,070,64240.2%Hispanic
- 11,683,43038.9%White alone
- 3,508,70611.7%Black alone
- 1,608,1735.4%Asian alone
- 956,5603.2%Two or more races
- 125,7630.4%Other race alone
- 47,0230.2%American Indian alone
- 29,2750.10%Native Hawaiian and Other
Pacific Islander alone

Income and house value in Orange
- Median household income in 2022
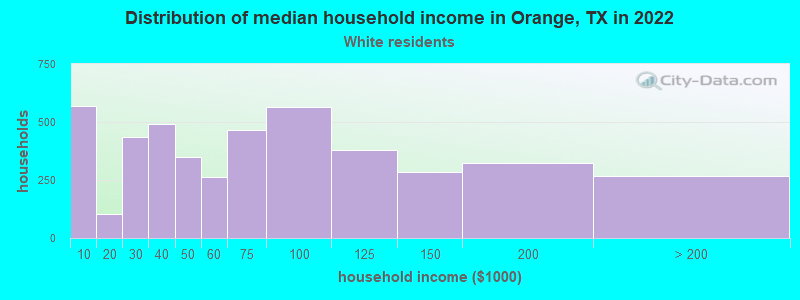
- $63,115White non-Hispanic householders
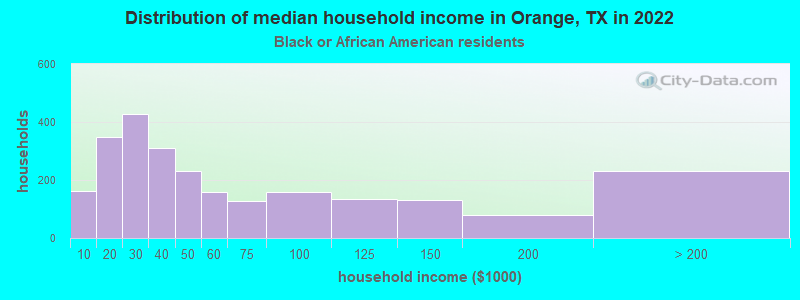
- $32,562Black householders
- $39,319Some other race householders
- $69,414Two or more races householders
- $53,480Hispanic or Latino race householders
- Median 2022 house value
- $200,812White Non-Hispanic householders
- $139,339Black or African American householders
- $256,138American Indian or Alaska Native householders
- $186,810Asian householders
- $153,683Some other race householders
- $247,600Two or more races householders
- $250,333Hispanic or Latino householders
Household income for White non-Hispanic householders
Household income for Black householders
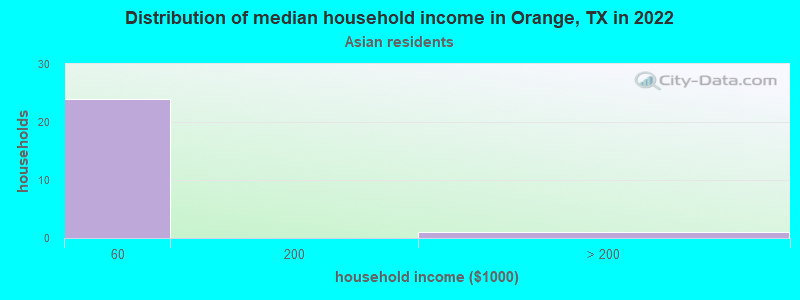
Household income for Asian householders
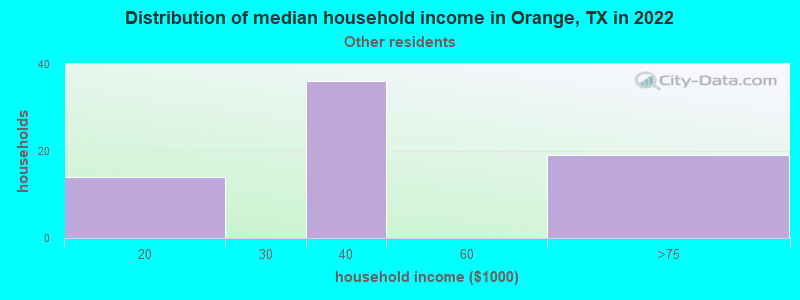
Household income for Some other race householders
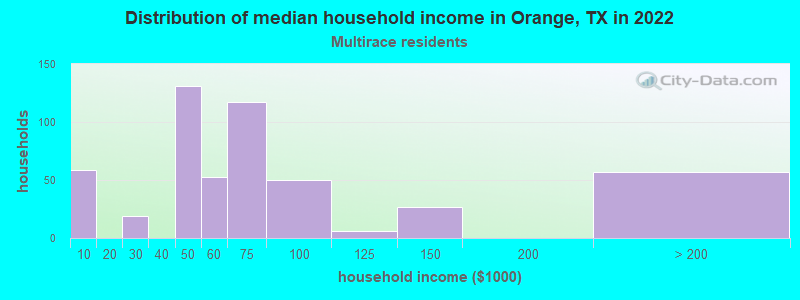
Household income for Two or more races householders
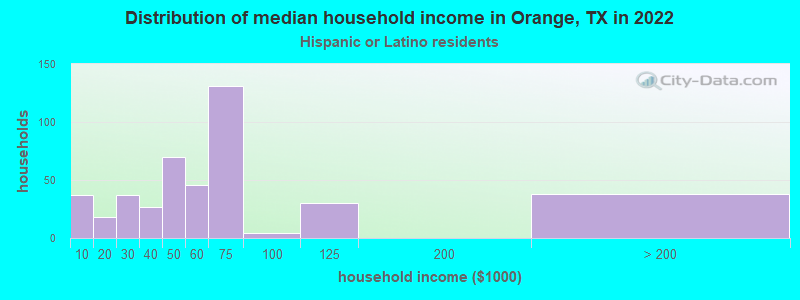
Household income for Hispanic or Latino race householders
Median age by race in Orange
- 37.4Median age for White residents
- 32.5Males
- 42.1Females
- 46.9Median age for Black or African American residents
- 43.8Males
- 61.0Females
- -715,502,554.7Median age for American Indian / Alaska Native residents
- -682,445,758.7Males
- -749,196,140.7Females
- 37.6Median age for Asian residents
- -683,426,442.5Males
- -679,245,282.3Females
- -666,666,666.0Median age for Native Hawaiian / Pacific Islander residents
- -666,666,666.0Males
- -666,666,666.0Females
- 33.9Median age for Other race residents
- 34.0Males
- 32.8Females
- 13.6Median age for Two or more races residents
- 9.7Males
- 17.9Females
- 37.0Median age for White alone residents
- 32.3Males
- 43.7Females
- 25.8Median age for Hispanic or Latino residents
- 25.4Males
- 26.7Females
Owner/renter occupied households by race in Orange
- House owners and renters - White residents
- 2,58259.0%Owner occupied
- 1,79741.0%Renter occupied
- House owners and renters - Black or African American residents
- 85830.3%Owner occupied
- 1,97169.7%Renter occupied
- House owners and renters - Asian residents
- 25100.0%Renter occupied
- House owners and renters - Other race residents
- 4058.8%Owner occupied
- 2841.2%Renter occupied
- House owners and renters - Two or more races residents
- 34872.9%Owner occupied
- 12927.1%Renter occupied
- House owners and renters - White alone residents
- 2,53259.9%Owner occupied
- 1,69540.1%Renter occupied
- House owners and renters - Hispanic or Latino residents
- 39671.4%Owner occupied
- 15928.6%Renter occupied
Language usage in Orange
- English speakers - Total
- 91.0% of residents of Orange speak English at home.
- 7.7% of residents speak Spanish at home
- 84560.4%Speak English very well
- 55339.6%Speak English less than very well
- 1.2% of residents speak other language at home
- 13057.5%Speak English very well
- 9642.5%Speak English less than very well
- English speakers - Born in the United States
- 93.9% of residents of Orange speak English at home.
- 4.1% of residents speak Spanish at home
- 9550.8%Speak English very well
- 9249.2%Speak English less than very well
- 1.7% of residents speak other language at home
- 77100.0%Speak English very well
- English speakers - Native, born elsewhere
- 86.2% of residents of Orange speak English at home.
- 12.5% of residents speak Spanish at home
- 10100.0%Speak English very well
- English speakers - Foreign-born
- 11.2% of residents of Orange speak English at home.
- 80.4% of residents speak Spanish at home
- 44465.8%Speak English very well
- 23134.2%Speak English less than very well
- 8.0% of residents speak other language at home
- 5074.6%Speak English very well
- 1725.4%Speak English less than very well
White (Caucasian) - Speak only English
| Native: | 100.0% (8,910) |
| Foreign-born: | 35.4% (62) |
White (Caucasian) - Speak another language
| Native: | 2.4% (210) |
| Foreign-born: | 70.7% (124) |
Black or African American - Speak only English
| Native: | 97.1% (5,380) |
| Foreign-born: | 10.5% (14) |
Black or African American - Speak another language
| Native: | 2.9% (159) |
| Foreign-born: | 92.9% (121) |
Other race - Speak another language
| Native: | 21.8% (22) |
| Foreign-born: | 99.5% (106) |
Two or more races - Speak another language
| Native: | 19.3% (313) |
| Foreign-born: | 100.0% (209) |
White alone - Speak only English
| Native: | 98.0% (9,458) |
| Foreign-born: | 23.3% (73) |
White alone - Speak another language
| Native: | 2.0% (194) |
| Foreign-born: | 76.6% (242) |
Hispanic or Latino - Speak another language
| Native: | 45.2% (476) |
| Foreign-born: | 100.0% (790) |
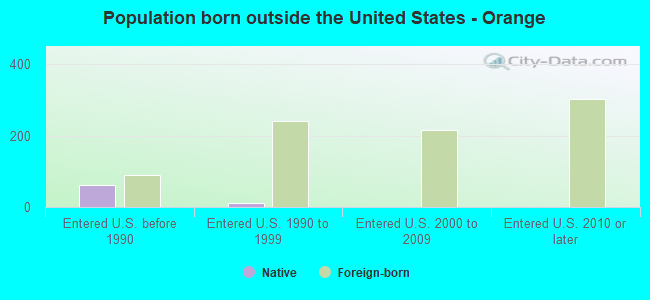
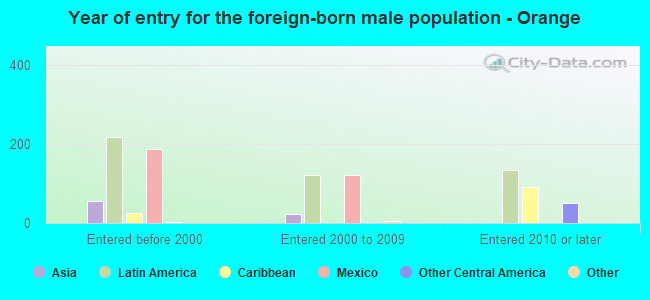
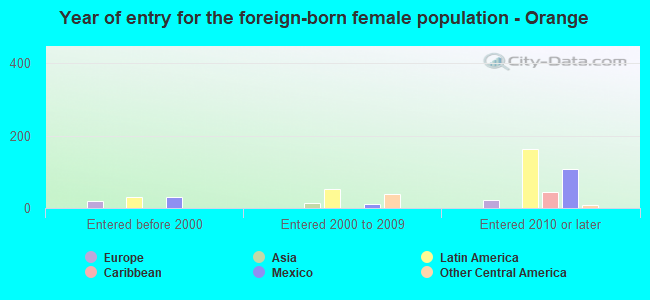
Foreign-born residents in Orange
840 residents are foreign born (3.5% Latin America, 0.5% Asia).
| This city: | 4.4% |
| Texas: | 17.1% |

Marital status for residents in Orange
Marital status - White (Caucasian) population 15 years and over
- Males
- 36.6%Never married
- 48.6%Now married
- 1.1%Separated
- 4.1%Widowed
- 9.6%Divorced
- Females
- 26.0%Never married
- 40.8%Now married
- 0.5%Separated
- 11.5%Widowed
- 21.2%Divorced
Women who gave birth in the past 12 months
| Now married: | 46.6% (54) |
| Unmarried: | 53.4% (62) |
Women who did not give birth in the past 12 months
| Now married: | 38.2% (930) |
| Unmarried: | 61.8% (1,502) |
Marital status - Black or African American population 15 years and over
- Males
- 45.0%Never married
- 34.6%Now married
- 9.0%Separated
- 1.7%Widowed
- 9.7%Divorced
- Females
- 41.0%Never married
- 29.8%Now married
- 4.2%Separated
- 12.4%Widowed
- 12.7%Divorced
Women who gave birth in the past 12 months
| Now married: | 36.0% (55) |
| Unmarried: | 64.0% (97) |
Women who did not give birth in the past 12 months
| Now married: | 18.6% (264) |
| Unmarried: | 81.4% (1,158) |
Marital status - American Indian / Alaska Native population 15 years and over
- Males
- 0.0%Never married
- 100.0%Now married
- 0.0%Separated
- 0.0%Widowed
- 0.0%Divorced
- Females
- 0.0%Never married
- 100.0%Now married
- 0.0%Separated
- 0.0%Widowed
- 0.0%Divorced
Marital status - Asian population 15 years and over
- Males
- 0.0%Never married
- 100.0%Now married
- 0.0%Separated
- 0.0%Widowed
- 0.0%Divorced
- Females
- 0.0%Never married
- 100.0%Now married
- 0.0%Separated
- 0.0%Widowed
- 0.0%Divorced
Marital status - Other race population 15 years and over
- Males
- 39.8%Never married
- 60.2%Now married
- 0.0%Separated
- 0.0%Widowed
- 0.0%Divorced
- Females
- 40.0%Never married
- 51.4%Now married
- 0.0%Separated
- 8.6%Widowed
- 0.0%Divorced
Women who did not give birth in the past 12 months
| Now married: | 56.2% (49) |
| Unmarried: | 43.8% (38) |
Marital status - Two or more races population 15 years and over
- Males
- 23.8%Never married
- 63.0%Now married
- 0.0%Separated
- 10.2%Widowed
- 2.9%Divorced
- Females
- 28.4%Never married
- 59.7%Now married
- 2.2%Separated
- 4.4%Widowed
- 5.4%Divorced
Women who gave birth in the past 12 months
| Now married: | 100.0% (104) |
| Unmarried: | 0.0% (0) |
Women who did not give birth in the past 12 months
| Now married: | 48.7% (238) |
| Unmarried: | 51.3% (251) |
Marital status - White alone, not Hispanic / Latino population 15 years and over
- Males
- 35.5%Never married
- 49.8%Now married
- 0.0%Separated
- 4.4%Widowed
- 10.3%Divorced
- Females
- 25.8%Never married
- 40.6%Now married
- 0.6%Separated
- 11.9%Widowed
- 21.2%Divorced
Women who gave birth in the past 12 months
| Now married: | 46.6% (55) |
| Unmarried: | 53.4% (64) |
Women who did not give birth in the past 12 months
| Now married: | 38.0% (887) |
| Unmarried: | 62.0% (1,447) |
Marital status - Hispanic or Latino population 15 years and over
- Males
- 34.8%Never married
- 52.3%Now married
- 6.3%Separated
- 6.0%Widowed
- 0.7%Divorced
- Females
- 33.6%Never married
- 59.0%Now married
- 0.0%Separated
- 1.1%Widowed
- 6.3%Divorced
Women who gave birth in the past 12 months
| Now married: | 100.0% (50) |
| Unmarried: | 0.0% (0) |
Women who did not give birth in the past 12 months
| Now married: | 52.5% (248) |
| Unmarried: | 47.5% (225) |
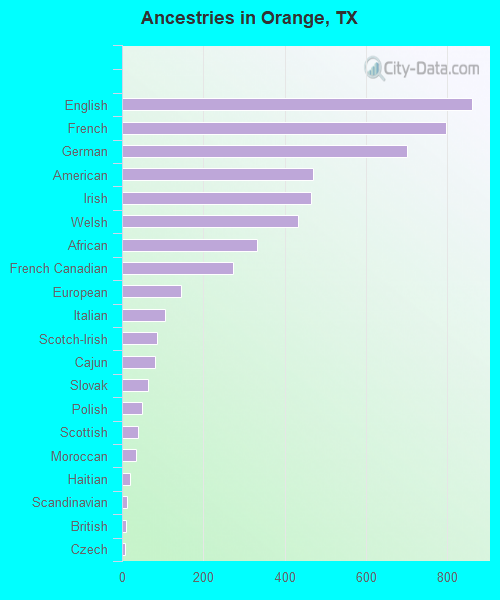
Ancestries in Orange

- 8608.0%English
- 7967.4%French
- 7026.5%German
- 4714.4%American
- 4644.3%Irish
- 4324.0%Welsh
- 3323.1%African
- 2732.5%French Canadian
- 1451.3%European
- 1061.0%Italian
- 850.8%Scotch-Irish
- 810.7%Cajun
- 640.6%Slovak
- 500.5%Polish
- 400.4%Scottish
- 340.3%Moroccan
- 200.2%Haitian
- 130.1%Scandinavian
- 90.08%British
- 80.07%Czech
- 70.06%Northern European
- 60.06%Norwegian
- 60.06%Swedish
- 50.05%Hungarian
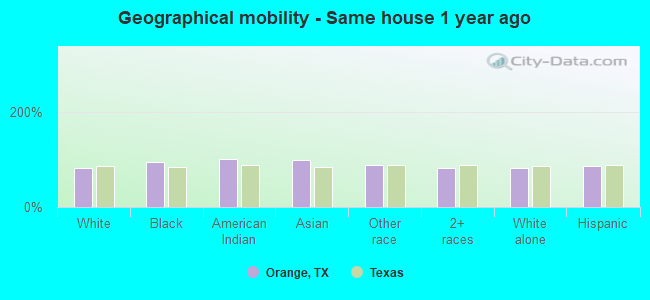
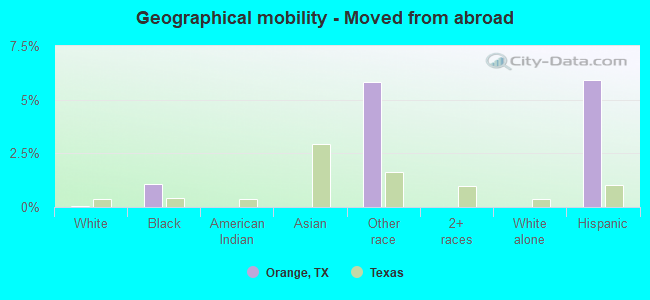
Geographical mobility in Orange

- Same house 1 year ago
- 8,58880.8%White (Caucasian)
- 5,67094.9%Black or African American
- 21100.0%American Indian / Alaska Native
- 4299.3%Asian
- 20388.1%Other race
- 2,10081.9%Two or more races
- 8,32180.7%White alone, not Hispanic / Latino
- 1,49086.2%Hispanic or Latino
-
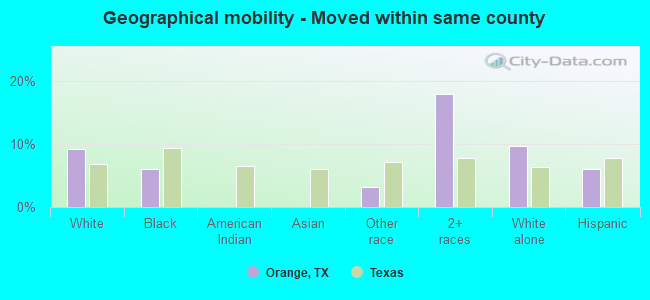
- Moved within same county
- 9739.2%White / Caucasian
- 3555.9%Black or African American
- 73.2%Other race
- 46017.9%Two or more races
- 9909.6%White alone, not Hispanic / Latino
- 1056.1%Hispanic or Latino
-
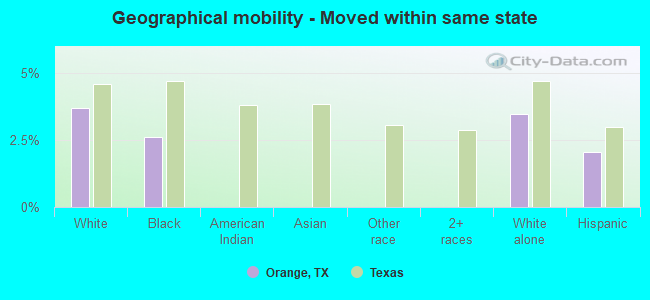
- Moved within same state
- 3923.7%White / Caucasian
- 1572.6%Black or African American
- 3583.5%White alone, not Hispanic / Latino
- 352.0%Hispanic or Latino
-
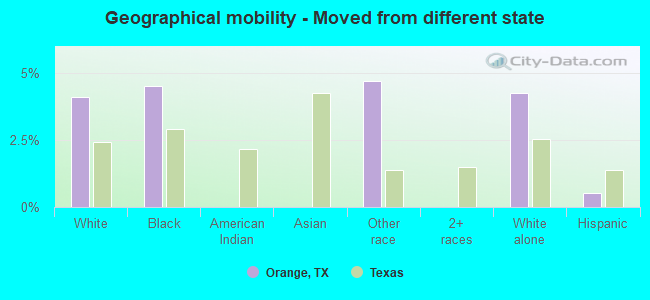
- Moved from different state
- 4364.1%White / Caucasian
- 2704.5%Black or African American
- 114.7%Other race
- 4374.2%White alone, not Hispanic / Latino
- 90.5%Hispanic or Latino
-
- Moved from abroad
- 70.1%White
- 641.1%Black or African American
- 135.8%Other race
- 1025.9%Hispanic or Latino
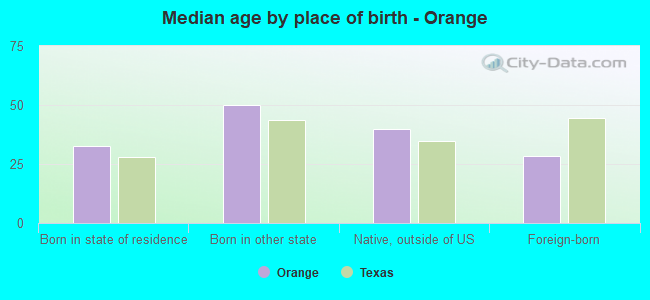
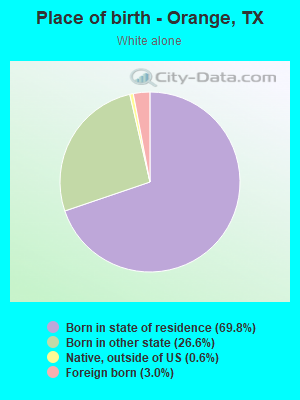
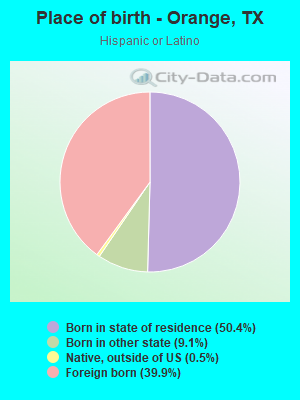
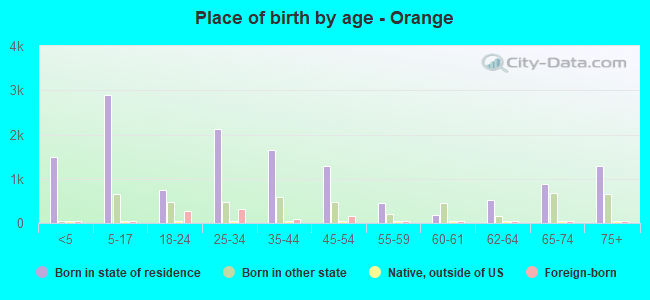
Children Nativity (place of birth) in Orange
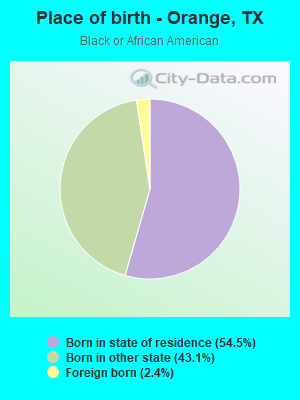
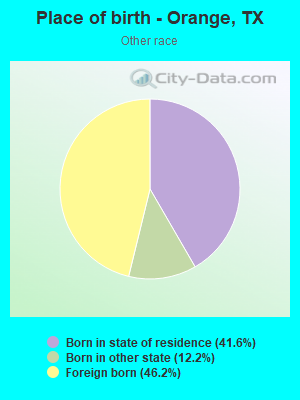
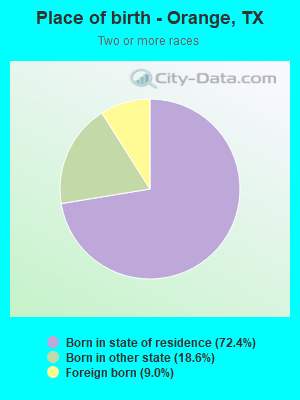
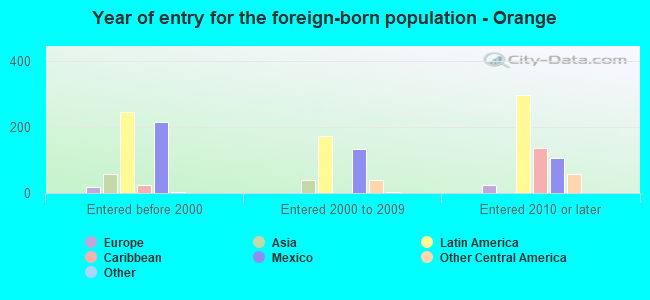
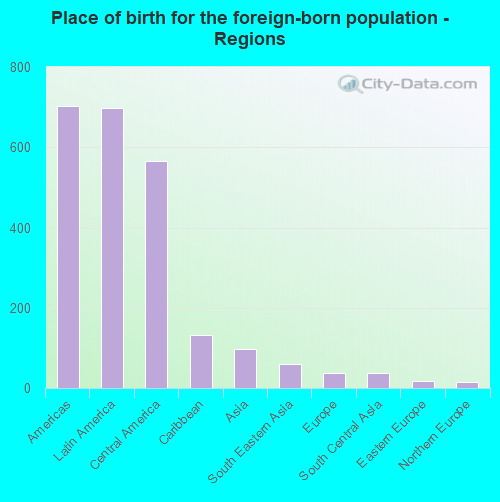
Place of birth for residents in Orange
![Place of birth for the foreign-born population - Regions]()
- 704Americas
- 699Latin America
- 565Central America
- 133Caribbean
- 97Asia
- 59South Eastern Asia
- 38Europe
- 37South Central Asia
- 18Eastern Europe
- 14Northern Europe
- 5Southern Europe
- 5Northern America
- 1Western Asia
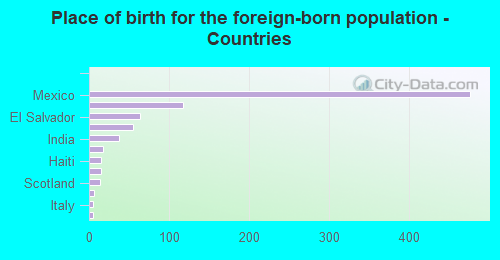
![Place of birth for the foreign-born population - Countries]()
- 476Mexico
- 118Dominican Republic
- 64El Salvador
- 55Cambodia
- 37India
- 18Czechoslovakia
- 15Haiti
- 15Guatemala
- 14Scotland
- 6Honduras
- 5Italy
- 5Canada
- 3Vietnam
- 3Panama
- 1Syria
Grandparents responsible for own grandchildren in Orange
Zip codes: 77630.