Races in Oxford, Ohio (OH) Detailed Stats
Data:
Races - White alone (%)
Races - White alone (% change since 2000)
Races - Black alone (%)
Races - Black alone (% change since 2000)
Races - American Indian alone (%)
Races - American Indian alone (% change since 2000)
Races - Asian alone (%)
Races - Asian alone (% change since 2000)
Races - Hispanic (%)
Races - Hispanic (% change since 2000)
Races - Native Hawaiian and Other Pacific Islander alone (%)
Races - Native Hawaiian and Other Pacific Islander alone (% change since 2000)
Races - Two or more races(%)
Races - Two or more races(% change since 2000)
Races - Other race alone (%)
Races - Other race alone (% change since 2000)
Racial diversity
Place of birth - Born in state of residence (%)
Place of birth - Born in state of residence (%) - White
Place of birth - Born in state of residence (%) - Black or African American
Place of birth - Born in state of residence (%) - Asian
Place of birth - Born in state of residence (%) - Hispanic or Latino
Place of birth - Born in state of residence (%) - American Indian and Alaska Native
Place of birth - Born in state of residence (%) - Multirace
Place of birth - Born in state of residence (%) - Other Race
Place of birth - Born in other state (%)
Place of birth - Born in other state (%) - White
Place of birth - Born in other state (%) - Black or African American
Place of birth - Born in other state (%) - Asian
Place of birth - Born in other state (%) - Hispanic or Latino
Place of birth - Born in other state (%) - American Indian and Alaska Native
Place of birth - Born in other state (%) - Multirace
Place of birth - Born in other state (%) - Other Race
Place of birth - Native, outside of US (%)
Place of birth - Native, outside of US (%) - White
Place of birth - Native, outside of US (%) - Black or African American
Place of birth - Native, outside of US (%) - Asian
Place of birth - Native, outside of US (%) - Hispanic or Latino
Place of birth - Native, outside of US (%) - American Indian and Alaska Native
Place of birth - Native, outside of US (%) - Multirace
Place of birth - Native, outside of US (%) - Other Race
Place of birth - Foreign born (%)
Place of birth - Foreign born (%) - White
Place of birth - Foreign born (%) - Black or African American
Place of birth - Foreign born (%) - Asian
Place of birth - Foreign born (%) - Hispanic or Latino
Place of birth - Foreign born (%) - American Indian and Alaska Native
Place of birth - Foreign born (%) - Multirace
Place of birth - Foreign born (%) - Other Race
Residents speaking English at home (%)
Residents speaking English at home - Born in the United States (%)
Residents speaking English at home - Native, born elsewhere (%)
Residents speaking English at home - Foreign born (%)
Residents speaking Spanish at home (%)
Residents speaking Spanish at home - Born in the United States (%)
Residents speaking Spanish at home - Native, born elsewhere (%)
Residents speaking Spanish at home - Foreign born (%)
Residents speaking other language at home (%)
Residents speaking other language at home - Born in the United States (%)
Residents speaking other language at home - Native, born elsewhere (%)
Residents speaking other language at home - Foreign born (%)
Marital status - Never married (%)
Marital status - Now married (%)
Marital status - Separated (%)
Marital status - Widowed (%)
Marital status - Divorced (%)
Ancestries Reported - Arab (%)
Ancestries Reported - Czech (%)
Ancestries Reported - Danish (%)
Ancestries Reported - Dutch (%)
Ancestries Reported - English (%)
Ancestries Reported - French (%)
Ancestries Reported - French Canadian (%)
Ancestries Reported - German (%)
Ancestries Reported - Greek (%)
Ancestries Reported - Hungarian (%)
Ancestries Reported - Irish (%)
Ancestries Reported - Italian (%)
Ancestries Reported - Lithuanian (%)
Ancestries Reported - Norwegian (%)
Ancestries Reported - Polish (%)
Ancestries Reported - Portuguese (%)
Ancestries Reported - Russian (%)
Ancestries Reported - Scotch-Irish (%)
Ancestries Reported - Scottish (%)
Ancestries Reported - Slovak (%)
Ancestries Reported - Subsaharan African (%)
Ancestries Reported - Swedish (%)
Ancestries Reported - Swiss (%)
Ancestries Reported - Ukrainian (%)
Ancestries Reported - United States (%)
Ancestries Reported - Welsh (%)
Ancestries Reported - West Indian (%)
Ancestries Reported - Other (%)
Geographical mobility - Same house 1 year ago (%)
Geographical mobility - Same house 1 year ago (%) - White
Geographical mobility - Same house 1 year ago (%) - Black or African American
Geographical mobility - Same house 1 year ago (%) - Asian
Geographical mobility - Same house 1 year ago (%) - Hispanic or Latino
Geographical mobility - Same house 1 year ago (%) - American Indian and Alaska Native
Geographical mobility - Same house 1 year ago (%) - Multirace
Geographical mobility - Same house 1 year ago (%) - Other Race
Geographical mobility - Moved within same county (%)
Geographical mobility - Moved within same county (%) - White
Geographical mobility - Moved within same county (%) - Black or African American
Geographical mobility - Moved within same county (%) - Asian
Geographical mobility - Moved within same county (%) - Hispanic or Latino
Geographical mobility - Moved within same county (%) - American Indian and Alaska Native
Geographical mobility - Moved within same county (%) - Multirace
Geographical mobility - Moved within same county (%) - Other Race
Geographical mobility - Moved from different county within same state (%)
Geographical mobility - Moved from different county within same state (%) - White
Geographical mobility - Moved from different county within same state (%) - Black or African American
Geographical mobility - Moved from different county within same state (%) - Asian
Geographical mobility - Moved from different county within same state (%) - Hispanic or Latino
Geographical mobility - Moved from different county within same state (%) - American Indian and Alaska Native
Geographical mobility - Moved from different county within same state (%) - Multirace
Geographical mobility - Moved from different county within same state (%) - Other Race
Geographical mobility - Moved from different state (%)
Geographical mobility - Moved from different state (%) - White
Geographical mobility - Moved from different state (%) - Black or African American
Geographical mobility - Moved from different state (%) - Asian
Geographical mobility - Moved from different state (%) - Hispanic or Latino
Geographical mobility - Moved from different state (%) - American Indian and Alaska Native
Geographical mobility - Moved from different state (%) - Multirace
Geographical mobility - Moved from different state (%) - Other Race
Geographical mobility - Moved from abroad (%)
Geographical mobility - Moved from abroad (%) - White
Geographical mobility - Moved from abroad (%) - Black or African American
Geographical mobility - Moved from abroad (%) - Asian
Geographical mobility - Moved from abroad (%) - Hispanic or Latino
Geographical mobility - Moved from abroad (%) - American Indian and Alaska Native
Geographical mobility - Moved from abroad (%) - Multirace
Geographical mobility - Moved from abroad (%) - Other Race
Place of birth for the foreign-born population - Ireland (%)
Place of birth for the foreign-born population - Denmark (%)
Place of birth for the foreign-born population - Norway (%)
Place of birth for the foreign-born population - Sweden (%)
Place of birth for the foreign-born population - United Kingdom (%)
Place of birth for the foreign-born population - England (%)
Place of birth for the foreign-born population - Scotland (%)
Place of birth for the foreign-born population - Other Northern Europe (%)
Place of birth for the foreign-born population - Austria (%)
Place of birth for the foreign-born population - Belgium (%)
Place of birth for the foreign-born population - France (%)
Place of birth for the foreign-born population - Germany (%)
Place of birth for the foreign-born population - Netherlands (%)
Place of birth for the foreign-born population - Switzerland (%)
Place of birth for the foreign-born population - Other Western Europe (%)
Place of birth for the foreign-born population - Greece (%)
Place of birth for the foreign-born population - Italy (%)
Place of birth for the foreign-born population - Portugal (%)
Place of birth for the foreign-born population - Spain (%)
Place of birth for the foreign-born population - Other Southern Europe (%)
Place of birth for the foreign-born population - Albania (%)
Place of birth for the foreign-born population - Belarus (%)
Place of birth for the foreign-born population - Bosnia and Herzegovina (%)
Place of birth for the foreign-born population - Bulgaria (%)
Place of birth for the foreign-born population - Croatia (%)
Place of birth for the foreign-born population - Czechoslovakia (%)
Place of birth for the foreign-born population - Hungary (%)
Place of birth for the foreign-born population - Latvia (%)
Place of birth for the foreign-born population - Lithuania (%)
Place of birth for the foreign-born population - North Macedonia (Macedonia) (%)
Place of birth for the foreign-born population - Moldova (%)
Place of birth for the foreign-born population - Poland (%)
Place of birth for the foreign-born population - Romania (%)
Place of birth for the foreign-born population - Russia (%)
Place of birth for the foreign-born population - Serbia (%)
Place of birth for the foreign-born population - Ukraine (%)
Place of birth for the foreign-born population - Other Eastern Europe (%)
Place of birth for the foreign-born population - China (%)
Place of birth for the foreign-born population - Hong Kong (%)
Place of birth for the foreign-born population - Taiwan (%)
Place of birth for the foreign-born population - Japan (%)
Place of birth for the foreign-born population - Korea (%)
Place of birth for the foreign-born population - Other Eastern Asia (%)
Place of birth for the foreign-born population - Afghanistan (%)
Place of birth for the foreign-born population - Bangladesh (%)
Place of birth for the foreign-born population - India (%)
Place of birth for the foreign-born population - Iran (%)
Place of birth for the foreign-born population - Kazakhstan (%)
Place of birth for the foreign-born population - Nepal (%)
Place of birth for the foreign-born population - Pakistan (%)
Place of birth for the foreign-born population - Sri Lanka (%)
Place of birth for the foreign-born population - Uzbekistan (%)
Place of birth for the foreign-born population - Other South Central Asia (%)
Place of birth for the foreign-born population - Burma (%)
Place of birth for the foreign-born population - Cambodia (%)
Place of birth for the foreign-born population - Indonesia (%)
Place of birth for the foreign-born population - Laos (%)
Place of birth for the foreign-born population - Malaysia (%)
Place of birth for the foreign-born population - Philippines (%)
Place of birth for the foreign-born population - Singapore (%)
Place of birth for the foreign-born population - Thailand (%)
Place of birth for the foreign-born population - Vietnam (%)
Place of birth for the foreign-born population - Other South Eastern Asia (%)
Place of birth for the foreign-born population - Armenia (%)
Place of birth for the foreign-born population - Iraq (%)
Place of birth for the foreign-born population - Israel (%)
Place of birth for the foreign-born population - Jordan (%)
Place of birth for the foreign-born population - Kuwait (%)
Place of birth for the foreign-born population - Lebanon (%)
Place of birth for the foreign-born population - Saudi Arabia (%)
Place of birth for the foreign-born population - Syria (%)
Place of birth for the foreign-born population - Turkey (%)
Place of birth for the foreign-born population - Yemen (%)
Place of birth for the foreign-born population - Other Western Asia (%)
Place of birth for the foreign-born population - Eritrea (%)
Place of birth for the foreign-born population - Ethiopia (%)
Place of birth for the foreign-born population - Kenya (%)
Place of birth for the foreign-born population - Somalia (%)
Place of birth for the foreign-born population - Uganda (%)
Place of birth for the foreign-born population - Zimbabwe (%)
Place of birth for the foreign-born population - Other Eastern Africa (%)
Place of birth for the foreign-born population - Cameroon (%)
Place of birth for the foreign-born population - Congo (%)
Place of birth for the foreign-born population - Democratic Republic of Congo (Zaire) (%)
Place of birth for the foreign-born population - Other Middle Africa (%)
Place of birth for the foreign-born population - Egypt (%)
Place of birth for the foreign-born population - Morocco (%)
Place of birth for the foreign-born population - Sudan (%)
Place of birth for the foreign-born population - Other Northern Africa (%)
Place of birth for the foreign-born population - South Africa (%)
Place of birth for the foreign-born population - Other Southern Africa (%)
Place of birth for the foreign-born population - Cabo Verde (%)
Place of birth for the foreign-born population - Ghana (%)
Place of birth for the foreign-born population - Liberia (%)
Place of birth for the foreign-born population - Nigeria (%)
Place of birth for the foreign-born population - Senegal (%)
Place of birth for the foreign-born population - Sierra Leone (%)
Place of birth for the foreign-born population - Other Western Africa (%)
Place of birth for the foreign-born population - Australia (%)
Place of birth for the foreign-born population - New Zealand (%)
Place of birth for the foreign-born population - Fiji (%)
Place of birth for the foreign-born population - Micronesia (%)
Place of birth for the foreign-born population - Bahamas (%)
Place of birth for the foreign-born population - Barbados (%)
Place of birth for the foreign-born population - Cuba (%)
Place of birth for the foreign-born population - Dominica (%)
Place of birth for the foreign-born population - Dominican Republic (%)
Place of birth for the foreign-born population - Grenada (%)
Place of birth for the foreign-born population - Haiti (%)
Place of birth for the foreign-born population - Jamaica (%)
Place of birth for the foreign-born population - St. Vincent and the Grenadines (%)
Place of birth for the foreign-born population - Trinidad and Tobago (%)
Place of birth for the foreign-born population - West Indies (%)
Place of birth for the foreign-born population - Other Caribbean (%)
Place of birth for the foreign-born population - Belize (%)
Place of birth for the foreign-born population - Costa Rica (%)
Place of birth for the foreign-born population - El Salvador (%)
Place of birth for the foreign-born population - Guatemala (%)
Place of birth for the foreign-born population - Honduras (%)
Place of birth for the foreign-born population - Mexico (%)
Place of birth for the foreign-born population - Nicaragua (%)
Place of birth for the foreign-born population - Panama (%)
Place of birth for the foreign-born population - Other Central America (%)
Place of birth for the foreign-born population - Argentina (%)
Place of birth for the foreign-born population - Bolivia (%)
Place of birth for the foreign-born population - Brazil (%)
Place of birth for the foreign-born population - Chile (%)
Place of birth for the foreign-born population - Colombia (%)
Place of birth for the foreign-born population - Ecuador (%)
Place of birth for the foreign-born population - Guyana (%)
Place of birth for the foreign-born population - Peru (%)
Place of birth for the foreign-born population - Uruguay (%)
Place of birth for the foreign-born population - Venezuela (%)
Place of birth for the foreign-born population - Other South America (%)
Place of birth for the foreign-born population - Canada (%)
Place of birth for the foreign-born population - Other Northern America (%)
Place of birth for the foreign-born population - Other (%)
Latest news about races in Oxford, OH collected exclusively by city-data.com from local newspapers, TV, and radio stations
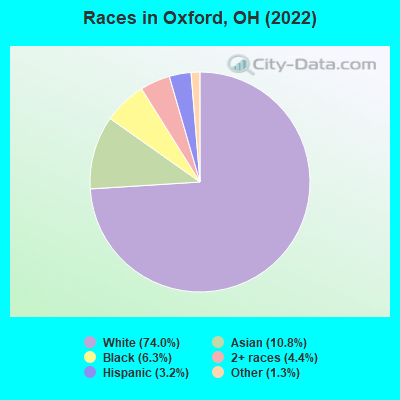
According to 2022 data, the most numerous races in Oxford, OH are White alone (16,318 residents), Black alone (1,393 residents), and Two or more races (973 residents). 86.2% of Oxford residents speak English at home. 13.8% of Oxford, OH residents are foreign-born (11.5% born in Asia), which is 71.1% greater than the foreign-born rate of 4.0% across the entire state of Ohio.
Race distribution in Oxford
2000 2022
9,538,111 84.0% White alone 1,290,662 11.4% Black alone 217,123 1.9% Hispanic 137,770 1.2% Two or more races 131,670 1.2% Asian alone 21,985 0.2% American Indian alone 13,483 0.1% Other race alone 2,336 0.02% Native Hawaiian and Other
8,948,793 76.1% White alone 1,401,403 11.9% Black alone 529,291 4.5% Two or more races 517,232 4.4% Hispanic 293,387 2.5% Asian alone 52,805 0.4% Other race alone 9,785 0.08% American Indian alone 3,362 0.03% Native Hawaiian and Other
Income and house value in Oxford Median household income in 2022 $48,153 White non-Hispanic householders$24,628 Asian householders$30,251 Some other race householders$48,085 Two or more races householdersMedian 2022 house value $277,951 White Non-Hispanic householders$224,142 Black or African American householders$108,806 American Indian or Alaska Native householders $222,559 Asian householders$272,017 Some other race householders$370,932 Two or more races householders
Median age by race in Oxford
21.3 Median age for White residents21.5 21.4 20.8 Median age for Black or African American residents24.9 19.3 -676,818,950.3 Median age for American Indian / Alaska Native residents-685,185,184.5 -658,163,264.6 22.2 Median age for Asian residents22.8 21.8 -749,999,999.2 Median age for Native Hawaiian / Pacific Islander residents-750,242,953.6 -805,394,989.6 23.2 Median age for Other race residents23.7 27.5 23.3 Median age for Two or more races residents24.1 23.4 21.2 Median age for White alone residents21.5 21.1 21.7 Median age for Hispanic or Latino residents22.9 20.2
Owner/renter occupied households by race in Oxford
House owners and renters - White residents 1,930 42.9% Owner occupied2,572 57.1% Renter occupiedHouse owners and renters - Black or African American residents 66 15.4% Owner occupied362 84.6% Renter occupiedHouse owners and renters - Asian residents 239 49.4% Owner occupied245 50.6% Renter occupiedHouse owners and renters - Other race residents 100 100.0% Renter occupiedHouse owners and renters - Two or more races residents 124 41.8% Owner occupied173 58.2% Renter occupiedHouse owners and renters - White alone residents 1,947 42.9% Owner occupied2,593 57.1% Renter occupiedHouse owners and renters - Hispanic or Latino residents 28 15.3% Owner occupied154 84.7% Renter occupied
Language usage in Oxford
English speakers - Total 86.2% of residents of Oxford speak English at home.
2.0% of residents speak Spanish at home 354 80.6% Speak English very well85 19.4% Speak English less than very well12.3% of residents speak other language at home 936 35.3% Speak English very well1,713 64.7% Speak English less than very well
English speakers - Born in the United States 95.2% of residents of Oxford speak English at home.
1.9% of residents speak Spanish at home 119 100.0% Speak English very well2.1% of residents speak other language at home 110 86.6% Speak English very well17 13.4% Speak English less than very well
English speakers - Native, born elsewhere 70.2% of residents of Oxford speak English at home.
9.3% of residents speak Spanish at home 21 100.0% Speak English less than very well4.9% of residents speak other language at home 11 100.0% Speak English very well
English speakers - Foreign-born 23.8% of residents of Oxford speak English at home.
3.3% of residents speak Spanish at home 50 46.7% Speak English very well57 53.3% Speak English less than very well71.0% of residents speak other language at home 637 28.0% Speak English very well1,635 72.0% Speak English less than very well
White (Caucasian) - Speak only English Native:
99.1% (15,295)Foreign-born:
54.5% (198)
White (Caucasian) - Speak another language Native:
1.0% (154)Foreign-born:
100.0% (364)
Black or African American - Speak only English Native:
93.9% (1,198)Foreign-born:
33.4% (35)
Black or African American - Speak another language Native:
7.2% (92)Foreign-born:
65.3% (69)
Asian - Speak only English Native:
50.2% (182)Foreign-born:
18.4% (371)
Asian - Speak another language Native:
46.4% (168)Foreign-born:
80.6% (1,625)
Other race - Speak only English Native:
68.4% (198)Foreign-born:
11.7% (34)
Other race - Speak another language Native:
24.1% (70)Foreign-born:
68.8% (202)
Two or more races - Speak another language Native:
3.7% (38)Foreign-born:
100.0% (76)
White alone - Speak only English Native:
98.8% (15,037)Foreign-born:
37.6% (209)
White alone - Speak another language Native:
1.2% (188)Foreign-born:
53.3% (296)
Hispanic or Latino - Speak another language Native:
20.1% (95)Foreign-born:
92.1% (88)
Foreign-born residents in Oxford 3,052 residents are foreign born (11.5% Asia ).
Marital status for residents in Oxford Marital status - White (Caucasian) population 15 years and over
Males 73.7% Never married21.6% Now married0.5% Separated1.4% Widowed2.8% DivorcedFemales 71.4% Never married19.9% Now married0.5% Separated4.1% Widowed4.1% DivorcedWomen who gave birth in the past 12 months Now married:
100.0% (33)Unmarried:
0.0% (0)
Women who did not give birth in the past 12 months Now married:
11.3% (697)Unmarried:
88.7% (5,486)
Marital status - Black or African American population 15 years and over
Males 64.4% Never married32.8% Now married0.0% Separated0.0% Widowed2.8% DivorcedFemales 74.7% Never married22.7% Now married0.0% Separated0.0% Widowed2.6% DivorcedWomen who did not give birth in the past 12 months Now married:
12.8% (92)Unmarried:
87.2% (628)
Marital status - Asian population 15 years and over
Males 81.8% Never married12.1% Now married0.0% Separated4.9% Widowed1.2% DivorcedFemales 68.9% Never married21.9% Now married8.2% Separated1.0% Widowed0.0% DivorcedWomen who did not give birth in the past 12 months Now married:
26.7% (295)Unmarried:
73.3% (811)
Marital status - Other race population 15 years and over
Males 84.2% Never married0.0% Now married5.1% Separated0.0% Widowed10.8% DivorcedFemales 65.7% Never married26.3% Now married0.0% Separated0.0% Widowed8.0% DivorcedWomen who gave birth in the past 12 months Now married:
100.0% (38)Unmarried:
0.0% (0)
Women who did not give birth in the past 12 months Now married:
0.0% (0)Unmarried:
100.0% (200)
Marital status - Two or more races population 15 years and over
Males 71.8% Never married19.9% Now married0.0% Separated0.0% Widowed8.3% DivorcedFemales 90.2% Never married2.3% Now married0.0% Separated6.5% Widowed1.0% DivorcedWomen who did not give birth in the past 12 months Now married:
0.0% (0)Unmarried:
100.0% (612)
Marital status - White alone, not Hispanic / Latino population 15 years and over
Males 73.0% Never married22.2% Now married0.5% Separated1.4% Widowed2.9% DivorcedFemales 71.0% Never married20.3% Now married0.5% Separated4.1% Widowed4.2% DivorcedWomen who gave birth in the past 12 months Now married:
100.0% (34)Unmarried:
0.0% (0)
Women who did not give birth in the past 12 months Now married:
11.6% (716)Unmarried:
88.4% (5,452)
Marital status - Hispanic or Latino population 15 years and over
Males 88.4% Never married0.0% Now married0.0% Separated0.0% Widowed11.6% DivorcedFemales 81.0% Never married10.7% Now married0.0% Separated4.5% Widowed3.8% DivorcedWomen who did not give birth in the past 12 months Now married:
0.0% (0)Unmarried:
100.0% (287)
Ancestries in Oxford
1,101 9.3% German561 4.8% English404 3.4% European275 2.3% American200 1.7% Irish170 1.4% Italian119 1.0% Eastern European101 0.9% Russian98 0.8% Nigerian75 0.6% Polish70 0.6% Egyptian51 0.4% Kenyan47 0.4% Slovene37 0.3% Scottish37 0.3% African30 0.3% Iranian30 0.3% Jamaican29 0.2% British28 0.2% Romanian26 0.2% Northern European24 0.2% Scotch-Irish23 0.2% Swedish23 0.2% Bermudan22 0.2% Danish22 0.2% Greek22 0.2% Swiss16 0.1% Czech16 0.1% Haitian15 0.1% Belgian10 0.08% Canadian10 0.08% Dutch9 0.08% Ukrainian9 0.08% Welsh7 0.06% French Canadian7 0.06% Hungarian6 0.05% Palestinian6 0.05% Finnish6 0.05% French6 0.05% Slavic5 0.04% Armenian4 0.03% South African
Geographical mobility in Oxford Same house 1 year ago 8,744 53.5% White (Caucasian)727 52.5% Black or African American1,391 62.8% Asian289 50.0% Other race817 64.7% Two or more races8,820 54.1% White alone, not Hispanic / Latino241 36.0% Hispanic or LatinoMoved within same county 2,208 13.5% White / Caucasian62 4.4% Black or African American6 57.6% American Indian / Alaska Native543 24.5% Asian25 4.3% Other race310 24.5% Two or more races2,179 13.4% White alone, not Hispanic / Latino115 17.1% Hispanic or LatinoMoved within same state 3,609 22.1% White / Caucasian362 26.1% Black or African American100 4.5% Asian100 17.3% Other race37 3.0% Two or more races3,516 21.6% White alone, not Hispanic / Latino258 38.4% Hispanic or LatinoMoved from different state 1,524 9.3% White / Caucasian190 13.7% Black or African American42 1.9% Asian16 2.8% Other race25 2.0% Two or more races1,442 8.8% White alone, not Hispanic / Latino99 14.8% Hispanic or LatinoMoved from abroad 175 1.1% White106 7.7% Black or African American119 5.4% Asian122 21.2% Other race16 1.2% Two or more races206 1.3% White alone, not Hispanic / Latino
Children Nativity (place of birth) in Oxford
Children under 6 years - Living with two parents Both parents native 508 100.0% NativeChildren under 6 years - Living with one parent Native parent 98 100.0% NativeForeign-born parent 18 100.0% Native
Children 6 to 17 years - Living with two parents Both parents native 876 100.0% NativeBoth parents foreign-born 29 100.0% NativeOne native, one foreign-born parent 11 100.0% NativeChildren 6 to 17 years - Living with one parent Native parent 216 100.0% Native
Grandparents responsible for own grandchildren in Oxford
Grandparents (30 to 59 years) Other race 25 100.0% Not responsible for grandchildrenHispanic or Latino 18 100.0% Not responsible for grandchildren
Grandparents (60 years and over)