Races in Pacific Grove, California (CA) Detailed Stats
Data:
Races - White alone (%)
Races - White alone (% change since 2000)
Races - Black alone (%)
Races - Black alone (% change since 2000)
Races - American Indian alone (%)
Races - American Indian alone (% change since 2000)
Races - Asian alone (%)
Races - Asian alone (% change since 2000)
Races - Hispanic (%)
Races - Hispanic (% change since 2000)
Races - Native Hawaiian and Other Pacific Islander alone (%)
Races - Native Hawaiian and Other Pacific Islander alone (% change since 2000)
Races - Two or more races(%)
Races - Two or more races(% change since 2000)
Races - Other race alone (%)
Races - Other race alone (% change since 2000)
Racial diversity
Place of birth - Born in state of residence (%)
Place of birth - Born in state of residence (%) - White
Place of birth - Born in state of residence (%) - Black or African American
Place of birth - Born in state of residence (%) - Asian
Place of birth - Born in state of residence (%) - Hispanic or Latino
Place of birth - Born in state of residence (%) - American Indian and Alaska Native
Place of birth - Born in state of residence (%) - Multirace
Place of birth - Born in state of residence (%) - Other Race
Place of birth - Born in other state (%)
Place of birth - Born in other state (%) - White
Place of birth - Born in other state (%) - Black or African American
Place of birth - Born in other state (%) - Asian
Place of birth - Born in other state (%) - Hispanic or Latino
Place of birth - Born in other state (%) - American Indian and Alaska Native
Place of birth - Born in other state (%) - Multirace
Place of birth - Born in other state (%) - Other Race
Place of birth - Native, outside of US (%)
Place of birth - Native, outside of US (%) - White
Place of birth - Native, outside of US (%) - Black or African American
Place of birth - Native, outside of US (%) - Asian
Place of birth - Native, outside of US (%) - Hispanic or Latino
Place of birth - Native, outside of US (%) - American Indian and Alaska Native
Place of birth - Native, outside of US (%) - Multirace
Place of birth - Native, outside of US (%) - Other Race
Place of birth - Foreign born (%)
Place of birth - Foreign born (%) - White
Place of birth - Foreign born (%) - Black or African American
Place of birth - Foreign born (%) - Asian
Place of birth - Foreign born (%) - Hispanic or Latino
Place of birth - Foreign born (%) - American Indian and Alaska Native
Place of birth - Foreign born (%) - Multirace
Place of birth - Foreign born (%) - Other Race
Residents speaking English at home (%)
Residents speaking English at home - Born in the United States (%)
Residents speaking English at home - Native, born elsewhere (%)
Residents speaking English at home - Foreign born (%)
Residents speaking Spanish at home (%)
Residents speaking Spanish at home - Born in the United States (%)
Residents speaking Spanish at home - Native, born elsewhere (%)
Residents speaking Spanish at home - Foreign born (%)
Residents speaking other language at home (%)
Residents speaking other language at home - Born in the United States (%)
Residents speaking other language at home - Native, born elsewhere (%)
Residents speaking other language at home - Foreign born (%)
Marital status - Never married (%)
Marital status - Now married (%)
Marital status - Separated (%)
Marital status - Widowed (%)
Marital status - Divorced (%)
Ancestries Reported - Arab (%)
Ancestries Reported - Czech (%)
Ancestries Reported - Danish (%)
Ancestries Reported - Dutch (%)
Ancestries Reported - English (%)
Ancestries Reported - French (%)
Ancestries Reported - French Canadian (%)
Ancestries Reported - German (%)
Ancestries Reported - Greek (%)
Ancestries Reported - Hungarian (%)
Ancestries Reported - Irish (%)
Ancestries Reported - Italian (%)
Ancestries Reported - Lithuanian (%)
Ancestries Reported - Norwegian (%)
Ancestries Reported - Polish (%)
Ancestries Reported - Portuguese (%)
Ancestries Reported - Russian (%)
Ancestries Reported - Scotch-Irish (%)
Ancestries Reported - Scottish (%)
Ancestries Reported - Slovak (%)
Ancestries Reported - Subsaharan African (%)
Ancestries Reported - Swedish (%)
Ancestries Reported - Swiss (%)
Ancestries Reported - Ukrainian (%)
Ancestries Reported - United States (%)
Ancestries Reported - Welsh (%)
Ancestries Reported - West Indian (%)
Ancestries Reported - Other (%)
Geographical mobility - Same house 1 year ago (%)
Geographical mobility - Same house 1 year ago (%) - White
Geographical mobility - Same house 1 year ago (%) - Black or African American
Geographical mobility - Same house 1 year ago (%) - Asian
Geographical mobility - Same house 1 year ago (%) - Hispanic or Latino
Geographical mobility - Same house 1 year ago (%) - American Indian and Alaska Native
Geographical mobility - Same house 1 year ago (%) - Multirace
Geographical mobility - Same house 1 year ago (%) - Other Race
Geographical mobility - Moved within same county (%)
Geographical mobility - Moved within same county (%) - White
Geographical mobility - Moved within same county (%) - Black or African American
Geographical mobility - Moved within same county (%) - Asian
Geographical mobility - Moved within same county (%) - Hispanic or Latino
Geographical mobility - Moved within same county (%) - American Indian and Alaska Native
Geographical mobility - Moved within same county (%) - Multirace
Geographical mobility - Moved within same county (%) - Other Race
Geographical mobility - Moved from different county within same state (%)
Geographical mobility - Moved from different county within same state (%) - White
Geographical mobility - Moved from different county within same state (%) - Black or African American
Geographical mobility - Moved from different county within same state (%) - Asian
Geographical mobility - Moved from different county within same state (%) - Hispanic or Latino
Geographical mobility - Moved from different county within same state (%) - American Indian and Alaska Native
Geographical mobility - Moved from different county within same state (%) - Multirace
Geographical mobility - Moved from different county within same state (%) - Other Race
Geographical mobility - Moved from different state (%)
Geographical mobility - Moved from different state (%) - White
Geographical mobility - Moved from different state (%) - Black or African American
Geographical mobility - Moved from different state (%) - Asian
Geographical mobility - Moved from different state (%) - Hispanic or Latino
Geographical mobility - Moved from different state (%) - American Indian and Alaska Native
Geographical mobility - Moved from different state (%) - Multirace
Geographical mobility - Moved from different state (%) - Other Race
Geographical mobility - Moved from abroad (%)
Geographical mobility - Moved from abroad (%) - White
Geographical mobility - Moved from abroad (%) - Black or African American
Geographical mobility - Moved from abroad (%) - Asian
Geographical mobility - Moved from abroad (%) - Hispanic or Latino
Geographical mobility - Moved from abroad (%) - American Indian and Alaska Native
Geographical mobility - Moved from abroad (%) - Multirace
Geographical mobility - Moved from abroad (%) - Other Race
Place of birth for the foreign-born population - Ireland (%)
Place of birth for the foreign-born population - Denmark (%)
Place of birth for the foreign-born population - Norway (%)
Place of birth for the foreign-born population - Sweden (%)
Place of birth for the foreign-born population - United Kingdom (%)
Place of birth for the foreign-born population - England (%)
Place of birth for the foreign-born population - Scotland (%)
Place of birth for the foreign-born population - Other Northern Europe (%)
Place of birth for the foreign-born population - Austria (%)
Place of birth for the foreign-born population - Belgium (%)
Place of birth for the foreign-born population - France (%)
Place of birth for the foreign-born population - Germany (%)
Place of birth for the foreign-born population - Netherlands (%)
Place of birth for the foreign-born population - Switzerland (%)
Place of birth for the foreign-born population - Other Western Europe (%)
Place of birth for the foreign-born population - Greece (%)
Place of birth for the foreign-born population - Italy (%)
Place of birth for the foreign-born population - Portugal (%)
Place of birth for the foreign-born population - Spain (%)
Place of birth for the foreign-born population - Other Southern Europe (%)
Place of birth for the foreign-born population - Albania (%)
Place of birth for the foreign-born population - Belarus (%)
Place of birth for the foreign-born population - Bosnia and Herzegovina (%)
Place of birth for the foreign-born population - Bulgaria (%)
Place of birth for the foreign-born population - Croatia (%)
Place of birth for the foreign-born population - Czechoslovakia (%)
Place of birth for the foreign-born population - Hungary (%)
Place of birth for the foreign-born population - Latvia (%)
Place of birth for the foreign-born population - Lithuania (%)
Place of birth for the foreign-born population - North Macedonia (Macedonia) (%)
Place of birth for the foreign-born population - Moldova (%)
Place of birth for the foreign-born population - Poland (%)
Place of birth for the foreign-born population - Romania (%)
Place of birth for the foreign-born population - Russia (%)
Place of birth for the foreign-born population - Serbia (%)
Place of birth for the foreign-born population - Ukraine (%)
Place of birth for the foreign-born population - Other Eastern Europe (%)
Place of birth for the foreign-born population - China (%)
Place of birth for the foreign-born population - Hong Kong (%)
Place of birth for the foreign-born population - Taiwan (%)
Place of birth for the foreign-born population - Japan (%)
Place of birth for the foreign-born population - Korea (%)
Place of birth for the foreign-born population - Other Eastern Asia (%)
Place of birth for the foreign-born population - Afghanistan (%)
Place of birth for the foreign-born population - Bangladesh (%)
Place of birth for the foreign-born population - India (%)
Place of birth for the foreign-born population - Iran (%)
Place of birth for the foreign-born population - Kazakhstan (%)
Place of birth for the foreign-born population - Nepal (%)
Place of birth for the foreign-born population - Pakistan (%)
Place of birth for the foreign-born population - Sri Lanka (%)
Place of birth for the foreign-born population - Uzbekistan (%)
Place of birth for the foreign-born population - Other South Central Asia (%)
Place of birth for the foreign-born population - Burma (%)
Place of birth for the foreign-born population - Cambodia (%)
Place of birth for the foreign-born population - Indonesia (%)
Place of birth for the foreign-born population - Laos (%)
Place of birth for the foreign-born population - Malaysia (%)
Place of birth for the foreign-born population - Philippines (%)
Place of birth for the foreign-born population - Singapore (%)
Place of birth for the foreign-born population - Thailand (%)
Place of birth for the foreign-born population - Vietnam (%)
Place of birth for the foreign-born population - Other South Eastern Asia (%)
Place of birth for the foreign-born population - Armenia (%)
Place of birth for the foreign-born population - Iraq (%)
Place of birth for the foreign-born population - Israel (%)
Place of birth for the foreign-born population - Jordan (%)
Place of birth for the foreign-born population - Kuwait (%)
Place of birth for the foreign-born population - Lebanon (%)
Place of birth for the foreign-born population - Saudi Arabia (%)
Place of birth for the foreign-born population - Syria (%)
Place of birth for the foreign-born population - Turkey (%)
Place of birth for the foreign-born population - Yemen (%)
Place of birth for the foreign-born population - Other Western Asia (%)
Place of birth for the foreign-born population - Eritrea (%)
Place of birth for the foreign-born population - Ethiopia (%)
Place of birth for the foreign-born population - Kenya (%)
Place of birth for the foreign-born population - Somalia (%)
Place of birth for the foreign-born population - Uganda (%)
Place of birth for the foreign-born population - Zimbabwe (%)
Place of birth for the foreign-born population - Other Eastern Africa (%)
Place of birth for the foreign-born population - Cameroon (%)
Place of birth for the foreign-born population - Congo (%)
Place of birth for the foreign-born population - Democratic Republic of Congo (Zaire) (%)
Place of birth for the foreign-born population - Other Middle Africa (%)
Place of birth for the foreign-born population - Egypt (%)
Place of birth for the foreign-born population - Morocco (%)
Place of birth for the foreign-born population - Sudan (%)
Place of birth for the foreign-born population - Other Northern Africa (%)
Place of birth for the foreign-born population - South Africa (%)
Place of birth for the foreign-born population - Other Southern Africa (%)
Place of birth for the foreign-born population - Cabo Verde (%)
Place of birth for the foreign-born population - Ghana (%)
Place of birth for the foreign-born population - Liberia (%)
Place of birth for the foreign-born population - Nigeria (%)
Place of birth for the foreign-born population - Senegal (%)
Place of birth for the foreign-born population - Sierra Leone (%)
Place of birth for the foreign-born population - Other Western Africa (%)
Place of birth for the foreign-born population - Australia (%)
Place of birth for the foreign-born population - New Zealand (%)
Place of birth for the foreign-born population - Fiji (%)
Place of birth for the foreign-born population - Micronesia (%)
Place of birth for the foreign-born population - Bahamas (%)
Place of birth for the foreign-born population - Barbados (%)
Place of birth for the foreign-born population - Cuba (%)
Place of birth for the foreign-born population - Dominica (%)
Place of birth for the foreign-born population - Dominican Republic (%)
Place of birth for the foreign-born population - Grenada (%)
Place of birth for the foreign-born population - Haiti (%)
Place of birth for the foreign-born population - Jamaica (%)
Place of birth for the foreign-born population - St. Vincent and the Grenadines (%)
Place of birth for the foreign-born population - Trinidad and Tobago (%)
Place of birth for the foreign-born population - West Indies (%)
Place of birth for the foreign-born population - Other Caribbean (%)
Place of birth for the foreign-born population - Belize (%)
Place of birth for the foreign-born population - Costa Rica (%)
Place of birth for the foreign-born population - El Salvador (%)
Place of birth for the foreign-born population - Guatemala (%)
Place of birth for the foreign-born population - Honduras (%)
Place of birth for the foreign-born population - Mexico (%)
Place of birth for the foreign-born population - Nicaragua (%)
Place of birth for the foreign-born population - Panama (%)
Place of birth for the foreign-born population - Other Central America (%)
Place of birth for the foreign-born population - Argentina (%)
Place of birth for the foreign-born population - Bolivia (%)
Place of birth for the foreign-born population - Brazil (%)
Place of birth for the foreign-born population - Chile (%)
Place of birth for the foreign-born population - Colombia (%)
Place of birth for the foreign-born population - Ecuador (%)
Place of birth for the foreign-born population - Guyana (%)
Place of birth for the foreign-born population - Peru (%)
Place of birth for the foreign-born population - Uruguay (%)
Place of birth for the foreign-born population - Venezuela (%)
Place of birth for the foreign-born population - Other South America (%)
Place of birth for the foreign-born population - Canada (%)
Place of birth for the foreign-born population - Other Northern America (%)
Place of birth for the foreign-born population - Other (%)
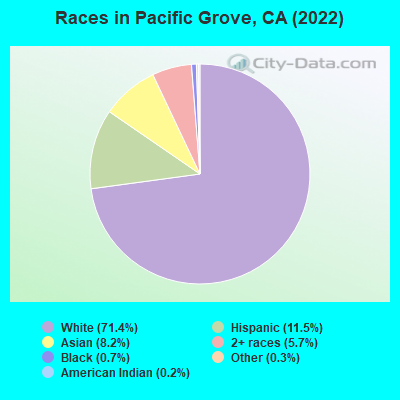
According to 2022 data, the most numerous races in Pacific Grove, CA are Hispanic (1,575 residents), White alone (11,440 residents), and Asian alone (917 residents). 84.6% of Pacific Grove residents speak English at home. 11.4% of Pacific Grove, CA residents are foreign-born (4.2% born in Europe, 4.1% born in Asia, 1.9% born in Latin America), which is 129.0% less than the foreign-born rate of 26.0% across the entire state of California.
Race distribution in Pacific Grove
2000 2022
15,816,790 46.7% White alone 10,966,556 32.4% Hispanic 3,648,860 10.8% Asian alone 2,181,926 6.4% Black alone 903,115 2.7% Two or more races 178,984 0.5% American Indian alone 103,736 0.3% Native Hawaiian and Other 71,681 0.2% Other race alone
15,732,184 40.3% Hispanic 13,160,426 33.7% White alone 5,957,867 15.3% Asian alone 2,025,218 5.2% Black alone 1,663,222 4.3% Two or more races 251,618 0.6% Other race alone 135,777 0.3% Native Hawaiian and Other 103,030 0.3% American Indian alone
Income and house value in Pacific Grove Median household income in 2022 $118,809 White non-Hispanic householders$130,816 Black householders$124,571 American Indian and Alaska Native householders$132,064 Asian householders$22,232 Native Hawaiian and other Pacific Islander householders$117,031 Some other race householders$90,830 Two or more races householders$116,775 Hispanic or Latino race householdersMedian 2022 house value over $1,000,000 White Non-Hispanic householdersover $1,000,000 Black or African American householders$305,940 American Indian or Alaska Native householders over $1,000,000 Asian householdersover $1,000,000 Native Hawaiian and other Pacific Islander householders$779,967 Some other race householdersover $1,000,000 Two or more races householdersover $1,000,000 Hispanic or Latino householders
Median age by race in Pacific Grove
59.7 Median age for White residents54.4 62.6 34.3 Median age for Black or African American residents47.2 31.9 38.5 Median age for American Indian / Alaska Native residents46.5 Median age for Asian residents46.1 46.7 45.2 Median age for Native Hawaiian / Pacific Islander residents29.0 Median age for Other race residents32.8 25.3 35.6 Median age for Two or more races residents28.4 43.3 54.5 Median age for White alone residents50.3 57.2 41.3 Median age for Hispanic or Latino residents42.0 35.6
Owner/renter occupied households by race in Pacific Grove
House owners and renters - White residents 2,534 52.7% Owner occupied2,276 47.3% Renter occupiedHouse owners and renters - Black or African American residents 17 33.0% Owner occupied35 67.0% Renter occupiedHouse owners and renters - American Indian / Alaska Native residents 21 100.0% Renter occupiedHouse owners and renters - Asian residents 232 59.5% Owner occupied158 40.5% Renter occupiedHouse owners and renters - Other race residents 103 100.0% Renter occupiedHouse owners and renters - Two or more races residents 119 15.1% Owner occupied672 84.9% Renter occupiedHouse owners and renters - White alone residents 2,712 50.3% Owner occupied2,679 49.7% Renter occupiedHouse owners and renters - Hispanic or Latino residents 232 41.2% Owner occupied331 58.8% Renter occupied
Language usage in Pacific Grove
English speakers - Total 84.6% of residents of Pacific Grove speak English at home.
4.9% of residents speak Spanish at home 574 78.0% Speak English very well162 22.0% Speak English less than very well11.1% of residents speak other language at home 1,286 76.5% Speak English very well395 23.5% Speak English less than very well
English speakers - Born in the United States 93.8% of residents of Pacific Grove speak English at home.
1.6% of residents speak Spanish at home 69 86.3% Speak English very well11 13.8% Speak English less than very well4.7% of residents speak other language at home 238 100.0% Speak English very well
English speakers - Native, born elsewhere 60.6% of residents of Pacific Grove speak English at home.
16.8% of residents speak Spanish at home 63 84.0% Speak English very well12 16.0% Speak English less than very well21.7% of residents speak other language at home 81 83.5% Speak English very well16 16.5% Speak English less than very well
English speakers - Foreign-born 22.6% of residents of Pacific Grove speak English at home.
16.7% of residents speak Spanish at home 190 66.0% Speak English very well98 34.0% Speak English less than very well64.0% of residents speak other language at home 759 68.6% Speak English very well348 31.4% Speak English less than very well
White (Caucasian) - Speak only English Native:
100.0% (9,154)Foreign-born:
48.5% (252)
White (Caucasian) - Speak another language Native:
4.0% (367)Foreign-born:
65.8% (342)
Asian - Speak only English Native:
93.3% (460)Foreign-born:
10.8% (51)
Asian - Speak another language Native:
12.9% (64)Foreign-born:
89.3% (426)
Other race - Speak only English Native:
37.0% (69)Foreign-born:
9.3% (6)
Other race - Speak another language Native:
63.9% (120)Foreign-born:
91.9% (62)
Two or more races - Speak another language Native:
20.5% (331)Foreign-born:
100.0% (323)
White alone - Speak only English Native:
95.5% (9,803)Foreign-born:
33.7% (282)
White alone - Speak another language Native:
4.6% (473)Foreign-born:
65.5% (548)
Hispanic or Latino - Speak only English Native:
77.1% (970)Foreign-born:
9.9% (28)
Hispanic or Latino - Speak another language Native:
26.9% (339)Foreign-born:
92.1% (260)
Foreign-born residents in Pacific Grove 1,768 residents are foreign born (4.2% Europe , 4.1% Asia , 1.9% Latin America ).
This city:
11.4%California:
100.0%
Marital status for residents in Pacific Grove Marital status - White (Caucasian) population 15 years and over
Males 28.6% Never married58.3% Now married1.5% Separated2.8% Widowed8.8% DivorcedFemales 21.4% Never married46.8% Now married1.8% Separated11.8% Widowed18.2% DivorcedWomen who gave birth in the past 12 months Now married:
100.0% (24)Unmarried:
0.0% (0)
Women who did not give birth in the past 12 months Now married:
49.4% (749)Unmarried:
50.6% (767)
Marital status - Black or African American population 15 years and over
Males 65.1% Never married19.0% Now married0.0% Separated15.9% Widowed0.0% DivorcedFemales 26.3% Never married63.8% Now married0.0% Separated6.3% Widowed3.8% DivorcedWomen who did not give birth in the past 12 months Now married:
63.2% (34)Unmarried:
36.8% (20)
Marital status - American Indian / Alaska Native population 15 years and over
Males 26.9% Never married73.1% Now married0.0% Separated0.0% Widowed0.0% DivorcedFemales 0.0% Never married100.0% Now married0.0% Separated0.0% Widowed0.0% DivorcedMarital status - Asian population 15 years and over
Males 28.6% Never married65.9% Now married0.0% Separated0.0% Widowed5.5% DivorcedFemales 10.1% Never married63.4% Now married2.9% Separated7.9% Widowed15.6% DivorcedWomen who gave birth in the past 12 months Now married:
100.0% (13)Unmarried:
0.0% (0)
Women who did not give birth in the past 12 months Now married:
77.3% (191)Unmarried:
22.7% (56)
Marital status - Other race population 15 years and over
Males 22.7% Never married66.7% Now married0.0% Separated0.0% Widowed10.7% DivorcedFemales 34.0% Never married61.0% Now married0.0% Separated5.0% Widowed0.0% DivorcedWomen who did not give birth in the past 12 months Now married:
50.0% (47)Unmarried:
50.0% (47)
Marital status - Two or more races population 15 years and over
Males 41.6% Never married49.6% Now married0.0% Separated0.0% Widowed8.8% DivorcedFemales 38.0% Never married18.8% Now married0.0% Separated8.9% Widowed34.3% DivorcedWomen who gave birth in the past 12 months Now married:
100.0% (18)Unmarried:
0.0% (0)
Women who did not give birth in the past 12 months Now married:
13.1% (67)Unmarried:
86.9% (440)
Marital status - White alone, not Hispanic / Latino population 15 years and over
Males 27.2% Never married59.0% Now married1.5% Separated3.0% Widowed9.3% DivorcedFemales 20.0% Never married47.2% Now married1.7% Separated12.8% Widowed18.2% DivorcedWomen who gave birth in the past 12 months Now married:
100.0% (33)Unmarried:
0.0% (0)
Women who did not give birth in the past 12 months Now married:
50.5% (894)Unmarried:
49.5% (876)
Marital status - Hispanic or Latino population 15 years and over
Males 43.1% Never married50.5% Now married1.1% Separated1.1% Widowed4.2% DivorcedFemales 39.0% Never married43.6% Now married2.5% Separated1.9% Widowed13.0% DivorcedWomen who gave birth in the past 12 months Now married:
100.0% (8)Unmarried:
0.0% (0)
Women who did not give birth in the past 12 months Now married:
40.6% (197)Unmarried:
59.4% (288)
Ancestries in Pacific Grove
878 12.6% European530 7.6% English514 7.4% American511 7.3% German327 4.7% Irish320 4.6% Italian206 2.9% Russian179 2.6% Northern European120 1.7% British107 1.5% Ukrainian105 1.5% Afghan91 1.3% Scottish90 1.3% Portuguese85 1.2% Scotch-Irish62 0.9% Hungarian60 0.9% Dutch55 0.8% Danish52 0.7% French51 0.7% Swedish44 0.6% Albanian43 0.6% Norwegian39 0.6% Polish38 0.5% Czech36 0.5% Swiss29 0.4% French Canadian26 0.4% Croatian22 0.3% Welsh20 0.3% Egyptian18 0.3% Eastern European18 0.3% Turkish16 0.2% Slovene16 0.2% Finnish15 0.2% Armenian15 0.2% Scandinavian11 0.2% Moroccan11 0.2% Iraqi10 0.1% Belgian9 0.1% Czechoslovakian9 0.1% Serbian9 0.1% Basque8 0.1% Lithuanian7 0.1% Brazilian6 0.09% Lebanese5 0.07% Iranian5 0.07% Israeli4 0.06% Greek4 0.06% Yugoslavian3 0.04% Arab1 0.01% Alsatian
Children Nativity (place of birth) in Pacific Grove
Children under 6 years - Living with two parents Both parents native 418 100.0% NativeBoth parents foreign-born 95 100.0% NativeOne native, one foreign-born parent 89 100.0% NativeChildren under 6 years - Living with one parent Native parent 111 100.0% NativeChildren 6 to 17 years - Living with two parents Both parents native 1,169 100.0% Native0 0.0% Foreign-bornBoth parents foreign-born 137 79.3% Native36 20.7% Foreign-bornOne native, one foreign-born parent 189 100.0% NativeChildren 6 to 17 years - Living with one parent Native parent 360 100.0% NativeForeign-born parent 75 56.4% Native58 43.6% Foreign-born
Grandparents responsible for own grandchildren in Pacific Grove
Grandparents (30 to 59 years) White / Caucasian 5 100.0% Responsible for grandchildrenWhite alone, not Hispanic / Latino 5 100.0% Responsible for grandchildrenGrandparents (60 years and over) White / Caucasian 22 17.3% Responsible for grandchildren107 82.7% Not responsible for grandchildrenWhite alone, not Hispanic / Latino 27 15.7% Responsible for grandchildren145 84.3% Not responsible for grandchildren