Races in Paducah, Kentucky (KY) Detailed Stats
Data:
Races - White alone (%)
Races - White alone (% change since 2000)
Races - Black alone (%)
Races - Black alone (% change since 2000)
Races - American Indian alone (%)
Races - American Indian alone (% change since 2000)
Races - Asian alone (%)
Races - Asian alone (% change since 2000)
Races - Hispanic (%)
Races - Hispanic (% change since 2000)
Races - Native Hawaiian and Other Pacific Islander alone (%)
Races - Native Hawaiian and Other Pacific Islander alone (% change since 2000)
Races - Two or more races(%)
Races - Two or more races(% change since 2000)
Races - Other race alone (%)
Races - Other race alone (% change since 2000)
Racial diversity
Place of birth - Born in state of residence (%)
Place of birth - Born in state of residence (%) - White
Place of birth - Born in state of residence (%) - Black or African American
Place of birth - Born in state of residence (%) - Asian
Place of birth - Born in state of residence (%) - Hispanic or Latino
Place of birth - Born in state of residence (%) - American Indian and Alaska Native
Place of birth - Born in state of residence (%) - Multirace
Place of birth - Born in state of residence (%) - Other Race
Place of birth - Born in other state (%)
Place of birth - Born in other state (%) - White
Place of birth - Born in other state (%) - Black or African American
Place of birth - Born in other state (%) - Asian
Place of birth - Born in other state (%) - Hispanic or Latino
Place of birth - Born in other state (%) - American Indian and Alaska Native
Place of birth - Born in other state (%) - Multirace
Place of birth - Born in other state (%) - Other Race
Place of birth - Native, outside of US (%)
Place of birth - Native, outside of US (%) - White
Place of birth - Native, outside of US (%) - Black or African American
Place of birth - Native, outside of US (%) - Asian
Place of birth - Native, outside of US (%) - Hispanic or Latino
Place of birth - Native, outside of US (%) - American Indian and Alaska Native
Place of birth - Native, outside of US (%) - Multirace
Place of birth - Native, outside of US (%) - Other Race
Place of birth - Foreign born (%)
Place of birth - Foreign born (%) - White
Place of birth - Foreign born (%) - Black or African American
Place of birth - Foreign born (%) - Asian
Place of birth - Foreign born (%) - Hispanic or Latino
Place of birth - Foreign born (%) - American Indian and Alaska Native
Place of birth - Foreign born (%) - Multirace
Place of birth - Foreign born (%) - Other Race
Residents speaking English at home (%)
Residents speaking English at home - Born in the United States (%)
Residents speaking English at home - Native, born elsewhere (%)
Residents speaking English at home - Foreign born (%)
Residents speaking Spanish at home (%)
Residents speaking Spanish at home - Born in the United States (%)
Residents speaking Spanish at home - Native, born elsewhere (%)
Residents speaking Spanish at home - Foreign born (%)
Residents speaking other language at home (%)
Residents speaking other language at home - Born in the United States (%)
Residents speaking other language at home - Native, born elsewhere (%)
Residents speaking other language at home - Foreign born (%)
Marital status - Never married (%)
Marital status - Now married (%)
Marital status - Separated (%)
Marital status - Widowed (%)
Marital status - Divorced (%)
Ancestries Reported - Arab (%)
Ancestries Reported - Czech (%)
Ancestries Reported - Danish (%)
Ancestries Reported - Dutch (%)
Ancestries Reported - English (%)
Ancestries Reported - French (%)
Ancestries Reported - French Canadian (%)
Ancestries Reported - German (%)
Ancestries Reported - Greek (%)
Ancestries Reported - Hungarian (%)
Ancestries Reported - Irish (%)
Ancestries Reported - Italian (%)
Ancestries Reported - Lithuanian (%)
Ancestries Reported - Norwegian (%)
Ancestries Reported - Polish (%)
Ancestries Reported - Portuguese (%)
Ancestries Reported - Russian (%)
Ancestries Reported - Scotch-Irish (%)
Ancestries Reported - Scottish (%)
Ancestries Reported - Slovak (%)
Ancestries Reported - Subsaharan African (%)
Ancestries Reported - Swedish (%)
Ancestries Reported - Swiss (%)
Ancestries Reported - Ukrainian (%)
Ancestries Reported - United States (%)
Ancestries Reported - Welsh (%)
Ancestries Reported - West Indian (%)
Ancestries Reported - Other (%)
Geographical mobility - Same house 1 year ago (%)
Geographical mobility - Same house 1 year ago (%) - White
Geographical mobility - Same house 1 year ago (%) - Black or African American
Geographical mobility - Same house 1 year ago (%) - Asian
Geographical mobility - Same house 1 year ago (%) - Hispanic or Latino
Geographical mobility - Same house 1 year ago (%) - American Indian and Alaska Native
Geographical mobility - Same house 1 year ago (%) - Multirace
Geographical mobility - Same house 1 year ago (%) - Other Race
Geographical mobility - Moved within same county (%)
Geographical mobility - Moved within same county (%) - White
Geographical mobility - Moved within same county (%) - Black or African American
Geographical mobility - Moved within same county (%) - Asian
Geographical mobility - Moved within same county (%) - Hispanic or Latino
Geographical mobility - Moved within same county (%) - American Indian and Alaska Native
Geographical mobility - Moved within same county (%) - Multirace
Geographical mobility - Moved within same county (%) - Other Race
Geographical mobility - Moved from different county within same state (%)
Geographical mobility - Moved from different county within same state (%) - White
Geographical mobility - Moved from different county within same state (%) - Black or African American
Geographical mobility - Moved from different county within same state (%) - Asian
Geographical mobility - Moved from different county within same state (%) - Hispanic or Latino
Geographical mobility - Moved from different county within same state (%) - American Indian and Alaska Native
Geographical mobility - Moved from different county within same state (%) - Multirace
Geographical mobility - Moved from different county within same state (%) - Other Race
Geographical mobility - Moved from different state (%)
Geographical mobility - Moved from different state (%) - White
Geographical mobility - Moved from different state (%) - Black or African American
Geographical mobility - Moved from different state (%) - Asian
Geographical mobility - Moved from different state (%) - Hispanic or Latino
Geographical mobility - Moved from different state (%) - American Indian and Alaska Native
Geographical mobility - Moved from different state (%) - Multirace
Geographical mobility - Moved from different state (%) - Other Race
Geographical mobility - Moved from abroad (%)
Geographical mobility - Moved from abroad (%) - White
Geographical mobility - Moved from abroad (%) - Black or African American
Geographical mobility - Moved from abroad (%) - Asian
Geographical mobility - Moved from abroad (%) - Hispanic or Latino
Geographical mobility - Moved from abroad (%) - American Indian and Alaska Native
Geographical mobility - Moved from abroad (%) - Multirace
Geographical mobility - Moved from abroad (%) - Other Race
Place of birth for the foreign-born population - Ireland (%)
Place of birth for the foreign-born population - Denmark (%)
Place of birth for the foreign-born population - Norway (%)
Place of birth for the foreign-born population - Sweden (%)
Place of birth for the foreign-born population - United Kingdom (%)
Place of birth for the foreign-born population - England (%)
Place of birth for the foreign-born population - Scotland (%)
Place of birth for the foreign-born population - Other Northern Europe (%)
Place of birth for the foreign-born population - Austria (%)
Place of birth for the foreign-born population - Belgium (%)
Place of birth for the foreign-born population - France (%)
Place of birth for the foreign-born population - Germany (%)
Place of birth for the foreign-born population - Netherlands (%)
Place of birth for the foreign-born population - Switzerland (%)
Place of birth for the foreign-born population - Other Western Europe (%)
Place of birth for the foreign-born population - Greece (%)
Place of birth for the foreign-born population - Italy (%)
Place of birth for the foreign-born population - Portugal (%)
Place of birth for the foreign-born population - Spain (%)
Place of birth for the foreign-born population - Other Southern Europe (%)
Place of birth for the foreign-born population - Albania (%)
Place of birth for the foreign-born population - Belarus (%)
Place of birth for the foreign-born population - Bosnia and Herzegovina (%)
Place of birth for the foreign-born population - Bulgaria (%)
Place of birth for the foreign-born population - Croatia (%)
Place of birth for the foreign-born population - Czechoslovakia (%)
Place of birth for the foreign-born population - Hungary (%)
Place of birth for the foreign-born population - Latvia (%)
Place of birth for the foreign-born population - Lithuania (%)
Place of birth for the foreign-born population - North Macedonia (Macedonia) (%)
Place of birth for the foreign-born population - Moldova (%)
Place of birth for the foreign-born population - Poland (%)
Place of birth for the foreign-born population - Romania (%)
Place of birth for the foreign-born population - Russia (%)
Place of birth for the foreign-born population - Serbia (%)
Place of birth for the foreign-born population - Ukraine (%)
Place of birth for the foreign-born population - Other Eastern Europe (%)
Place of birth for the foreign-born population - China (%)
Place of birth for the foreign-born population - Hong Kong (%)
Place of birth for the foreign-born population - Taiwan (%)
Place of birth for the foreign-born population - Japan (%)
Place of birth for the foreign-born population - Korea (%)
Place of birth for the foreign-born population - Other Eastern Asia (%)
Place of birth for the foreign-born population - Afghanistan (%)
Place of birth for the foreign-born population - Bangladesh (%)
Place of birth for the foreign-born population - India (%)
Place of birth for the foreign-born population - Iran (%)
Place of birth for the foreign-born population - Kazakhstan (%)
Place of birth for the foreign-born population - Nepal (%)
Place of birth for the foreign-born population - Pakistan (%)
Place of birth for the foreign-born population - Sri Lanka (%)
Place of birth for the foreign-born population - Uzbekistan (%)
Place of birth for the foreign-born population - Other South Central Asia (%)
Place of birth for the foreign-born population - Burma (%)
Place of birth for the foreign-born population - Cambodia (%)
Place of birth for the foreign-born population - Indonesia (%)
Place of birth for the foreign-born population - Laos (%)
Place of birth for the foreign-born population - Malaysia (%)
Place of birth for the foreign-born population - Philippines (%)
Place of birth for the foreign-born population - Singapore (%)
Place of birth for the foreign-born population - Thailand (%)
Place of birth for the foreign-born population - Vietnam (%)
Place of birth for the foreign-born population - Other South Eastern Asia (%)
Place of birth for the foreign-born population - Armenia (%)
Place of birth for the foreign-born population - Iraq (%)
Place of birth for the foreign-born population - Israel (%)
Place of birth for the foreign-born population - Jordan (%)
Place of birth for the foreign-born population - Kuwait (%)
Place of birth for the foreign-born population - Lebanon (%)
Place of birth for the foreign-born population - Saudi Arabia (%)
Place of birth for the foreign-born population - Syria (%)
Place of birth for the foreign-born population - Turkey (%)
Place of birth for the foreign-born population - Yemen (%)
Place of birth for the foreign-born population - Other Western Asia (%)
Place of birth for the foreign-born population - Eritrea (%)
Place of birth for the foreign-born population - Ethiopia (%)
Place of birth for the foreign-born population - Kenya (%)
Place of birth for the foreign-born population - Somalia (%)
Place of birth for the foreign-born population - Uganda (%)
Place of birth for the foreign-born population - Zimbabwe (%)
Place of birth for the foreign-born population - Other Eastern Africa (%)
Place of birth for the foreign-born population - Cameroon (%)
Place of birth for the foreign-born population - Congo (%)
Place of birth for the foreign-born population - Democratic Republic of Congo (Zaire) (%)
Place of birth for the foreign-born population - Other Middle Africa (%)
Place of birth for the foreign-born population - Egypt (%)
Place of birth for the foreign-born population - Morocco (%)
Place of birth for the foreign-born population - Sudan (%)
Place of birth for the foreign-born population - Other Northern Africa (%)
Place of birth for the foreign-born population - South Africa (%)
Place of birth for the foreign-born population - Other Southern Africa (%)
Place of birth for the foreign-born population - Cabo Verde (%)
Place of birth for the foreign-born population - Ghana (%)
Place of birth for the foreign-born population - Liberia (%)
Place of birth for the foreign-born population - Nigeria (%)
Place of birth for the foreign-born population - Senegal (%)
Place of birth for the foreign-born population - Sierra Leone (%)
Place of birth for the foreign-born population - Other Western Africa (%)
Place of birth for the foreign-born population - Australia (%)
Place of birth for the foreign-born population - New Zealand (%)
Place of birth for the foreign-born population - Fiji (%)
Place of birth for the foreign-born population - Micronesia (%)
Place of birth for the foreign-born population - Bahamas (%)
Place of birth for the foreign-born population - Barbados (%)
Place of birth for the foreign-born population - Cuba (%)
Place of birth for the foreign-born population - Dominica (%)
Place of birth for the foreign-born population - Dominican Republic (%)
Place of birth for the foreign-born population - Grenada (%)
Place of birth for the foreign-born population - Haiti (%)
Place of birth for the foreign-born population - Jamaica (%)
Place of birth for the foreign-born population - St. Vincent and the Grenadines (%)
Place of birth for the foreign-born population - Trinidad and Tobago (%)
Place of birth for the foreign-born population - West Indies (%)
Place of birth for the foreign-born population - Other Caribbean (%)
Place of birth for the foreign-born population - Belize (%)
Place of birth for the foreign-born population - Costa Rica (%)
Place of birth for the foreign-born population - El Salvador (%)
Place of birth for the foreign-born population - Guatemala (%)
Place of birth for the foreign-born population - Honduras (%)
Place of birth for the foreign-born population - Mexico (%)
Place of birth for the foreign-born population - Nicaragua (%)
Place of birth for the foreign-born population - Panama (%)
Place of birth for the foreign-born population - Other Central America (%)
Place of birth for the foreign-born population - Argentina (%)
Place of birth for the foreign-born population - Bolivia (%)
Place of birth for the foreign-born population - Brazil (%)
Place of birth for the foreign-born population - Chile (%)
Place of birth for the foreign-born population - Colombia (%)
Place of birth for the foreign-born population - Ecuador (%)
Place of birth for the foreign-born population - Guyana (%)
Place of birth for the foreign-born population - Peru (%)
Place of birth for the foreign-born population - Uruguay (%)
Place of birth for the foreign-born population - Venezuela (%)
Place of birth for the foreign-born population - Other South America (%)
Place of birth for the foreign-born population - Canada (%)
Place of birth for the foreign-born population - Other Northern America (%)
Place of birth for the foreign-born population - Other (%)
Latest news about races in Paducah, KY collected exclusively by city-data.com from local newspapers, TV, and radio stations
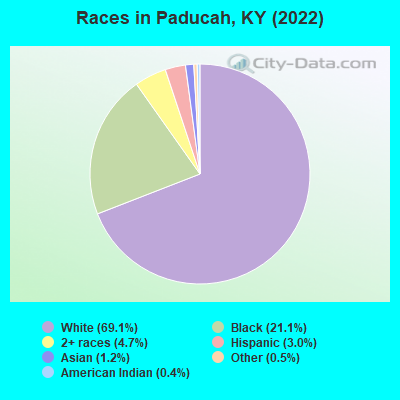
According to 2022 data, the most numerous races in Paducah, KY are White alone (18,610 residents), Black alone (5,669 residents), and Hispanic (795 residents). 97.5% of Paducah residents speak English at home. 2.1% of Paducah, KY residents are foreign-born (0.8% born in Latin America, 0.7% born in Asia, 0.3% born in Europe), which is 89.3% less than the foreign-born rate of 4.0% across the entire state of Kentucky.
Race distribution in Paducah
2000 2022
3,608,013 89.3% White alone 293,639 7.3% Black alone 59,939 1.5% Hispanic 37,750 0.9% Two or more races 29,368 0.7% Asian alone 7,939 0.2% American Indian alone 3,846 0.10% Other race alone 1,275 0.03% Native Hawaiian and Other
3,710,998 82.2% White alone 343,194 7.6% Black alone 187,483 4.2% Hispanic 187,394 4.2% Two or more races 62,240 1.4% Asian alone 13,529 0.3% Other race alone 4,302 0.10% American Indian alone 3,170 0.07% Native Hawaiian and Other
Income and house value in Paducah Median household income in 2022 $59,216 White non-Hispanic householders$29,207 Black householders$187,368 Asian householders$33,981 Two or more races householders$25,181 Hispanic or Latino race householdersMedian 2022 house value $185,291 White Non-Hispanic householders$123,990 Black or African American householders$180,299 American Indian or Alaska Native householders $90,149 Asian householders$152,560 Two or more races householders$216,358 Hispanic or Latino householders
Median age by race in Paducah
45.7 Median age for White residents42.5 46.9 40.8 Median age for Black or African American residents42.5 40.2 36.9 Median age for American Indian / Alaska Native residents43.2 26.9 33.6 Median age for Asian residents31.2 34.7 -666,666,666.0 Median age for Native Hawaiian / Pacific Islander residents-666,666,666.0 -666,666,666.0 8.6 Median age for Other race residents37.0 8.8 11.6 Median age for Two or more races residents15.0 8.8 45.7 Median age for White alone residents42.8 46.7 19.7 Median age for Hispanic or Latino residents20.6 21.7
Owner/renter occupied households by race in Paducah
House owners and renters - White residents 5,235 63.2% Owner occupied3,054 36.8% Renter occupiedHouse owners and renters - Black or African American residents 1,460 56.3% Owner occupied1,135 43.7% Renter occupiedHouse owners and renters - American Indian / Alaska Native residents 8 12.0% Owner occupied58 88.0% Renter occupiedHouse owners and renters - Asian residents 44 54.8% Owner occupied36 45.2% Renter occupiedHouse owners and renters - Other race residents 38 100.0% Renter occupiedHouse owners and renters - Two or more races residents 97 37.0% Owner occupied165 63.0% Renter occupiedHouse owners and renters - White alone residents 5,280 63.4% Owner occupied3,048 36.6% Renter occupiedHouse owners and renters - Hispanic or Latino residents 67 57.1% Owner occupied50 42.9% Renter occupied
Language usage in Paducah
English speakers - Total 97.5% of residents of Paducah speak English at home.
1.4% of residents speak Spanish at home 315 86.8% Speak English very well48 13.2% Speak English less than very well1.1% of residents speak other language at home 207 77.2% Speak English very well61 22.8% Speak English less than very well
English speakers - Born in the United States 98.3% of residents of Paducah speak English at home.
1.0% of residents speak Spanish at home 68 73.9% Speak English very well24 26.1% Speak English less than very well0.6% of residents speak other language at home 57 100.0% Speak English very well
English speakers - Native, born elsewhere 94.2% of residents of Paducah speak English at home.
2.0% of residents speak other language at home 8 100.0% Speak English very well
English speakers - Foreign-born 33.5% of residents of Paducah speak English at home.
38.8% of residents speak Spanish at home 189 89.2% Speak English very well23 10.8% Speak English less than very well27.1% of residents speak other language at home 100 67.6% Speak English very well48 32.4% Speak English less than very well
White (Caucasian) - Speak only English Native:
99.1% (17,650)Foreign-born:
88.0% (151)
White (Caucasian) - Speak another language Native:
0.8% (144)Foreign-born:
13.4% (23)
Black or African American - Speak only English Native:
100.0% (5,253)Foreign-born:
100.0% (15)
Asian - Speak only English Native:
16.6% (10)Foreign-born:
23.6% (40)
Asian - Speak another language Native:
84.7% (52)Foreign-born:
76.0% (129)
Other race - Speak only English Native:
80.6% (122)Foreign-born:
77.9% (44)
Other race - Speak another language Native:
24.3% (37)Foreign-born:
30.7% (17)
Two or more races - Speak another language Native:
4.4% (63)Foreign-born:
98.8% (295)
White alone - Speak only English Native:
99.2% (17,652)Foreign-born:
89.3% (210)
White alone - Speak another language Native:
0.7% (129)Foreign-born:
13.0% (31)
Hispanic or Latino - Speak only English Native:
81.6% (351)Foreign-born:
3.4% (8)
Hispanic or Latino - Speak another language Native:
19.6% (84)Foreign-born:
96.8% (219)
Foreign-born residents in Paducah 567 residents are foreign born (0.8% Latin America , 0.7% Asia , 0.3% Europe ).
This city:
2.1%Kentucky:
4.1%
Marital status for residents in Paducah Marital status - White (Caucasian) population 15 years and over
Males 32.5% Never married44.3% Now married3.0% Separated3.5% Widowed16.7% DivorcedFemales 24.7% Never married42.4% Now married1.8% Separated13.8% Widowed17.3% DivorcedWomen who gave birth in the past 12 months Now married:
65.7% (126)Unmarried:
34.3% (66)
Women who did not give birth in the past 12 months Now married:
41.1% (1,639)Unmarried:
58.9% (2,350)
Marital status - Black or African American population 15 years and over
Males 41.4% Never married34.1% Now married2.7% Separated8.5% Widowed13.3% DivorcedFemales 42.1% Never married20.1% Now married8.2% Separated8.5% Widowed21.1% DivorcedWomen who gave birth in the past 12 months Now married:
0.0% (0)Unmarried:
100.0% (85)
Women who did not give birth in the past 12 months Now married:
32.8% (471)Unmarried:
67.2% (964)
Marital status - American Indian / Alaska Native population 15 years and over
Males 18.6% Never married31.4% Now married0.0% Separated20.0% Widowed30.0% DivorcedFemales 28.6% Never married28.6% Now married0.0% Separated21.4% Widowed21.4% DivorcedWomen who did not give birth in the past 12 months Now married:
50.0% (9)Unmarried:
50.0% (9)
Marital status - Asian population 15 years and over
Males 15.5% Never married84.5% Now married0.0% Separated0.0% Widowed0.0% DivorcedFemales 18.6% Never married72.1% Now married0.0% Separated0.0% Widowed9.3% DivorcedWomen who gave birth in the past 12 months Now married:
100.0% (20)Unmarried:
0.0% (0)
Women who did not give birth in the past 12 months Now married:
67.5% (48)Unmarried:
32.5% (23)
Marital status - Other race population 15 years and over
Males 64.7% Never married35.3% Now married0.0% Separated0.0% Widowed0.0% DivorcedFemales 6.0% Never married26.0% Now married0.0% Separated0.0% Widowed68.0% DivorcedWomen who gave birth in the past 12 months Now married:
100.0% (3)Unmarried:
0.0% (0)
Women who did not give birth in the past 12 months Now married:
52.4% (14)Unmarried:
47.6% (13)
Marital status - Two or more races population 15 years and over
Males 78.4% Never married16.6% Now married0.0% Separated1.0% Widowed4.0% DivorcedFemales 28.8% Never married30.7% Now married13.3% Separated9.1% Widowed18.1% DivorcedWomen who gave birth in the past 12 months Now married:
55.7% (49)Unmarried:
44.3% (39)
Women who did not give birth in the past 12 months Now married:
47.8% (111)Unmarried:
52.2% (121)
Marital status - White alone, not Hispanic / Latino population 15 years and over
Males 32.1% Never married44.6% Now married3.0% Separated3.5% Widowed16.8% DivorcedFemales 24.6% Never married42.4% Now married1.8% Separated13.9% Widowed17.2% DivorcedWomen who gave birth in the past 12 months Now married:
67.0% (127)Unmarried:
33.0% (63)
Women who did not give birth in the past 12 months Now married:
41.3% (1,654)Unmarried:
58.7% (2,347)
Marital status - Hispanic or Latino population 15 years and over
Males 82.4% Never married17.6% Now married0.0% Separated0.0% Widowed0.0% DivorcedFemales 10.6% Never married32.8% Now married21.7% Separated0.5% Widowed34.4% DivorcedWomen who gave birth in the past 12 months Now married:
90.0% (39)Unmarried:
10.0% (4)
Women who did not give birth in the past 12 months Now married:
52.0% (56)Unmarried:
48.0% (52)
Ancestries in Paducah
5,930 38.6% English1,366 8.9% American758 4.9% German735 4.8% African568 3.7% Irish204 1.3% Scotch-Irish162 1.1% European140 0.9% Italian138 0.9% Scottish127 0.8% Ethiopian91 0.6% Polish87 0.6% Norwegian67 0.4% Scandinavian29 0.2% Nigerian18 0.1% British16 0.1% French15 0.10% Dutch14 0.09% Arab14 0.09% Swedish14 0.09% Jamaican13 0.08% Russian10 0.07% Romanian9 0.06% Welsh8 0.05% Eastern European5 0.03% Czech4 0.03% French Canadian4 0.03% Northern European3 0.02% Iranian1 0.01% Lithuanian
Geographical mobility in Paducah Same house 1 year ago 15,210 82.3% White (Caucasian)4,326 74.1% Black or African American84 62.1% American Indian / Alaska Native299 97.9% Asian206 98.3% Other race1,724 89.8% Two or more races15,235 82.4% White alone, not Hispanic / Latino638 88.2% Hispanic or LatinoMoved within same county 1,741 9.4% White / Caucasian282 4.8% Black or African American57 42.2% American Indian / Alaska Native119 6.2% Two or more races1,737 9.4% White alone, not Hispanic / Latino47 6.4% Hispanic or LatinoMoved within same state 806 4.4% White / Caucasian54 0.9% Black or African American9 4.1% Other race40 2.1% Two or more races794 4.3% White alone, not Hispanic / Latino21 2.8% Hispanic or LatinoMoved from different state 621 3.4% White / Caucasian14 0.2% Black or African American4 3.1% American Indian / Alaska Native27 1.4% Two or more races620 3.4% White alone, not Hispanic / Latino15 2.1% Hispanic or Latino
Children Nativity (place of birth) in Paducah
Children under 6 years - Living with two parents Both parents native 807 100.0% NativeBoth parents foreign-born 25 100.0% NativeOne native, one foreign-born parent 42 100.0% NativeChildren under 6 years - Living with one parent Native parent 759 100.0% Native
Children 6 to 17 years - Living with two parents Both parents native 1,679 97.1% Native51 2.9% Foreign-bornOne native, one foreign-born parent 26 100.0% NativeChildren 6 to 17 years - Living with one parent Native parent 1,670 100.0% Native
Grandparents responsible for own grandchildren in Paducah
Grandparents (30 to 59 years) White / Caucasian 11 43.9% Responsible for grandchildren14 56.1% Not responsible for grandchildrenBlack or African American 66 100.0% Responsible for grandchildrenWhite alone, not Hispanic / Latino 11 43.5% Responsible for grandchildren14 56.5% Not responsible for grandchildrenGrandparents (60 years and over) White / Caucasian 200 63.0% Responsible for grandchildren117 37.0% Not responsible for grandchildrenBlack or African American 30 67.5% Responsible for grandchildren14 32.5% Not responsible for grandchildrenWhite alone, not Hispanic / Latino 200 62.8% Responsible for grandchildren118 37.2% Not responsible for grandchildren