Races in Palmer, Alaska (AK) Detailed Stats
Data:
Races - White alone (%)
Races - White alone (% change since 2000)
Races - Black alone (%)
Races - Black alone (% change since 2000)
Races - American Indian alone (%)
Races - American Indian alone (% change since 2000)
Races - Asian alone (%)
Races - Asian alone (% change since 2000)
Races - Hispanic (%)
Races - Hispanic (% change since 2000)
Races - Native Hawaiian and Other Pacific Islander alone (%)
Races - Native Hawaiian and Other Pacific Islander alone (% change since 2000)
Races - Two or more races(%)
Races - Two or more races(% change since 2000)
Races - Other race alone (%)
Races - Other race alone (% change since 2000)
Racial diversity
Place of birth - Born in state of residence (%)
Place of birth - Born in state of residence (%) - White
Place of birth - Born in state of residence (%) - Black or African American
Place of birth - Born in state of residence (%) - Asian
Place of birth - Born in state of residence (%) - Hispanic or Latino
Place of birth - Born in state of residence (%) - American Indian and Alaska Native
Place of birth - Born in state of residence (%) - Multirace
Place of birth - Born in state of residence (%) - Other Race
Place of birth - Born in other state (%)
Place of birth - Born in other state (%) - White
Place of birth - Born in other state (%) - Black or African American
Place of birth - Born in other state (%) - Asian
Place of birth - Born in other state (%) - Hispanic or Latino
Place of birth - Born in other state (%) - American Indian and Alaska Native
Place of birth - Born in other state (%) - Multirace
Place of birth - Born in other state (%) - Other Race
Place of birth - Native, outside of US (%)
Place of birth - Native, outside of US (%) - White
Place of birth - Native, outside of US (%) - Black or African American
Place of birth - Native, outside of US (%) - Asian
Place of birth - Native, outside of US (%) - Hispanic or Latino
Place of birth - Native, outside of US (%) - American Indian and Alaska Native
Place of birth - Native, outside of US (%) - Multirace
Place of birth - Native, outside of US (%) - Other Race
Place of birth - Foreign born (%)
Place of birth - Foreign born (%) - White
Place of birth - Foreign born (%) - Black or African American
Place of birth - Foreign born (%) - Asian
Place of birth - Foreign born (%) - Hispanic or Latino
Place of birth - Foreign born (%) - American Indian and Alaska Native
Place of birth - Foreign born (%) - Multirace
Place of birth - Foreign born (%) - Other Race
Residents speaking English at home (%)
Residents speaking English at home - Born in the United States (%)
Residents speaking English at home - Native, born elsewhere (%)
Residents speaking English at home - Foreign born (%)
Residents speaking Spanish at home (%)
Residents speaking Spanish at home - Born in the United States (%)
Residents speaking Spanish at home - Native, born elsewhere (%)
Residents speaking Spanish at home - Foreign born (%)
Residents speaking other language at home (%)
Residents speaking other language at home - Born in the United States (%)
Residents speaking other language at home - Native, born elsewhere (%)
Residents speaking other language at home - Foreign born (%)
Marital status - Never married (%)
Marital status - Now married (%)
Marital status - Separated (%)
Marital status - Widowed (%)
Marital status - Divorced (%)
Ancestries Reported - Arab (%)
Ancestries Reported - Czech (%)
Ancestries Reported - Danish (%)
Ancestries Reported - Dutch (%)
Ancestries Reported - English (%)
Ancestries Reported - French (%)
Ancestries Reported - French Canadian (%)
Ancestries Reported - German (%)
Ancestries Reported - Greek (%)
Ancestries Reported - Hungarian (%)
Ancestries Reported - Irish (%)
Ancestries Reported - Italian (%)
Ancestries Reported - Lithuanian (%)
Ancestries Reported - Norwegian (%)
Ancestries Reported - Polish (%)
Ancestries Reported - Portuguese (%)
Ancestries Reported - Russian (%)
Ancestries Reported - Scotch-Irish (%)
Ancestries Reported - Scottish (%)
Ancestries Reported - Slovak (%)
Ancestries Reported - Subsaharan African (%)
Ancestries Reported - Swedish (%)
Ancestries Reported - Swiss (%)
Ancestries Reported - Ukrainian (%)
Ancestries Reported - United States (%)
Ancestries Reported - Welsh (%)
Ancestries Reported - West Indian (%)
Ancestries Reported - Other (%)
Geographical mobility - Same house 1 year ago (%)
Geographical mobility - Same house 1 year ago (%) - White
Geographical mobility - Same house 1 year ago (%) - Black or African American
Geographical mobility - Same house 1 year ago (%) - Asian
Geographical mobility - Same house 1 year ago (%) - Hispanic or Latino
Geographical mobility - Same house 1 year ago (%) - American Indian and Alaska Native
Geographical mobility - Same house 1 year ago (%) - Multirace
Geographical mobility - Same house 1 year ago (%) - Other Race
Geographical mobility - Moved within same county (%)
Geographical mobility - Moved within same county (%) - White
Geographical mobility - Moved within same county (%) - Black or African American
Geographical mobility - Moved within same county (%) - Asian
Geographical mobility - Moved within same county (%) - Hispanic or Latino
Geographical mobility - Moved within same county (%) - American Indian and Alaska Native
Geographical mobility - Moved within same county (%) - Multirace
Geographical mobility - Moved within same county (%) - Other Race
Geographical mobility - Moved from different county within same state (%)
Geographical mobility - Moved from different county within same state (%) - White
Geographical mobility - Moved from different county within same state (%) - Black or African American
Geographical mobility - Moved from different county within same state (%) - Asian
Geographical mobility - Moved from different county within same state (%) - Hispanic or Latino
Geographical mobility - Moved from different county within same state (%) - American Indian and Alaska Native
Geographical mobility - Moved from different county within same state (%) - Multirace
Geographical mobility - Moved from different county within same state (%) - Other Race
Geographical mobility - Moved from different state (%)
Geographical mobility - Moved from different state (%) - White
Geographical mobility - Moved from different state (%) - Black or African American
Geographical mobility - Moved from different state (%) - Asian
Geographical mobility - Moved from different state (%) - Hispanic or Latino
Geographical mobility - Moved from different state (%) - American Indian and Alaska Native
Geographical mobility - Moved from different state (%) - Multirace
Geographical mobility - Moved from different state (%) - Other Race
Geographical mobility - Moved from abroad (%)
Geographical mobility - Moved from abroad (%) - White
Geographical mobility - Moved from abroad (%) - Black or African American
Geographical mobility - Moved from abroad (%) - Asian
Geographical mobility - Moved from abroad (%) - Hispanic or Latino
Geographical mobility - Moved from abroad (%) - American Indian and Alaska Native
Geographical mobility - Moved from abroad (%) - Multirace
Geographical mobility - Moved from abroad (%) - Other Race
Place of birth for the foreign-born population - Ireland (%)
Place of birth for the foreign-born population - Denmark (%)
Place of birth for the foreign-born population - Norway (%)
Place of birth for the foreign-born population - Sweden (%)
Place of birth for the foreign-born population - United Kingdom (%)
Place of birth for the foreign-born population - England (%)
Place of birth for the foreign-born population - Scotland (%)
Place of birth for the foreign-born population - Other Northern Europe (%)
Place of birth for the foreign-born population - Austria (%)
Place of birth for the foreign-born population - Belgium (%)
Place of birth for the foreign-born population - France (%)
Place of birth for the foreign-born population - Germany (%)
Place of birth for the foreign-born population - Netherlands (%)
Place of birth for the foreign-born population - Switzerland (%)
Place of birth for the foreign-born population - Other Western Europe (%)
Place of birth for the foreign-born population - Greece (%)
Place of birth for the foreign-born population - Italy (%)
Place of birth for the foreign-born population - Portugal (%)
Place of birth for the foreign-born population - Spain (%)
Place of birth for the foreign-born population - Other Southern Europe (%)
Place of birth for the foreign-born population - Albania (%)
Place of birth for the foreign-born population - Belarus (%)
Place of birth for the foreign-born population - Bosnia and Herzegovina (%)
Place of birth for the foreign-born population - Bulgaria (%)
Place of birth for the foreign-born population - Croatia (%)
Place of birth for the foreign-born population - Czechoslovakia (%)
Place of birth for the foreign-born population - Hungary (%)
Place of birth for the foreign-born population - Latvia (%)
Place of birth for the foreign-born population - Lithuania (%)
Place of birth for the foreign-born population - North Macedonia (Macedonia) (%)
Place of birth for the foreign-born population - Moldova (%)
Place of birth for the foreign-born population - Poland (%)
Place of birth for the foreign-born population - Romania (%)
Place of birth for the foreign-born population - Russia (%)
Place of birth for the foreign-born population - Serbia (%)
Place of birth for the foreign-born population - Ukraine (%)
Place of birth for the foreign-born population - Other Eastern Europe (%)
Place of birth for the foreign-born population - China (%)
Place of birth for the foreign-born population - Hong Kong (%)
Place of birth for the foreign-born population - Taiwan (%)
Place of birth for the foreign-born population - Japan (%)
Place of birth for the foreign-born population - Korea (%)
Place of birth for the foreign-born population - Other Eastern Asia (%)
Place of birth for the foreign-born population - Afghanistan (%)
Place of birth for the foreign-born population - Bangladesh (%)
Place of birth for the foreign-born population - India (%)
Place of birth for the foreign-born population - Iran (%)
Place of birth for the foreign-born population - Kazakhstan (%)
Place of birth for the foreign-born population - Nepal (%)
Place of birth for the foreign-born population - Pakistan (%)
Place of birth for the foreign-born population - Sri Lanka (%)
Place of birth for the foreign-born population - Uzbekistan (%)
Place of birth for the foreign-born population - Other South Central Asia (%)
Place of birth for the foreign-born population - Burma (%)
Place of birth for the foreign-born population - Cambodia (%)
Place of birth for the foreign-born population - Indonesia (%)
Place of birth for the foreign-born population - Laos (%)
Place of birth for the foreign-born population - Malaysia (%)
Place of birth for the foreign-born population - Philippines (%)
Place of birth for the foreign-born population - Singapore (%)
Place of birth for the foreign-born population - Thailand (%)
Place of birth for the foreign-born population - Vietnam (%)
Place of birth for the foreign-born population - Other South Eastern Asia (%)
Place of birth for the foreign-born population - Armenia (%)
Place of birth for the foreign-born population - Iraq (%)
Place of birth for the foreign-born population - Israel (%)
Place of birth for the foreign-born population - Jordan (%)
Place of birth for the foreign-born population - Kuwait (%)
Place of birth for the foreign-born population - Lebanon (%)
Place of birth for the foreign-born population - Saudi Arabia (%)
Place of birth for the foreign-born population - Syria (%)
Place of birth for the foreign-born population - Turkey (%)
Place of birth for the foreign-born population - Yemen (%)
Place of birth for the foreign-born population - Other Western Asia (%)
Place of birth for the foreign-born population - Eritrea (%)
Place of birth for the foreign-born population - Ethiopia (%)
Place of birth for the foreign-born population - Kenya (%)
Place of birth for the foreign-born population - Somalia (%)
Place of birth for the foreign-born population - Uganda (%)
Place of birth for the foreign-born population - Zimbabwe (%)
Place of birth for the foreign-born population - Other Eastern Africa (%)
Place of birth for the foreign-born population - Cameroon (%)
Place of birth for the foreign-born population - Congo (%)
Place of birth for the foreign-born population - Democratic Republic of Congo (Zaire) (%)
Place of birth for the foreign-born population - Other Middle Africa (%)
Place of birth for the foreign-born population - Egypt (%)
Place of birth for the foreign-born population - Morocco (%)
Place of birth for the foreign-born population - Sudan (%)
Place of birth for the foreign-born population - Other Northern Africa (%)
Place of birth for the foreign-born population - South Africa (%)
Place of birth for the foreign-born population - Other Southern Africa (%)
Place of birth for the foreign-born population - Cabo Verde (%)
Place of birth for the foreign-born population - Ghana (%)
Place of birth for the foreign-born population - Liberia (%)
Place of birth for the foreign-born population - Nigeria (%)
Place of birth for the foreign-born population - Senegal (%)
Place of birth for the foreign-born population - Sierra Leone (%)
Place of birth for the foreign-born population - Other Western Africa (%)
Place of birth for the foreign-born population - Australia (%)
Place of birth for the foreign-born population - New Zealand (%)
Place of birth for the foreign-born population - Fiji (%)
Place of birth for the foreign-born population - Micronesia (%)
Place of birth for the foreign-born population - Bahamas (%)
Place of birth for the foreign-born population - Barbados (%)
Place of birth for the foreign-born population - Cuba (%)
Place of birth for the foreign-born population - Dominica (%)
Place of birth for the foreign-born population - Dominican Republic (%)
Place of birth for the foreign-born population - Grenada (%)
Place of birth for the foreign-born population - Haiti (%)
Place of birth for the foreign-born population - Jamaica (%)
Place of birth for the foreign-born population - St. Vincent and the Grenadines (%)
Place of birth for the foreign-born population - Trinidad and Tobago (%)
Place of birth for the foreign-born population - West Indies (%)
Place of birth for the foreign-born population - Other Caribbean (%)
Place of birth for the foreign-born population - Belize (%)
Place of birth for the foreign-born population - Costa Rica (%)
Place of birth for the foreign-born population - El Salvador (%)
Place of birth for the foreign-born population - Guatemala (%)
Place of birth for the foreign-born population - Honduras (%)
Place of birth for the foreign-born population - Mexico (%)
Place of birth for the foreign-born population - Nicaragua (%)
Place of birth for the foreign-born population - Panama (%)
Place of birth for the foreign-born population - Other Central America (%)
Place of birth for the foreign-born population - Argentina (%)
Place of birth for the foreign-born population - Bolivia (%)
Place of birth for the foreign-born population - Brazil (%)
Place of birth for the foreign-born population - Chile (%)
Place of birth for the foreign-born population - Colombia (%)
Place of birth for the foreign-born population - Ecuador (%)
Place of birth for the foreign-born population - Guyana (%)
Place of birth for the foreign-born population - Peru (%)
Place of birth for the foreign-born population - Uruguay (%)
Place of birth for the foreign-born population - Venezuela (%)
Place of birth for the foreign-born population - Other South America (%)
Place of birth for the foreign-born population - Canada (%)
Place of birth for the foreign-born population - Other Northern America (%)
Place of birth for the foreign-born population - Other (%)
Latest news about races in Palmer, AK collected exclusively by city-data.com from local newspapers, TV, and radio stations
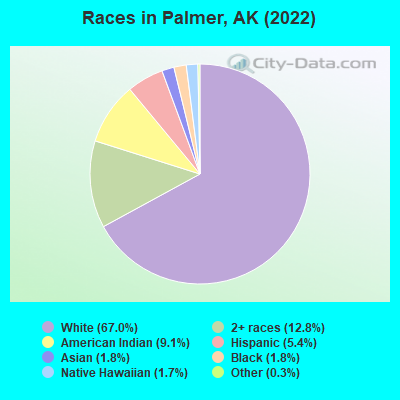
According to 2022 data, the most numerous races in Palmer, AK are White alone (4,973 residents), American Indian alone (730 residents), and Two or more races (610 residents). 94.5% of Palmer residents speak English at home. 2.9% of Palmer, AK residents are foreign-born (1.0% born in Europe, 0.9% born in Asia, 0.7% born in Latin America), which is 140.2% less than the foreign-born rate of 7.0% across the entire state of Alaska.
Race distribution in Palmer
2000 2022
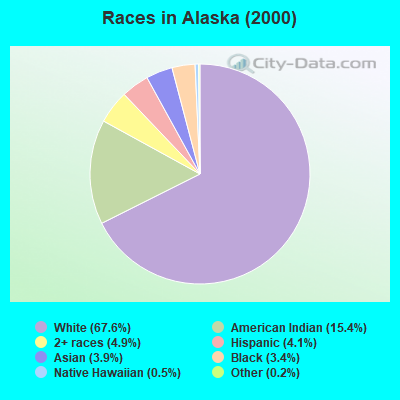
423,788 67.6% White alone 96,505 15.4% American Indian alone 30,454 4.9% Two or more races 25,852 4.1% Hispanic 24,741 3.9% Asian alone 21,073 3.4% Black alone 3,181 0.5% Native Hawaiian and Other 1,338 0.2% Other race alone
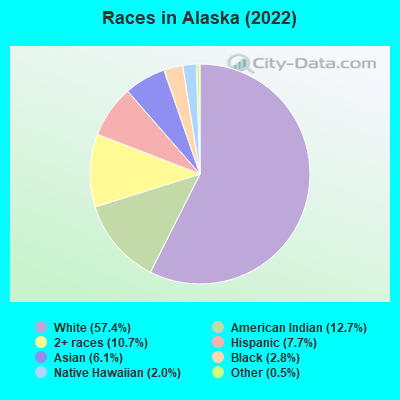
421,104 57.4% White alone 93,294 12.7% American Indian alone 78,552 10.7% Two or more races 56,491 7.7% Hispanic 44,905 6.1% Asian alone 20,664 2.8% Black alone 14,539 2.0% Native Hawaiian and Other 4,034 0.5% Other race alone
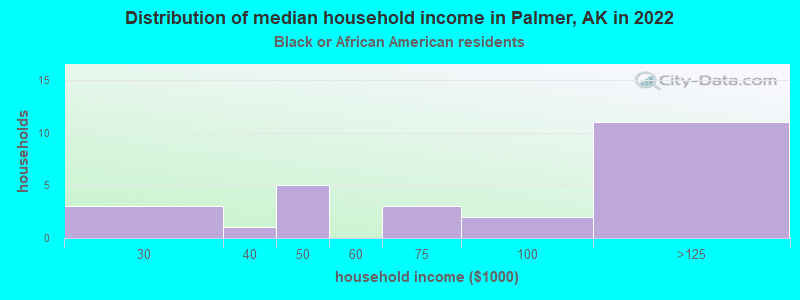
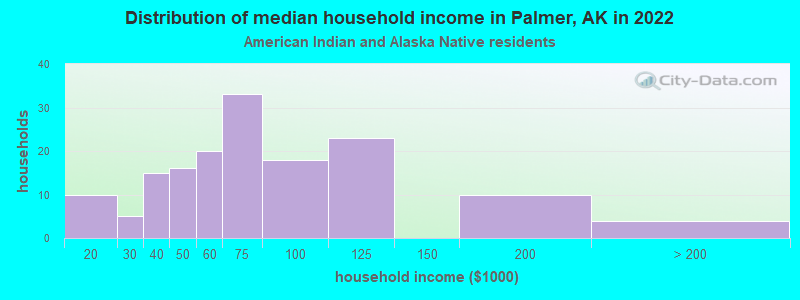
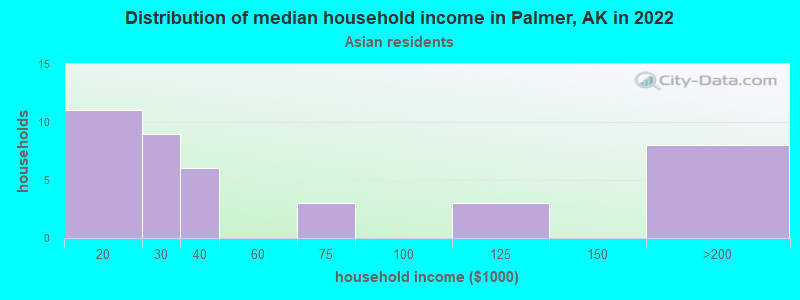
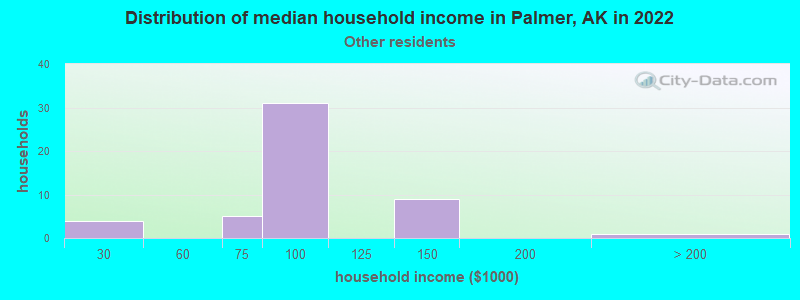
Income and house value in Palmer Median household income in 2022 $70,960 White non-Hispanic householders$53,103 Black householders$47,332 American Indian and Alaska Native householders$140,894 Asian householders$122,339 Some other race householders$67,599 Two or more races householders$62,038 Hispanic or Latino race householdersMedian 2022 house value $248,629 White Non-Hispanic householders$349,405 Black or African American householders$249,364 American Indian or Alaska Native householders $275,846 Asian householders$224,109 Some other race householders$300,365 Two or more races householders$241,763 Hispanic or Latino householders
Median age by race in Palmer
34.5 Median age for White residents34.4 35.0 22.8 Median age for Black or African American residents24.1 15.0 22.6 Median age for American Indian / Alaska Native residents20.2 23.3 43.5 Median age for Asian residents26.6 39.0 25.4 Median age for Native Hawaiian / Pacific Islander residents26.1 23.7 38.0 Median age for Other race residents28.8 58.3 18.9 Median age for Two or more races residents19.2 22.5 34.8 Median age for White alone residents34.4 35.7 27.1 Median age for Hispanic or Latino residents29.6 25.6
Owner/renter occupied households by race in Palmer
House owners and renters - White residents 1,143 65.1% Owner occupied614 34.9% Renter occupiedHouse owners and renters - Black or African American residents 27 63.0% Owner occupied16 37.0% Renter occupiedHouse owners and renters - American Indian / Alaska Native residents 93 79.1% Owner occupied25 20.9% Renter occupiedHouse owners and renters - Asian residents 12 31.9% Owner occupied25 68.1% Renter occupiedHouse owners and renters - Native Hawaiian / Pacific Islander residents 2 21.2% Owner occupied7 78.8% Renter occupiedHouse owners and renters - Other race residents 38 93.8% Owner occupied3 6.2% Renter occupiedHouse owners and renters - Two or more races residents 86 53.1% Owner occupied76 46.9% Renter occupiedHouse owners and renters - White alone residents 1,108 65.3% Owner occupied588 34.7% Renter occupiedHouse owners and renters - Hispanic or Latino residents 80 76.9% Owner occupied24 23.1% Renter occupied
Language usage in Palmer
English speakers - Total 94.5% of residents of Palmer speak English at home.
1.7% of residents speak Spanish at home 91 82.0% Speak English very well20 18.0% Speak English less than very well4.2% of residents speak other language at home 235 86.1% Speak English very well38 13.9% Speak English less than very well
English speakers - Born in the United States 97.2% of residents of Palmer speak English at home.
1.6% of residents speak Spanish at home 45 83.3% Speak English very well9 16.7% Speak English less than very well1.2% of residents speak other language at home 35 85.4% Speak English very well6 14.6% Speak English less than very well
English speakers - Native, born elsewhere 89.1% of residents of Palmer speak English at home.
4.5% of residents speak Spanish at home 5 100.0% Speak English very well4.5% of residents speak other language at home 5 100.0% Speak English very well
English speakers - Foreign-born 43.1% of residents of Palmer speak English at home.
15.2% of residents speak Spanish at home 21 65.6% Speak English very well11 34.4% Speak English less than very well43.1% of residents speak other language at home 78 85.7% Speak English very well13 14.3% Speak English less than very well
White (Caucasian) - Speak only English Native:
98.8% (4,641)Foreign-born:
56.5% (62)
White (Caucasian) - Speak another language Native:
1.6% (77)Foreign-born:
48.0% (53)
Black or African American - Speak only English Native:
92.5% (151)Foreign-born:
73.5% (6)
Black or African American - Speak another language Native:
3.5% (6)Foreign-born:
41.5% (3)
Asian - Speak only English Native:
72.5% (20)Foreign-born:
55.5% (32)
Asian - Speak another language Native:
29.1% (8)Foreign-born:
46.4% (27)
Native Hawaiian / Pacific Islander - Speak another language Native:
4.9% (4)Foreign-born:
100.0% (12)
Other race - Speak another language Native:
20.6% (22)Foreign-born:
93.8% (27)
White alone - Speak only English Native:
99.2% (4,504)Foreign-born:
54.4% (62)
White alone - Speak another language Native:
1.2% (53)Foreign-born:
47.9% (55)
Hispanic or Latino - Speak only English Native:
81.1% (323)Foreign-born:
15.6% (6)
Hispanic or Latino - Speak another language Native:
16.7% (66)Foreign-born:
83.8% (33)
Foreign-born residents in Palmer 213 residents are foreign born (1.0% Europe , 0.9% Asia , 0.7% Latin America ).
This city:
2.9%Alaska:
100.0%
Marital status for residents in Palmer Marital status - White (Caucasian) population 15 years and over
Males 37.9% Never married43.9% Now married1.5% Separated3.5% Widowed13.2% DivorcedFemales 31.6% Never married41.7% Now married2.6% Separated6.6% Widowed17.5% DivorcedWomen who gave birth in the past 12 months Now married:
61.7% (47)Unmarried:
38.3% (29)
Women who did not give birth in the past 12 months Now married:
43.6% (486)Unmarried:
56.4% (629)
Marital status - Black or African American population 15 years and over
Males 76.2% Never married14.9% Now married5.9% Separated0.0% Widowed3.0% DivorcedFemales 23.5% Never married29.4% Now married11.8% Separated17.6% Widowed17.6% DivorcedWomen who gave birth in the past 12 months Now married:
100.0% (9)Unmarried:
0.0% (0)
Women who did not give birth in the past 12 months Now married:
25.0% (4)Unmarried:
75.0% (11)
Marital status - American Indian / Alaska Native population 15 years and over
Males 73.7% Never married12.9% Now married0.0% Separated1.3% Widowed12.1% DivorcedFemales 58.1% Never married23.8% Now married5.6% Separated4.8% Widowed7.7% DivorcedWomen who gave birth in the past 12 months Now married:
41.9% (13)Unmarried:
58.1% (18)
Women who did not give birth in the past 12 months Now married:
18.0% (29)Unmarried:
82.0% (131)
Marital status - Asian population 15 years and over
Males 66.7% Never married25.6% Now married0.0% Separated0.0% Widowed7.7% DivorcedFemales 60.9% Never married28.3% Now married0.0% Separated10.9% Widowed0.0% DivorcedWomen who did not give birth in the past 12 months Now married:
13.9% (4)Unmarried:
86.1% (26)
Marital status - Native Hawaiian / Pacific Islander population 15 years and over
Males 75.0% Never married25.0% Now married0.0% Separated0.0% Widowed0.0% DivorcedFemales 38.6% Never married22.7% Now married0.0% Separated38.6% Widowed0.0% DivorcedWomen who did not give birth in the past 12 months Now married:
37.0% (13)Unmarried:
63.0% (22)
Marital status - Other race population 15 years and over
Males 7.9% Never married84.2% Now married0.0% Separated0.0% Widowed7.9% DivorcedFemales 29.8% Never married51.1% Now married0.0% Separated14.9% Widowed4.3% DivorcedWomen who did not give birth in the past 12 months Now married:
85.7% (26)Unmarried:
14.3% (4)
Marital status - Two or more races population 15 years and over
Males 70.1% Never married13.7% Now married7.6% Separated0.0% Widowed8.6% DivorcedFemales 26.5% Never married38.1% Now married7.4% Separated3.7% Widowed24.3% DivorcedWomen who gave birth in the past 12 months Now married:
42.9% (4)Unmarried:
57.1% (5)
Women who did not give birth in the past 12 months Now married:
54.4% (98)Unmarried:
45.6% (82)
Marital status - White alone, not Hispanic / Latino population 15 years and over
Males 37.9% Never married43.5% Now married1.6% Separated3.6% Widowed13.4% DivorcedFemales 31.2% Never married41.5% Now married2.7% Separated6.4% Widowed18.2% DivorcedWomen who gave birth in the past 12 months Now married:
55.7% (37)Unmarried:
44.3% (30)
Women who did not give birth in the past 12 months Now married:
43.8% (474)Unmarried:
56.2% (608)
Marital status - Hispanic or Latino population 15 years and over
Males 42.6% Never married51.2% Now married0.0% Separated0.0% Widowed6.2% DivorcedFemales 30.6% Never married49.6% Now married0.0% Separated14.9% Widowed5.0% DivorcedWomen who gave birth in the past 12 months Now married:
100.0% (11)Unmarried:
0.0% (0)
Women who did not give birth in the past 12 months Now married:
51.2% (42)Unmarried:
48.8% (40)
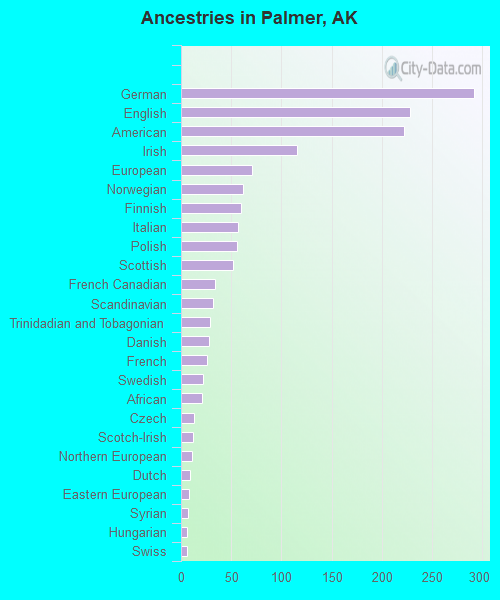
Ancestries in Palmer
317 10.4% American315 10.3% English275 9.0% German180 5.9% European152 5.0% Irish58 1.9% Italian51 1.7% Norwegian39 1.3% Scottish33 1.1% Polish30 1.0% French29 1.0% Finnish26 0.9% Dutch26 0.9% Eastern European20 0.7% Scotch-Irish19 0.6% Scandinavian18 0.6% African17 0.6% Swedish14 0.5% Austrian14 0.5% French Canadian13 0.4% Celtic11 0.4% Czech11 0.4% Russian8 0.3% Ukrainian8 0.3% Welsh7 0.2% Croatian6 0.2% Portuguese5 0.2% Australian5 0.2% Danish4 0.1% Armenian4 0.1% British4 0.1% Slovene3 0.10% Greek3 0.10% Northern European1 0.03% Cajun
Children Nativity (place of birth) in Palmer
Children under 6 years - Living with two parents Both parents native 306 100.0% NativeBoth parents foreign-born 4 100.0% NativeOne native, one foreign-born parent 55 100.0% NativeChildren under 6 years - Living with one parent Native parent 211 100.0% NativeForeign-born parent 13 100.0% NativeChildren 6 to 17 years - Living with two parents Both parents native 722 100.0% Native0 0.0% Foreign-bornBoth parents foreign-born 9 69.8% Native4 30.2% Foreign-bornOne native, one foreign-born parent 56 100.0% NativeChildren 6 to 17 years - Living with one parent Native parent 381 100.0% NativeForeign-born parent 8 48.3% Native9 51.7% Foreign-born
Grandparents responsible for own grandchildren in Palmer
Grandparents (30 to 59 years) White / Caucasian 8 19.3% Responsible for grandchildren34 80.7% Not responsible for grandchildrenAmerican Indian / Alaska Native 1 100.0% Not responsible for grandchildrenAsian 10 100.0% Not responsible for grandchildrenNative Hawaiian / Pacific Islander 10 100.0% Not responsible for grandchildrenTwo or more races 5 100.0% Not responsible for grandchildrenWhite alone, not Hispanic / Latino 8 18.9% Responsible for grandchildren34 81.1% Not responsible for grandchildrenGrandparents (60 years and over) White / Caucasian 26 30.2% Responsible for grandchildren60 69.8% Not responsible for grandchildrenAmerican Indian / Alaska Native 3 23.3% Responsible for grandchildren9 76.7% Not responsible for grandchildrenAsian 9 100.0% Not responsible for grandchildrenNative Hawaiian / Pacific Islander 57 100.0% Not responsible for grandchildrenWhite alone, not Hispanic / Latino 27 30.2% Responsible for grandchildren61 69.8% Not responsible for grandchildren