Races in Peekskill, New York (NY) Detailed Stats
Data:
Races - White alone (%)
Races - White alone (% change since 2000)
Races - Black alone (%)
Races - Black alone (% change since 2000)
Races - American Indian alone (%)
Races - American Indian alone (% change since 2000)
Races - Asian alone (%)
Races - Asian alone (% change since 2000)
Races - Hispanic (%)
Races - Hispanic (% change since 2000)
Races - Native Hawaiian and Other Pacific Islander alone (%)
Races - Native Hawaiian and Other Pacific Islander alone (% change since 2000)
Races - Two or more races(%)
Races - Two or more races(% change since 2000)
Races - Other race alone (%)
Races - Other race alone (% change since 2000)
Racial diversity
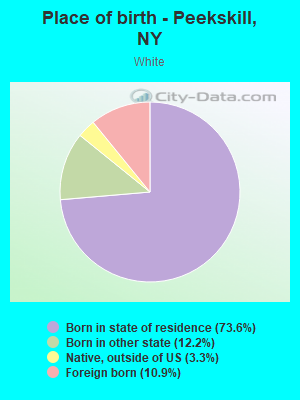
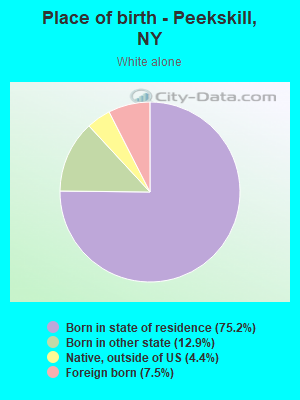
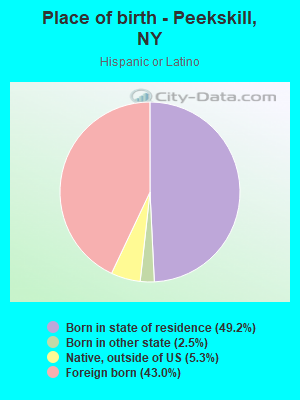
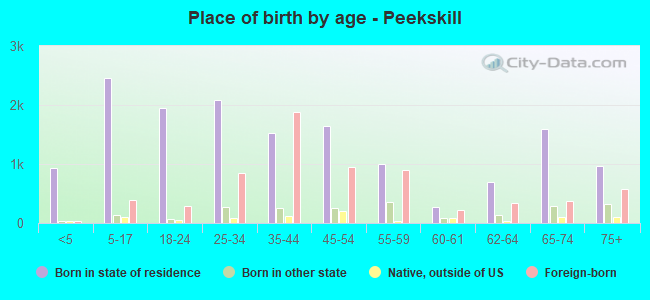
Place of birth - Born in state of residence (%)
Place of birth - Born in state of residence (%) - White
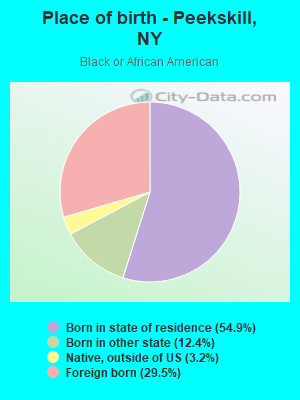
Place of birth - Born in state of residence (%) - Black or African American
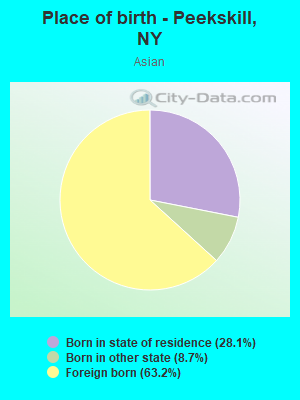
Place of birth - Born in state of residence (%) - Asian
Place of birth - Born in state of residence (%) - Hispanic or Latino
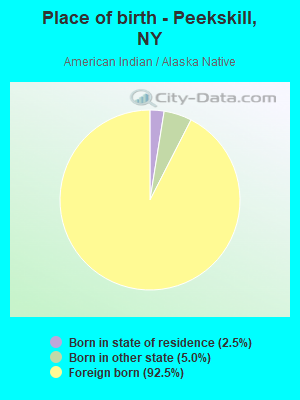
Place of birth - Born in state of residence (%) - American Indian and Alaska Native
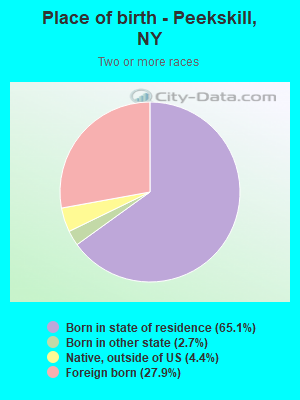
Place of birth - Born in state of residence (%) - Multirace
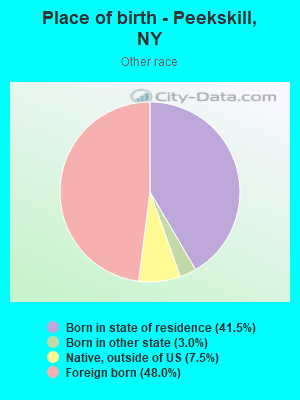
Place of birth - Born in state of residence (%) - Other Race
Place of birth - Born in other state (%)
Place of birth - Born in other state (%) - White
Place of birth - Born in other state (%) - Black or African American
Place of birth - Born in other state (%) - Asian
Place of birth - Born in other state (%) - Hispanic or Latino
Place of birth - Born in other state (%) - American Indian and Alaska Native
Place of birth - Born in other state (%) - Multirace
Place of birth - Born in other state (%) - Other Race
Place of birth - Native, outside of US (%)
Place of birth - Native, outside of US (%) - White
Place of birth - Native, outside of US (%) - Black or African American
Place of birth - Native, outside of US (%) - Asian
Place of birth - Native, outside of US (%) - Hispanic or Latino
Place of birth - Native, outside of US (%) - American Indian and Alaska Native
Place of birth - Native, outside of US (%) - Multirace
Place of birth - Native, outside of US (%) - Other Race
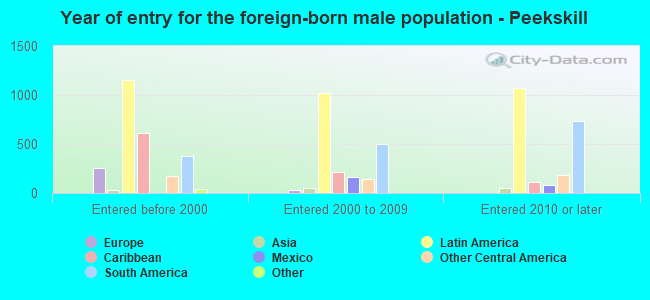
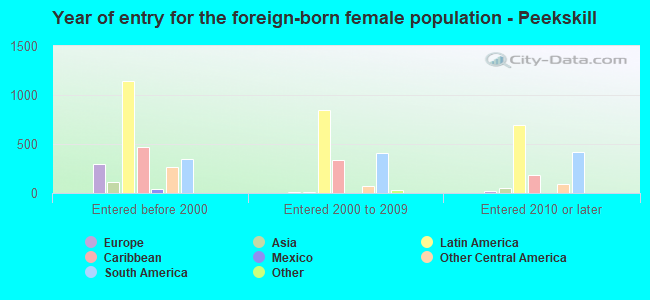
Place of birth - Foreign born (%)
Place of birth - Foreign born (%) - White
Place of birth - Foreign born (%) - Black or African American
Place of birth - Foreign born (%) - Asian
Place of birth - Foreign born (%) - Hispanic or Latino
Place of birth - Foreign born (%) - American Indian and Alaska Native
Place of birth - Foreign born (%) - Multirace
Place of birth - Foreign born (%) - Other Race
Residents speaking English at home (%)
Residents speaking English at home - Born in the United States (%)
Residents speaking English at home - Native, born elsewhere (%)
Residents speaking English at home - Foreign born (%)
Residents speaking Spanish at home (%)
Residents speaking Spanish at home - Born in the United States (%)
Residents speaking Spanish at home - Native, born elsewhere (%)
Residents speaking Spanish at home - Foreign born (%)
Residents speaking other language at home (%)
Residents speaking other language at home - Born in the United States (%)
Residents speaking other language at home - Native, born elsewhere (%)
Residents speaking other language at home - Foreign born (%)
Marital status - Never married (%)
Marital status - Now married (%)
Marital status - Separated (%)
Marital status - Widowed (%)
Marital status - Divorced (%)
Ancestries Reported - Arab (%)
Ancestries Reported - Czech (%)
Ancestries Reported - Danish (%)
Ancestries Reported - Dutch (%)
Ancestries Reported - English (%)
Ancestries Reported - French (%)
Ancestries Reported - French Canadian (%)
Ancestries Reported - German (%)
Ancestries Reported - Greek (%)
Ancestries Reported - Hungarian (%)
Ancestries Reported - Irish (%)
Ancestries Reported - Italian (%)
Ancestries Reported - Lithuanian (%)
Ancestries Reported - Norwegian (%)
Ancestries Reported - Polish (%)
Ancestries Reported - Portuguese (%)
Ancestries Reported - Russian (%)
Ancestries Reported - Scotch-Irish (%)
Ancestries Reported - Scottish (%)
Ancestries Reported - Slovak (%)
Ancestries Reported - Subsaharan African (%)
Ancestries Reported - Swedish (%)
Ancestries Reported - Swiss (%)
Ancestries Reported - Ukrainian (%)
Ancestries Reported - United States (%)
Ancestries Reported - Welsh (%)
Ancestries Reported - West Indian (%)
Ancestries Reported - Other (%)
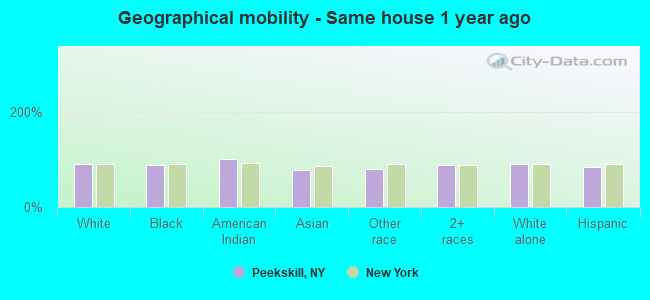
Geographical mobility - Same house 1 year ago (%)
Geographical mobility - Same house 1 year ago (%) - White
Geographical mobility - Same house 1 year ago (%) - Black or African American
Geographical mobility - Same house 1 year ago (%) - Asian
Geographical mobility - Same house 1 year ago (%) - Hispanic or Latino
Geographical mobility - Same house 1 year ago (%) - American Indian and Alaska Native
Geographical mobility - Same house 1 year ago (%) - Multirace
Geographical mobility - Same house 1 year ago (%) - Other Race
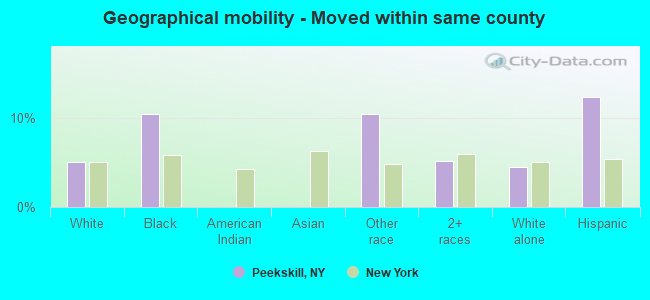
Geographical mobility - Moved within same county (%)
Geographical mobility - Moved within same county (%) - White
Geographical mobility - Moved within same county (%) - Black or African American
Geographical mobility - Moved within same county (%) - Asian
Geographical mobility - Moved within same county (%) - Hispanic or Latino
Geographical mobility - Moved within same county (%) - American Indian and Alaska Native
Geographical mobility - Moved within same county (%) - Multirace
Geographical mobility - Moved within same county (%) - Other Race
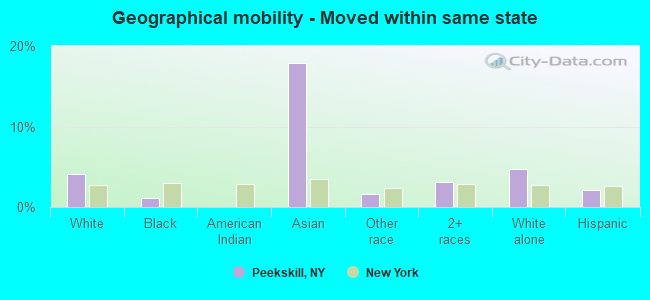
Geographical mobility - Moved from different county within same state (%)
Geographical mobility - Moved from different county within same state (%) - White
Geographical mobility - Moved from different county within same state (%) - Black or African American
Geographical mobility - Moved from different county within same state (%) - Asian
Geographical mobility - Moved from different county within same state (%) - Hispanic or Latino
Geographical mobility - Moved from different county within same state (%) - American Indian and Alaska Native
Geographical mobility - Moved from different county within same state (%) - Multirace
Geographical mobility - Moved from different county within same state (%) - Other Race
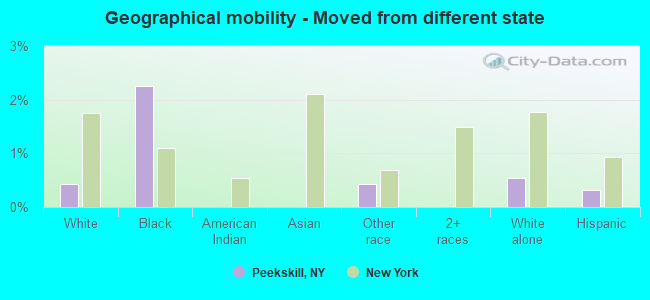
Geographical mobility - Moved from different state (%)
Geographical mobility - Moved from different state (%) - White
Geographical mobility - Moved from different state (%) - Black or African American
Geographical mobility - Moved from different state (%) - Asian
Geographical mobility - Moved from different state (%) - Hispanic or Latino
Geographical mobility - Moved from different state (%) - American Indian and Alaska Native
Geographical mobility - Moved from different state (%) - Multirace
Geographical mobility - Moved from different state (%) - Other Race
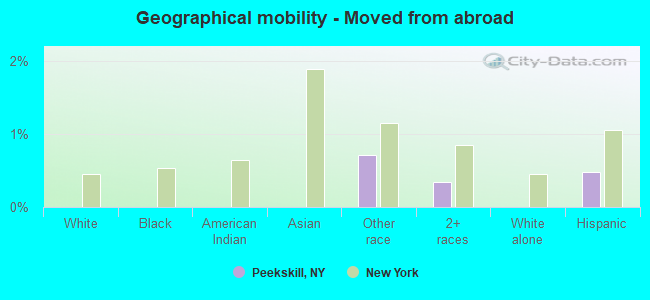
Geographical mobility - Moved from abroad (%)
Geographical mobility - Moved from abroad (%) - White
Geographical mobility - Moved from abroad (%) - Black or African American
Geographical mobility - Moved from abroad (%) - Asian
Geographical mobility - Moved from abroad (%) - Hispanic or Latino
Geographical mobility - Moved from abroad (%) - American Indian and Alaska Native
Geographical mobility - Moved from abroad (%) - Multirace
Geographical mobility - Moved from abroad (%) - Other Race
Place of birth for the foreign-born population - Ireland (%)
Place of birth for the foreign-born population - Denmark (%)
Place of birth for the foreign-born population - Norway (%)
Place of birth for the foreign-born population - Sweden (%)
Place of birth for the foreign-born population - United Kingdom (%)
Place of birth for the foreign-born population - England (%)
Place of birth for the foreign-born population - Scotland (%)
Place of birth for the foreign-born population - Other Northern Europe (%)
Place of birth for the foreign-born population - Austria (%)
Place of birth for the foreign-born population - Belgium (%)
Place of birth for the foreign-born population - France (%)
Place of birth for the foreign-born population - Germany (%)
Place of birth for the foreign-born population - Netherlands (%)
Place of birth for the foreign-born population - Switzerland (%)
Place of birth for the foreign-born population - Other Western Europe (%)
Place of birth for the foreign-born population - Greece (%)
Place of birth for the foreign-born population - Italy (%)
Place of birth for the foreign-born population - Portugal (%)
Place of birth for the foreign-born population - Spain (%)
Place of birth for the foreign-born population - Other Southern Europe (%)
Place of birth for the foreign-born population - Albania (%)
Place of birth for the foreign-born population - Belarus (%)
Place of birth for the foreign-born population - Bosnia and Herzegovina (%)
Place of birth for the foreign-born population - Bulgaria (%)
Place of birth for the foreign-born population - Croatia (%)
Place of birth for the foreign-born population - Czechoslovakia (%)
Place of birth for the foreign-born population - Hungary (%)
Place of birth for the foreign-born population - Latvia (%)
Place of birth for the foreign-born population - Lithuania (%)
Place of birth for the foreign-born population - North Macedonia (Macedonia) (%)
Place of birth for the foreign-born population - Moldova (%)
Place of birth for the foreign-born population - Poland (%)
Place of birth for the foreign-born population - Romania (%)
Place of birth for the foreign-born population - Russia (%)
Place of birth for the foreign-born population - Serbia (%)
Place of birth for the foreign-born population - Ukraine (%)
Place of birth for the foreign-born population - Other Eastern Europe (%)
Place of birth for the foreign-born population - China (%)
Place of birth for the foreign-born population - Hong Kong (%)
Place of birth for the foreign-born population - Taiwan (%)
Place of birth for the foreign-born population - Japan (%)
Place of birth for the foreign-born population - Korea (%)
Place of birth for the foreign-born population - Other Eastern Asia (%)
Place of birth for the foreign-born population - Afghanistan (%)
Place of birth for the foreign-born population - Bangladesh (%)
Place of birth for the foreign-born population - India (%)
Place of birth for the foreign-born population - Iran (%)
Place of birth for the foreign-born population - Kazakhstan (%)
Place of birth for the foreign-born population - Nepal (%)
Place of birth for the foreign-born population - Pakistan (%)
Place of birth for the foreign-born population - Sri Lanka (%)
Place of birth for the foreign-born population - Uzbekistan (%)
Place of birth for the foreign-born population - Other South Central Asia (%)
Place of birth for the foreign-born population - Burma (%)
Place of birth for the foreign-born population - Cambodia (%)
Place of birth for the foreign-born population - Indonesia (%)
Place of birth for the foreign-born population - Laos (%)
Place of birth for the foreign-born population - Malaysia (%)
Place of birth for the foreign-born population - Philippines (%)
Place of birth for the foreign-born population - Singapore (%)
Place of birth for the foreign-born population - Thailand (%)
Place of birth for the foreign-born population - Vietnam (%)
Place of birth for the foreign-born population - Other South Eastern Asia (%)
Place of birth for the foreign-born population - Armenia (%)
Place of birth for the foreign-born population - Iraq (%)
Place of birth for the foreign-born population - Israel (%)
Place of birth for the foreign-born population - Jordan (%)
Place of birth for the foreign-born population - Kuwait (%)
Place of birth for the foreign-born population - Lebanon (%)
Place of birth for the foreign-born population - Saudi Arabia (%)
Place of birth for the foreign-born population - Syria (%)
Place of birth for the foreign-born population - Turkey (%)
Place of birth for the foreign-born population - Yemen (%)
Place of birth for the foreign-born population - Other Western Asia (%)
Place of birth for the foreign-born population - Eritrea (%)
Place of birth for the foreign-born population - Ethiopia (%)
Place of birth for the foreign-born population - Kenya (%)
Place of birth for the foreign-born population - Somalia (%)
Place of birth for the foreign-born population - Uganda (%)
Place of birth for the foreign-born population - Zimbabwe (%)
Place of birth for the foreign-born population - Other Eastern Africa (%)
Place of birth for the foreign-born population - Cameroon (%)
Place of birth for the foreign-born population - Congo (%)
Place of birth for the foreign-born population - Democratic Republic of Congo (Zaire) (%)
Place of birth for the foreign-born population - Other Middle Africa (%)
Place of birth for the foreign-born population - Egypt (%)
Place of birth for the foreign-born population - Morocco (%)
Place of birth for the foreign-born population - Sudan (%)
Place of birth for the foreign-born population - Other Northern Africa (%)
Place of birth for the foreign-born population - South Africa (%)
Place of birth for the foreign-born population - Other Southern Africa (%)
Place of birth for the foreign-born population - Cabo Verde (%)
Place of birth for the foreign-born population - Ghana (%)
Place of birth for the foreign-born population - Liberia (%)
Place of birth for the foreign-born population - Nigeria (%)
Place of birth for the foreign-born population - Senegal (%)
Place of birth for the foreign-born population - Sierra Leone (%)
Place of birth for the foreign-born population - Other Western Africa (%)
Place of birth for the foreign-born population - Australia (%)
Place of birth for the foreign-born population - New Zealand (%)
Place of birth for the foreign-born population - Fiji (%)
Place of birth for the foreign-born population - Micronesia (%)
Place of birth for the foreign-born population - Bahamas (%)
Place of birth for the foreign-born population - Barbados (%)
Place of birth for the foreign-born population - Cuba (%)
Place of birth for the foreign-born population - Dominica (%)
Place of birth for the foreign-born population - Dominican Republic (%)
Place of birth for the foreign-born population - Grenada (%)
Place of birth for the foreign-born population - Haiti (%)
Place of birth for the foreign-born population - Jamaica (%)
Place of birth for the foreign-born population - St. Vincent and the Grenadines (%)
Place of birth for the foreign-born population - Trinidad and Tobago (%)
Place of birth for the foreign-born population - West Indies (%)
Place of birth for the foreign-born population - Other Caribbean (%)
Place of birth for the foreign-born population - Belize (%)
Place of birth for the foreign-born population - Costa Rica (%)
Place of birth for the foreign-born population - El Salvador (%)
Place of birth for the foreign-born population - Guatemala (%)
Place of birth for the foreign-born population - Honduras (%)
Place of birth for the foreign-born population - Mexico (%)
Place of birth for the foreign-born population - Nicaragua (%)
Place of birth for the foreign-born population - Panama (%)
Place of birth for the foreign-born population - Other Central America (%)
Place of birth for the foreign-born population - Argentina (%)
Place of birth for the foreign-born population - Bolivia (%)
Place of birth for the foreign-born population - Brazil (%)
Place of birth for the foreign-born population - Chile (%)
Place of birth for the foreign-born population - Colombia (%)
Place of birth for the foreign-born population - Ecuador (%)
Place of birth for the foreign-born population - Guyana (%)
Place of birth for the foreign-born population - Peru (%)
Place of birth for the foreign-born population - Uruguay (%)
Place of birth for the foreign-born population - Venezuela (%)
Place of birth for the foreign-born population - Other South America (%)
Place of birth for the foreign-born population - Canada (%)
Place of birth for the foreign-born population - Other Northern America (%)
Place of birth for the foreign-born population - Other (%)
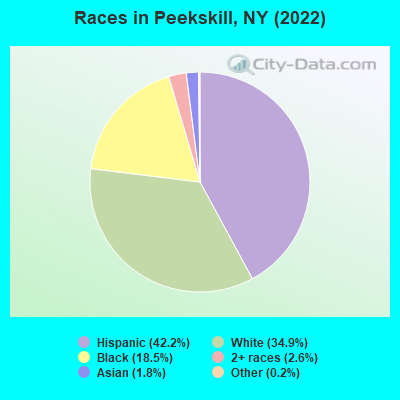
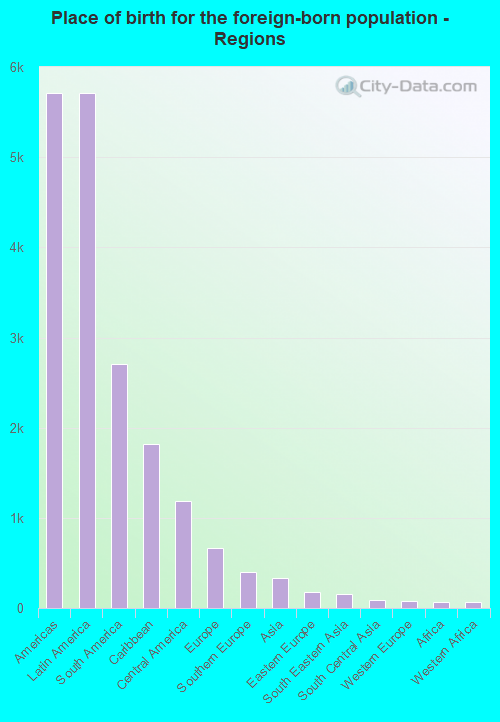
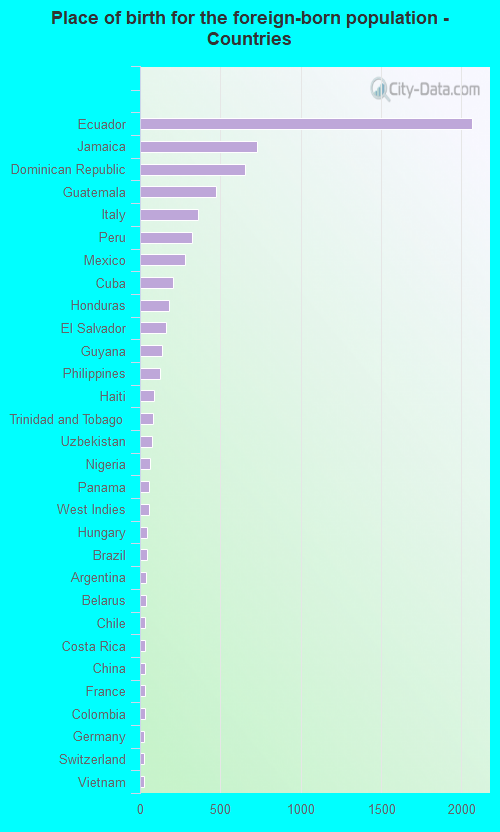
According to 2022 data, the most numerous races in Peekskill, NY are White alone (8,800 residents), Hispanic (10,629 residents), and Black alone (4,659 residents). 60.0% of Peekskill residents speak English at home. 26.9% of Peekskill, NY residents are foreign-born (22.7% born in Latin America), which is 18.2% greater than the foreign-born rate of 22.0% across the entire state of New York.
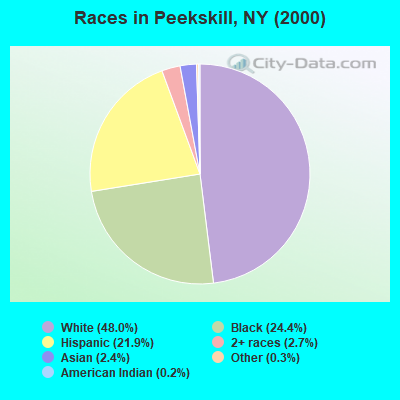
Race distribution in Peekskill
2000 2022
11,760,981 62.0% White alone 2,867,583 15.1% Hispanic 2,812,623 14.8% Black alone 1,035,926 5.5% Asian alone 366,116 1.9% Two or more races 75,499 0.4% Other race alone 52,499 0.3% American Indian alone 5,230 0.03% Native Hawaiian and Other
10,408,933 52.9% White alone 3,867,299 19.7% Hispanic 2,633,840 13.4% Black alone 1,776,286 9.0% Asian alone 732,670 3.7% Two or more races 216,110 1.1% Other race alone 35,082 0.2% American Indian alone 6,931 0.04% Native Hawaiian and Other
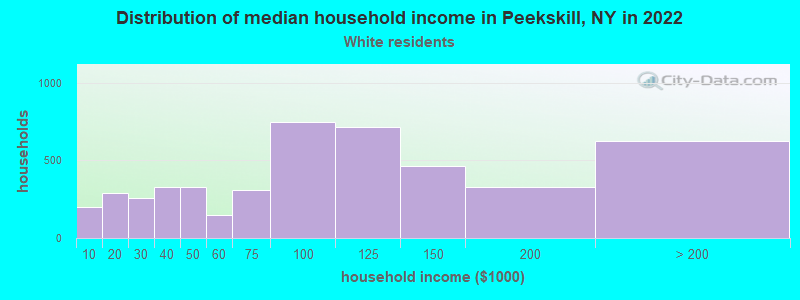
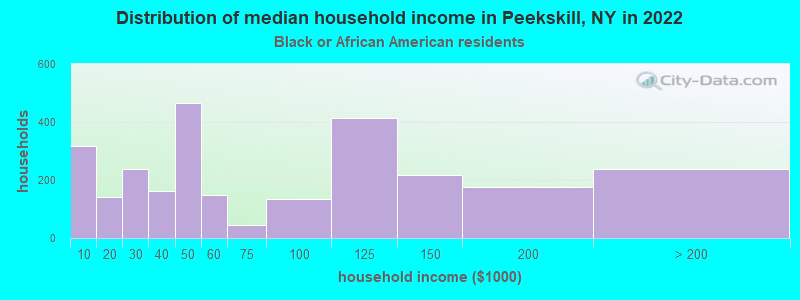
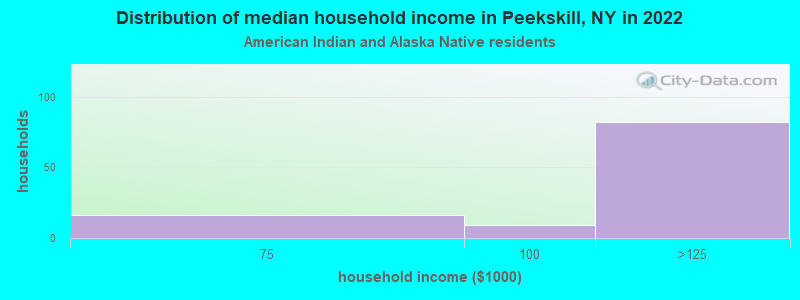
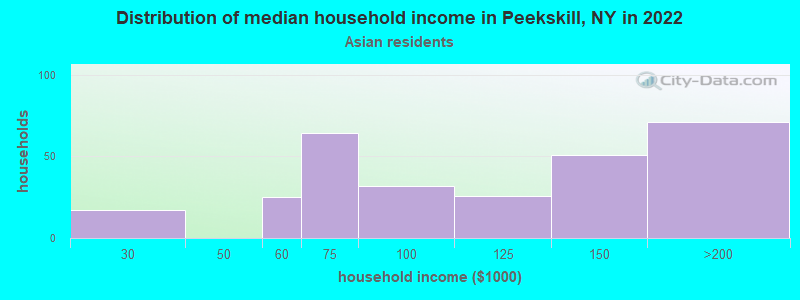
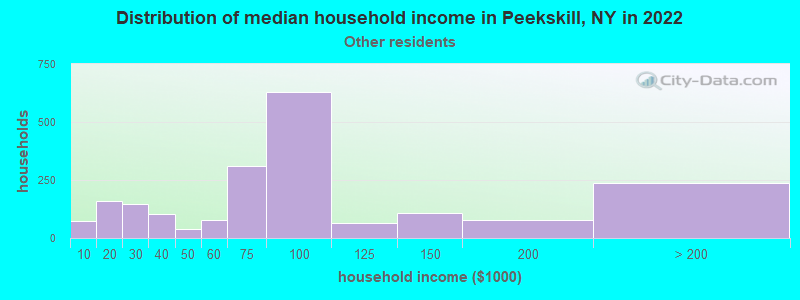
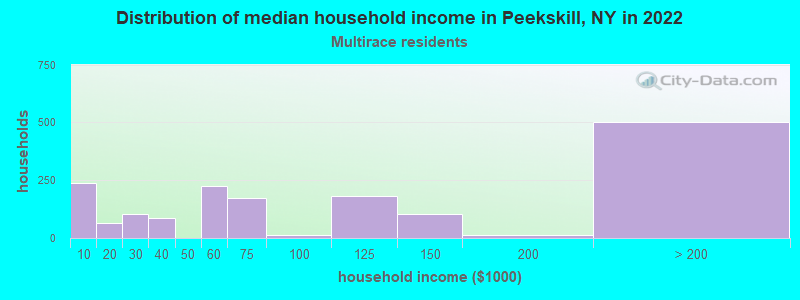
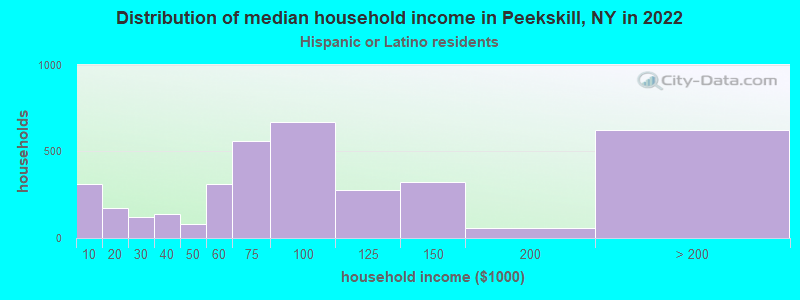
Income and house value in Peekskill Median household income in 2022 $80,351 White non-Hispanic householders$52,907 Black householders$154,235 American Indian and Alaska Native householders$118,779 Asian householders$74,740 Some other race householders$87,336 Two or more races householders$77,223 Hispanic or Latino race householdersMedian 2022 house value $396,859 White Non-Hispanic householders$392,648 Black or African American householders $557,387 Asian householders$411,971 Some other race householders$347,809 Two or more races householders$424,109 Hispanic or Latino householders
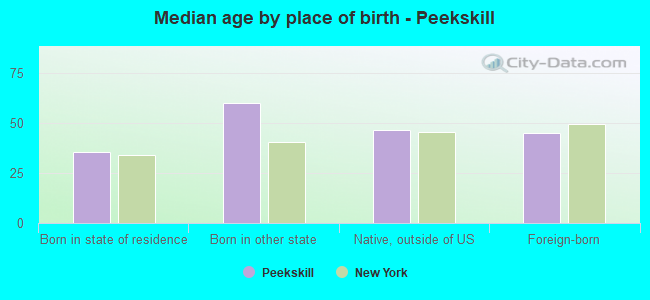
Median age by race in Peekskill
53.0 Median age for White residents50.7 54.9 41.6 Median age for Black or African American residents42.2 42.0 42.1 Median age for American Indian / Alaska Native residents43.7 42.5 36.5 Median age for Asian residents32.1 40.6 -487,992,314.6 Median age for Native Hawaiian / Pacific Islander residents-477,502,295.2 -666,666,666.0 35.5 Median age for Other race residents33.1 35.9 39.4 Median age for Two or more races residents40.6 36.9 57.5 Median age for White alone residents55.0 59.6 35.9 Median age for Hispanic or Latino residents36.3 34.5
Owner/renter occupied households by race in Peekskill
House owners and renters - White residents 3,482 74.4% Owner occupied1,199 25.6% Renter occupiedHouse owners and renters - Black or African American residents 1,207 46.7% Owner occupied1,380 53.3% Renter occupiedHouse owners and renters - American Indian / Alaska Native residents 123 100.0% Renter occupiedHouse owners and renters - Asian residents 245 83.9% Owner occupied47 16.1% Renter occupiedHouse owners and renters - Other race residents 703 34.4% Owner occupied1,343 65.6% Renter occupiedHouse owners and renters - Two or more races residents 925 53.8% Owner occupied794 46.2% Renter occupiedHouse owners and renters - White alone residents 3,381 75.9% Owner occupied1,074 24.1% Renter occupiedHouse owners and renters - Hispanic or Latino residents 1,451 40.6% Owner occupied2,127 59.4% Renter occupied
Language usage in Peekskill
English speakers - Total 60.0% of residents of Peekskill speak English at home.
33.3% of residents speak Spanish at home 4,459 55.2% Speak English very well3,620 44.8% Speak English less than very well7.4% of residents speak other language at home 1,000 55.6% Speak English very well800 44.4% Speak English less than very well
English speakers - Born in the United States 90.8% of residents of Peekskill speak English at home.
6.7% of residents speak Spanish at home 126 88.1% Speak English very well17 11.9% Speak English less than very well2.5% of residents speak other language at home 53 100.0% Speak English very well
English speakers - Native, born elsewhere 55.4% of residents of Peekskill speak English at home.
35.3% of residents speak Spanish at home 277 72.1% Speak English very well107 27.9% Speak English less than very well1.8% of residents speak other language at home 13 65.0% Speak English very well7 35.0% Speak English less than very well
English speakers - Foreign-born 17.7% of residents of Peekskill speak English at home.
63.0% of residents speak Spanish at home 1,622 37.7% Speak English very well2,677 62.3% Speak English less than very well18.5% of residents speak other language at home 534 42.4% Speak English very well726 57.6% Speak English less than very well
White (Caucasian) - Speak only English Native:
87.4% (7,700)Foreign-born:
5.5% (58)
White (Caucasian) - Speak another language Native:
11.6% (1,018)Foreign-born:
83.7% (888)
Black or African American - Speak only English Native:
97.7% (3,100)Foreign-born:
64.2% (915)
Black or African American - Speak another language Native:
3.6% (114)Foreign-born:
35.6% (508)
American Indian / Alaska Native - Speak another language Native:
28.9% (12)Foreign-born:
100.0% (343)
Asian - Speak only English Native:
39.6% (49)Foreign-born:
25.1% (80)
Asian - Speak another language Native:
60.7% (75)Foreign-born:
75.4% (241)
Other race - Speak only English Native:
28.4% (766)Foreign-born:
3.7% (107)
Other race - Speak another language Native:
71.0% (1,912)Foreign-born:
94.4% (2,690)
Two or more races - Speak only English Native:
59.4% (1,829)Foreign-born:
8.2% (107)
Two or more races - Speak another language Native:
40.6% (1,251)Foreign-born:
92.2% (1,203)
White alone - Speak only English Native:
92.8% (7,518)Foreign-born:
8.9% (59)
White alone - Speak another language Native:
7.2% (585)Foreign-born:
85.7% (567)
Hispanic or Latino - Speak only English Native:
34.2% (1,891)Foreign-born:
4.1% (188)
Hispanic or Latino - Speak another language Native:
65.9% (3,643)Foreign-born:
95.1% (4,332)
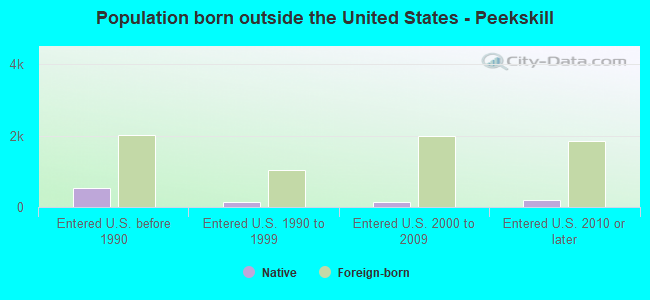
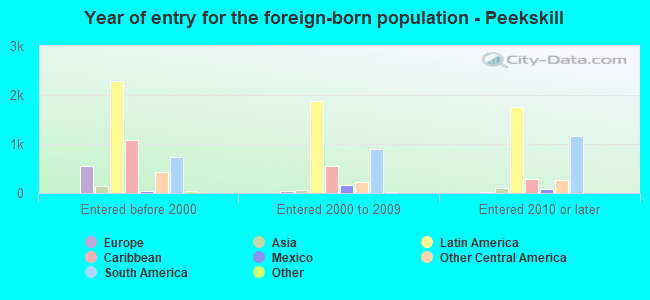
Foreign-born residents in Peekskill 6,778 residents are foreign born (22.7% Latin America ).
This city:
26.9%New York:
22.6%
Marital status for residents in Peekskill Marital status - White (Caucasian) population 15 years and over
Males 30.2% Never married49.7% Now married4.3% Separated3.7% Widowed12.1% DivorcedFemales 37.8% Never married38.7% Now married0.6% Separated9.3% Widowed13.6% DivorcedWomen who gave birth in the past 12 months Now married:
100.0% (43)Unmarried:
0.0% (0)
Women who did not give birth in the past 12 months Now married:
31.8% (639)Unmarried:
68.2% (1,372)
Marital status - Black or African American population 15 years and over
Males 45.8% Never married40.3% Now married0.6% Separated0.0% Widowed13.3% DivorcedFemales 37.9% Never married26.4% Now married3.4% Separated11.0% Widowed21.3% DivorcedWomen who gave birth in the past 12 months Now married:
60.9% (51)Unmarried:
39.1% (33)
Women who did not give birth in the past 12 months Now married:
34.1% (313)Unmarried:
65.9% (603)
Marital status - American Indian / Alaska Native population 15 years and over
Males 56.4% Never married43.6% Now married0.0% Separated0.0% Widowed0.0% DivorcedFemales 0.0% Never married100.0% Now married0.0% Separated0.0% Widowed0.0% DivorcedWomen who did not give birth in the past 12 months Now married:
100.0% (37)Unmarried:
0.0% (0)
Marital status - Asian population 15 years and over
Males 55.1% Never married36.4% Now married0.0% Separated0.0% Widowed8.6% DivorcedFemales 24.1% Never married57.7% Now married11.2% Separated0.0% Widowed7.1% DivorcedWomen who gave birth in the past 12 months Now married:
100.0% (41)Unmarried:
0.0% (0)
Women who did not give birth in the past 12 months Now married:
74.2% (93)Unmarried:
25.8% (32)
Marital status - Other race population 15 years and over
Males 40.2% Never married51.9% Now married1.2% Separated2.2% Widowed4.6% DivorcedFemales 33.0% Never married46.9% Now married1.9% Separated3.7% Widowed14.6% DivorcedWomen who gave birth in the past 12 months Now married:
100.0% (25)Unmarried:
0.0% (0)
Women who did not give birth in the past 12 months Now married:
51.9% (824)Unmarried:
48.1% (763)
Marital status - Two or more races population 15 years and over
Males 55.1% Never married41.1% Now married1.0% Separated0.1% Widowed2.7% DivorcedFemales 33.9% Never married50.7% Now married0.0% Separated9.1% Widowed6.2% DivorcedWomen who gave birth in the past 12 months Now married:
100.0% (20)Unmarried:
0.0% (0)
Women who did not give birth in the past 12 months Now married:
35.0% (308)Unmarried:
65.0% (572)
Marital status - White alone, not Hispanic / Latino population 15 years and over
Males 27.5% Never married51.0% Now married3.4% Separated4.4% Widowed13.7% DivorcedFemales 35.3% Never married39.8% Now married0.7% Separated9.6% Widowed14.5% DivorcedWomen who gave birth in the past 12 months Now married:
100.0% (32)Unmarried:
0.0% (0)
Women who did not give birth in the past 12 months Now married:
32.2% (518)Unmarried:
67.8% (1,089)
Marital status - Hispanic or Latino population 15 years and over
Males 45.8% Never married48.0% Now married2.3% Separated1.1% Widowed2.8% DivorcedFemales 36.6% Never married44.7% Now married0.9% Separated7.6% Widowed10.3% DivorcedWomen who gave birth in the past 12 months Now married:
100.0% (37)Unmarried:
0.0% (0)
Women who did not give birth in the past 12 months Now married:
43.7% (1,179)Unmarried:
56.3% (1,517)
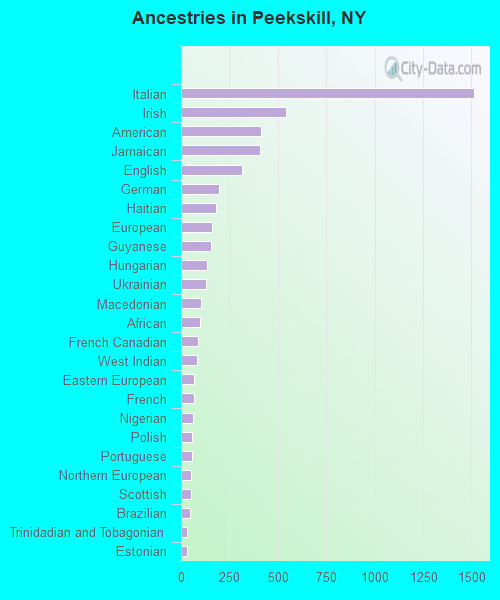
Ancestries in Peekskill
1,515 12.2% Italian540 4.3% Irish414 3.3% American407 3.3% Jamaican317 2.6% English194 1.6% German182 1.5% Haitian159 1.3% European153 1.2% Guyanese135 1.1% Hungarian128 1.0% Ukrainian105 0.8% Macedonian97 0.8% African90 0.7% French Canadian82 0.7% West Indian65 0.5% Eastern European65 0.5% French62 0.5% Nigerian56 0.5% Polish56 0.5% Portuguese50 0.4% Northern European50 0.4% Scottish46 0.4% Brazilian32 0.3% Trinidadian and Tobagonian30 0.2% Estonian24 0.2% Dutch20 0.2% Swiss19 0.2% Swedish16 0.1% Belgian16 0.1% Bulgarian12 0.10% Israeli11 0.09% Slovak9 0.07% Greek8 0.06% Welsh7 0.06% Barbadian1 0.01% Norwegian
Geographical mobility in Peekskill Same house 1 year ago 8,997 90.2% White (Caucasian)4,150 87.3% Black or African American279 100.0% American Indian / Alaska Native369 78.0% Asian4,771 80.3% Other race3,933 87.5% Two or more races7,903 90.0% White alone, not Hispanic / Latino8,852 83.7% Hispanic or LatinoMoved within same county 507 5.1% White / Caucasian493 10.4% Black or African American614 10.3% Other race230 5.1% Two or more races391 4.5% White alone, not Hispanic / Latino1,302 12.3% Hispanic or LatinoMoved within same state 404 4.0% White / Caucasian52 1.1% Black or African American85 17.9% Asian94 1.6% Other race140 3.1% Two or more races411 4.7% White alone, not Hispanic / Latino227 2.1% Hispanic or LatinoMoved from different state 43 0.4% White / Caucasian107 2.3% Black or African American26 0.4% Other race47 0.5% White alone, not Hispanic / Latino34 0.3% Hispanic or LatinoMoved from abroad 42 0.7% Other race15 0.3% Two or more races50 0.5% Hispanic or Latino
Children Nativity (place of birth) in Peekskill
Children under 6 years - Living with two parents Both parents native 245 99.8% Native0 0.2% Foreign-bornBoth parents foreign-born 514 96.1% Native21 3.9% Foreign-bornOne native, one foreign-born parent 207 100.0% NativeChildren under 6 years - Living with one parent Native parent 183 100.0% NativeForeign-born parent 50 68.2% Native23 31.8% Foreign-bornChildren 6 to 17 years - Living with two parents Both parents native 687 100.0% NativeBoth parents foreign-born 526 79.8% Native134 20.2% Foreign-bornOne native, one foreign-born parent 301 100.0% NativeChildren 6 to 17 years - Living with one parent Native parent 415 99.0% Native4 1.0% Foreign-bornForeign-born parent 454 65.9% Native235 34.1% Foreign-born
Grandparents responsible for own grandchildren in Peekskill
Grandparents (30 to 59 years) White / Caucasian 33 100.0% Not responsible for grandchildrenBlack or African American 19 100.0% Responsible for grandchildrenOther race 23 100.0% Not responsible for grandchildrenHispanic or Latino 68 100.0% Not responsible for grandchildren
Grandparents (60 years and over) Black or African American 169 100.0% Not responsible for grandchildrenOther race 55 100.0% Not responsible for grandchildrenHispanic or Latino 42 100.0% Not responsible for grandchildren