Races in Pembroke Pines, Florida (FL) Detailed Stats
Data:
Races - White alone (%)
Races - White alone (% change since 2000)
Races - Black alone (%)
Races - Black alone (% change since 2000)
Races - American Indian alone (%)
Races - American Indian alone (% change since 2000)
Races - Asian alone (%)
Races - Asian alone (% change since 2000)
Races - Hispanic (%)
Races - Hispanic (% change since 2000)
Races - Native Hawaiian and Other Pacific Islander alone (%)
Races - Native Hawaiian and Other Pacific Islander alone (% change since 2000)
Races - Two or more races(%)
Races - Two or more races(% change since 2000)
Races - Other race alone (%)
Races - Other race alone (% change since 2000)
Racial diversity
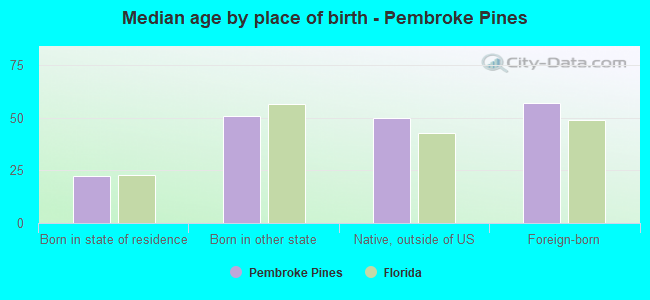
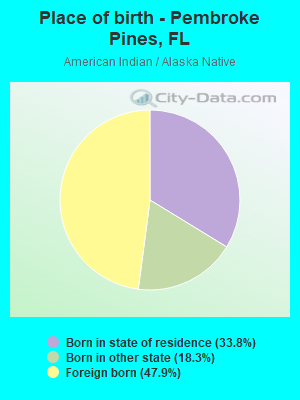
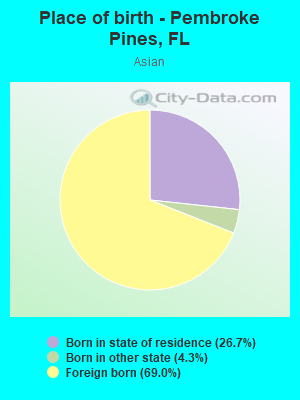
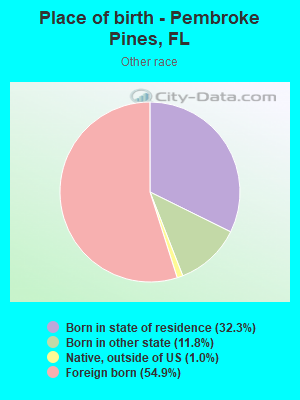
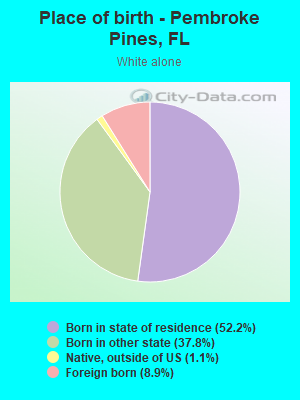
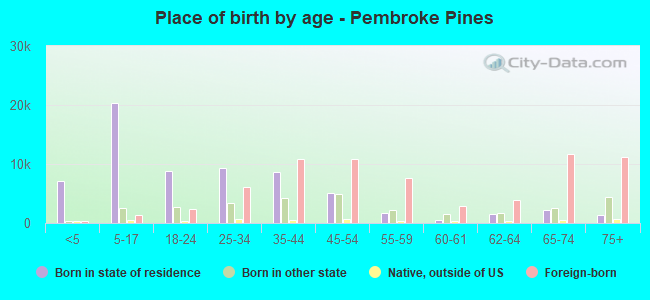
Place of birth - Born in state of residence (%)
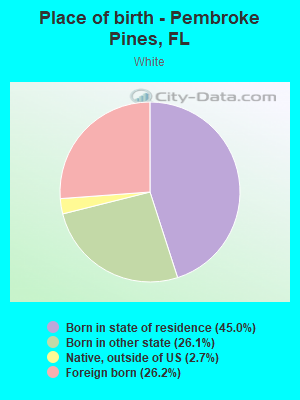
Place of birth - Born in state of residence (%) - White
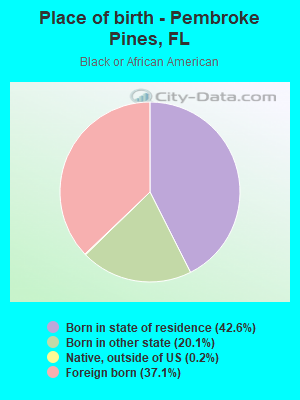
Place of birth - Born in state of residence (%) - Black or African American
Place of birth - Born in state of residence (%) - Asian
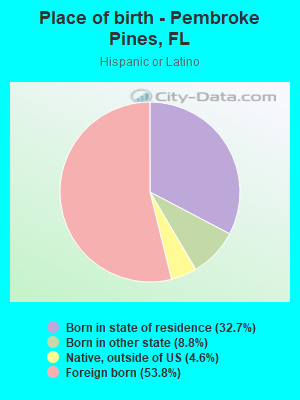
Place of birth - Born in state of residence (%) - Hispanic or Latino
Place of birth - Born in state of residence (%) - American Indian and Alaska Native
Place of birth - Born in state of residence (%) - Multirace
Place of birth - Born in state of residence (%) - Other Race
Place of birth - Born in other state (%)
Place of birth - Born in other state (%) - White
Place of birth - Born in other state (%) - Black or African American
Place of birth - Born in other state (%) - Asian
Place of birth - Born in other state (%) - Hispanic or Latino
Place of birth - Born in other state (%) - American Indian and Alaska Native
Place of birth - Born in other state (%) - Multirace
Place of birth - Born in other state (%) - Other Race
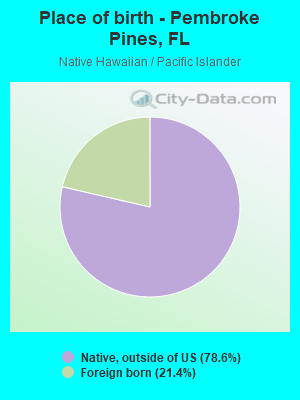
Place of birth - Native, outside of US (%)
Place of birth - Native, outside of US (%) - White
Place of birth - Native, outside of US (%) - Black or African American
Place of birth - Native, outside of US (%) - Asian
Place of birth - Native, outside of US (%) - Hispanic or Latino
Place of birth - Native, outside of US (%) - American Indian and Alaska Native
Place of birth - Native, outside of US (%) - Multirace
Place of birth - Native, outside of US (%) - Other Race
Place of birth - Foreign born (%)
Place of birth - Foreign born (%) - White
Place of birth - Foreign born (%) - Black or African American
Place of birth - Foreign born (%) - Asian
Place of birth - Foreign born (%) - Hispanic or Latino
Place of birth - Foreign born (%) - American Indian and Alaska Native
Place of birth - Foreign born (%) - Multirace
Place of birth - Foreign born (%) - Other Race
Residents speaking English at home (%)
Residents speaking English at home - Born in the United States (%)
Residents speaking English at home - Native, born elsewhere (%)
Residents speaking English at home - Foreign born (%)
Residents speaking Spanish at home (%)
Residents speaking Spanish at home - Born in the United States (%)
Residents speaking Spanish at home - Native, born elsewhere (%)
Residents speaking Spanish at home - Foreign born (%)
Residents speaking other language at home (%)
Residents speaking other language at home - Born in the United States (%)
Residents speaking other language at home - Native, born elsewhere (%)
Residents speaking other language at home - Foreign born (%)
Marital status - Never married (%)
Marital status - Now married (%)
Marital status - Separated (%)
Marital status - Widowed (%)
Marital status - Divorced (%)
Ancestries Reported - Arab (%)
Ancestries Reported - Czech (%)
Ancestries Reported - Danish (%)
Ancestries Reported - Dutch (%)
Ancestries Reported - English (%)
Ancestries Reported - French (%)
Ancestries Reported - French Canadian (%)
Ancestries Reported - German (%)
Ancestries Reported - Greek (%)
Ancestries Reported - Hungarian (%)
Ancestries Reported - Irish (%)
Ancestries Reported - Italian (%)
Ancestries Reported - Lithuanian (%)
Ancestries Reported - Norwegian (%)
Ancestries Reported - Polish (%)
Ancestries Reported - Portuguese (%)
Ancestries Reported - Russian (%)
Ancestries Reported - Scotch-Irish (%)
Ancestries Reported - Scottish (%)
Ancestries Reported - Slovak (%)
Ancestries Reported - Subsaharan African (%)
Ancestries Reported - Swedish (%)
Ancestries Reported - Swiss (%)
Ancestries Reported - Ukrainian (%)
Ancestries Reported - United States (%)
Ancestries Reported - Welsh (%)
Ancestries Reported - West Indian (%)
Ancestries Reported - Other (%)
Geographical mobility - Same house 1 year ago (%)
Geographical mobility - Same house 1 year ago (%) - White
Geographical mobility - Same house 1 year ago (%) - Black or African American
Geographical mobility - Same house 1 year ago (%) - Asian
Geographical mobility - Same house 1 year ago (%) - Hispanic or Latino
Geographical mobility - Same house 1 year ago (%) - American Indian and Alaska Native
Geographical mobility - Same house 1 year ago (%) - Multirace
Geographical mobility - Same house 1 year ago (%) - Other Race
Geographical mobility - Moved within same county (%)
Geographical mobility - Moved within same county (%) - White
Geographical mobility - Moved within same county (%) - Black or African American
Geographical mobility - Moved within same county (%) - Asian
Geographical mobility - Moved within same county (%) - Hispanic or Latino
Geographical mobility - Moved within same county (%) - American Indian and Alaska Native
Geographical mobility - Moved within same county (%) - Multirace
Geographical mobility - Moved within same county (%) - Other Race
Geographical mobility - Moved from different county within same state (%)
Geographical mobility - Moved from different county within same state (%) - White
Geographical mobility - Moved from different county within same state (%) - Black or African American
Geographical mobility - Moved from different county within same state (%) - Asian
Geographical mobility - Moved from different county within same state (%) - Hispanic or Latino
Geographical mobility - Moved from different county within same state (%) - American Indian and Alaska Native
Geographical mobility - Moved from different county within same state (%) - Multirace
Geographical mobility - Moved from different county within same state (%) - Other Race
Geographical mobility - Moved from different state (%)
Geographical mobility - Moved from different state (%) - White
Geographical mobility - Moved from different state (%) - Black or African American
Geographical mobility - Moved from different state (%) - Asian
Geographical mobility - Moved from different state (%) - Hispanic or Latino
Geographical mobility - Moved from different state (%) - American Indian and Alaska Native
Geographical mobility - Moved from different state (%) - Multirace
Geographical mobility - Moved from different state (%) - Other Race
Geographical mobility - Moved from abroad (%)
Geographical mobility - Moved from abroad (%) - White
Geographical mobility - Moved from abroad (%) - Black or African American
Geographical mobility - Moved from abroad (%) - Asian
Geographical mobility - Moved from abroad (%) - Hispanic or Latino
Geographical mobility - Moved from abroad (%) - American Indian and Alaska Native
Geographical mobility - Moved from abroad (%) - Multirace
Geographical mobility - Moved from abroad (%) - Other Race
Place of birth for the foreign-born population - Ireland (%)
Place of birth for the foreign-born population - Denmark (%)
Place of birth for the foreign-born population - Norway (%)
Place of birth for the foreign-born population - Sweden (%)
Place of birth for the foreign-born population - United Kingdom (%)
Place of birth for the foreign-born population - England (%)
Place of birth for the foreign-born population - Scotland (%)
Place of birth for the foreign-born population - Other Northern Europe (%)
Place of birth for the foreign-born population - Austria (%)
Place of birth for the foreign-born population - Belgium (%)
Place of birth for the foreign-born population - France (%)
Place of birth for the foreign-born population - Germany (%)
Place of birth for the foreign-born population - Netherlands (%)
Place of birth for the foreign-born population - Switzerland (%)
Place of birth for the foreign-born population - Other Western Europe (%)
Place of birth for the foreign-born population - Greece (%)
Place of birth for the foreign-born population - Italy (%)
Place of birth for the foreign-born population - Portugal (%)
Place of birth for the foreign-born population - Spain (%)
Place of birth for the foreign-born population - Other Southern Europe (%)
Place of birth for the foreign-born population - Albania (%)
Place of birth for the foreign-born population - Belarus (%)
Place of birth for the foreign-born population - Bosnia and Herzegovina (%)
Place of birth for the foreign-born population - Bulgaria (%)
Place of birth for the foreign-born population - Croatia (%)
Place of birth for the foreign-born population - Czechoslovakia (%)
Place of birth for the foreign-born population - Hungary (%)
Place of birth for the foreign-born population - Latvia (%)
Place of birth for the foreign-born population - Lithuania (%)
Place of birth for the foreign-born population - North Macedonia (Macedonia) (%)
Place of birth for the foreign-born population - Moldova (%)
Place of birth for the foreign-born population - Poland (%)
Place of birth for the foreign-born population - Romania (%)
Place of birth for the foreign-born population - Russia (%)
Place of birth for the foreign-born population - Serbia (%)
Place of birth for the foreign-born population - Ukraine (%)
Place of birth for the foreign-born population - Other Eastern Europe (%)
Place of birth for the foreign-born population - China (%)
Place of birth for the foreign-born population - Hong Kong (%)
Place of birth for the foreign-born population - Taiwan (%)
Place of birth for the foreign-born population - Japan (%)
Place of birth for the foreign-born population - Korea (%)
Place of birth for the foreign-born population - Other Eastern Asia (%)
Place of birth for the foreign-born population - Afghanistan (%)
Place of birth for the foreign-born population - Bangladesh (%)
Place of birth for the foreign-born population - India (%)
Place of birth for the foreign-born population - Iran (%)
Place of birth for the foreign-born population - Kazakhstan (%)
Place of birth for the foreign-born population - Nepal (%)
Place of birth for the foreign-born population - Pakistan (%)
Place of birth for the foreign-born population - Sri Lanka (%)
Place of birth for the foreign-born population - Uzbekistan (%)
Place of birth for the foreign-born population - Other South Central Asia (%)
Place of birth for the foreign-born population - Burma (%)
Place of birth for the foreign-born population - Cambodia (%)
Place of birth for the foreign-born population - Indonesia (%)
Place of birth for the foreign-born population - Laos (%)
Place of birth for the foreign-born population - Malaysia (%)
Place of birth for the foreign-born population - Philippines (%)
Place of birth for the foreign-born population - Singapore (%)
Place of birth for the foreign-born population - Thailand (%)
Place of birth for the foreign-born population - Vietnam (%)
Place of birth for the foreign-born population - Other South Eastern Asia (%)
Place of birth for the foreign-born population - Armenia (%)
Place of birth for the foreign-born population - Iraq (%)
Place of birth for the foreign-born population - Israel (%)
Place of birth for the foreign-born population - Jordan (%)
Place of birth for the foreign-born population - Kuwait (%)
Place of birth for the foreign-born population - Lebanon (%)
Place of birth for the foreign-born population - Saudi Arabia (%)
Place of birth for the foreign-born population - Syria (%)
Place of birth for the foreign-born population - Turkey (%)
Place of birth for the foreign-born population - Yemen (%)
Place of birth for the foreign-born population - Other Western Asia (%)
Place of birth for the foreign-born population - Eritrea (%)
Place of birth for the foreign-born population - Ethiopia (%)
Place of birth for the foreign-born population - Kenya (%)
Place of birth for the foreign-born population - Somalia (%)
Place of birth for the foreign-born population - Uganda (%)
Place of birth for the foreign-born population - Zimbabwe (%)
Place of birth for the foreign-born population - Other Eastern Africa (%)
Place of birth for the foreign-born population - Cameroon (%)
Place of birth for the foreign-born population - Congo (%)
Place of birth for the foreign-born population - Democratic Republic of Congo (Zaire) (%)
Place of birth for the foreign-born population - Other Middle Africa (%)
Place of birth for the foreign-born population - Egypt (%)
Place of birth for the foreign-born population - Morocco (%)
Place of birth for the foreign-born population - Sudan (%)
Place of birth for the foreign-born population - Other Northern Africa (%)
Place of birth for the foreign-born population - South Africa (%)
Place of birth for the foreign-born population - Other Southern Africa (%)
Place of birth for the foreign-born population - Cabo Verde (%)
Place of birth for the foreign-born population - Ghana (%)
Place of birth for the foreign-born population - Liberia (%)
Place of birth for the foreign-born population - Nigeria (%)
Place of birth for the foreign-born population - Senegal (%)
Place of birth for the foreign-born population - Sierra Leone (%)
Place of birth for the foreign-born population - Other Western Africa (%)
Place of birth for the foreign-born population - Australia (%)
Place of birth for the foreign-born population - New Zealand (%)
Place of birth for the foreign-born population - Fiji (%)
Place of birth for the foreign-born population - Micronesia (%)
Place of birth for the foreign-born population - Bahamas (%)
Place of birth for the foreign-born population - Barbados (%)
Place of birth for the foreign-born population - Cuba (%)
Place of birth for the foreign-born population - Dominica (%)
Place of birth for the foreign-born population - Dominican Republic (%)
Place of birth for the foreign-born population - Grenada (%)
Place of birth for the foreign-born population - Haiti (%)
Place of birth for the foreign-born population - Jamaica (%)
Place of birth for the foreign-born population - St. Vincent and the Grenadines (%)
Place of birth for the foreign-born population - Trinidad and Tobago (%)
Place of birth for the foreign-born population - West Indies (%)
Place of birth for the foreign-born population - Other Caribbean (%)
Place of birth for the foreign-born population - Belize (%)
Place of birth for the foreign-born population - Costa Rica (%)
Place of birth for the foreign-born population - El Salvador (%)
Place of birth for the foreign-born population - Guatemala (%)
Place of birth for the foreign-born population - Honduras (%)
Place of birth for the foreign-born population - Mexico (%)
Place of birth for the foreign-born population - Nicaragua (%)
Place of birth for the foreign-born population - Panama (%)
Place of birth for the foreign-born population - Other Central America (%)
Place of birth for the foreign-born population - Argentina (%)
Place of birth for the foreign-born population - Bolivia (%)
Place of birth for the foreign-born population - Brazil (%)
Place of birth for the foreign-born population - Chile (%)
Place of birth for the foreign-born population - Colombia (%)
Place of birth for the foreign-born population - Ecuador (%)
Place of birth for the foreign-born population - Guyana (%)
Place of birth for the foreign-born population - Peru (%)
Place of birth for the foreign-born population - Uruguay (%)
Place of birth for the foreign-born population - Venezuela (%)
Place of birth for the foreign-born population - Other South America (%)
Place of birth for the foreign-born population - Canada (%)
Place of birth for the foreign-born population - Other Northern America (%)
Place of birth for the foreign-born population - Other (%)
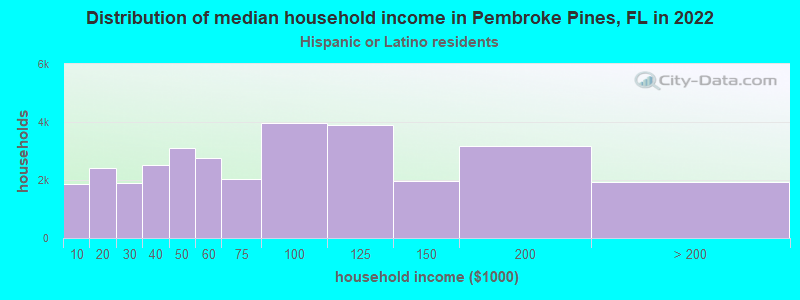
According to 2022 data, the most numerous races in Pembroke Pines, FL are White alone (40,762 residents), Hispanic (84,446 residents), and Black alone (28,892 residents). 44.1% of Pembroke Pines residents speak English at home. 40.4% of Pembroke Pines, FL residents are foreign-born (32.7% born in Latin America), which is 48.0% greater than the foreign-born rate of 21.0% across the entire state of Florida.
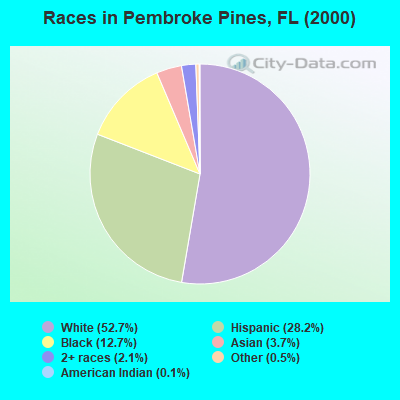
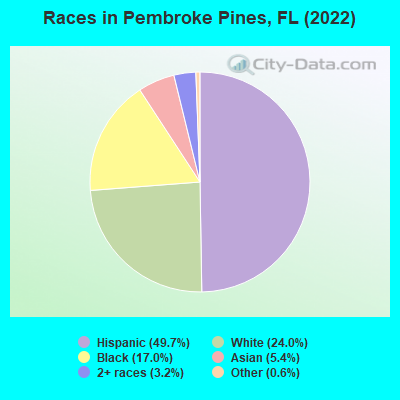
Race distribution in Pembroke Pines
2000 2022
72,464 52.7% White alone 38,700 28.2% Hispanic 17,471 12.7% Black alone 5,061 3.7% Asian alone 2,878 2.1% Two or more races 634 0.5% Other race alone 172 0.1% American Indian alone 47 0.03% Native Hawaiian and Other
84,446 49.7% Hispanic 40,762 24.0% White alone 28,892 17.0% Black alone 9,252 5.4% Asian alone 5,518 3.2% Two or more races 944 0.6% Other race alone 61 0.04% American Indian alone
2000 2022
10,458,509 65.4% White alone 2,682,715 16.8% Hispanic 2,264,268 14.2% Black alone 261,693 1.6% Asian alone 236,954 1.5% Two or more races 42,358 0.3% American Indian alone 28,994 0.2% Other race alone 6,887 0.04% Native Hawaiian and Other
11,309,403 50.8% White alone 6,025,039 27.1% Hispanic 3,241,015 14.6% Black alone 861,630 3.9% Two or more races 623,692 2.8% Asian alone 152,054 0.7% Other race alone 22,504 0.1% American Indian alone 9,486 0.04% Native Hawaiian and Other
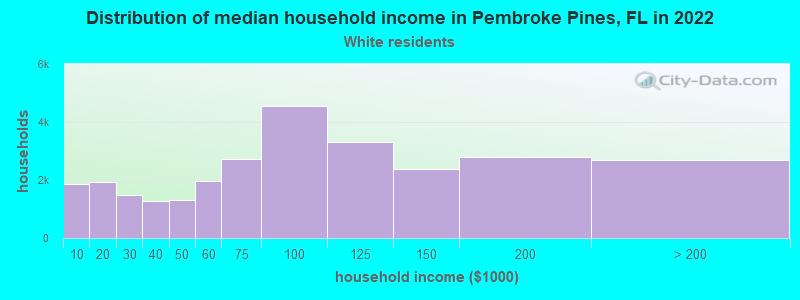
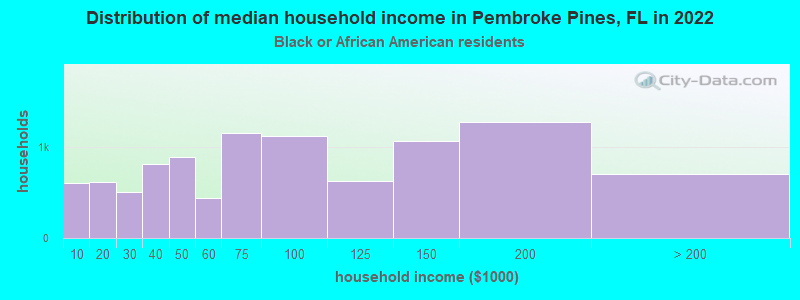
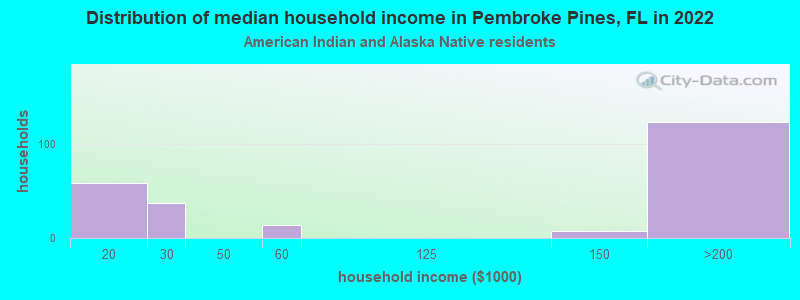
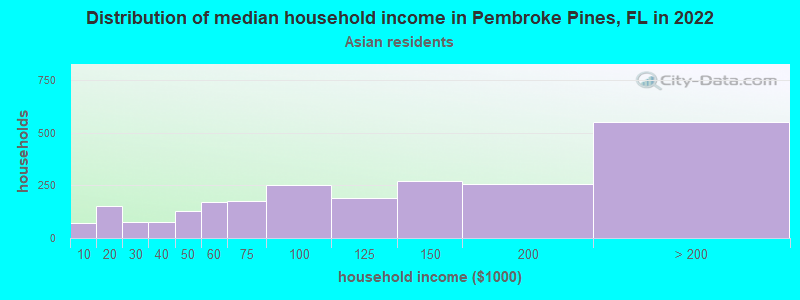
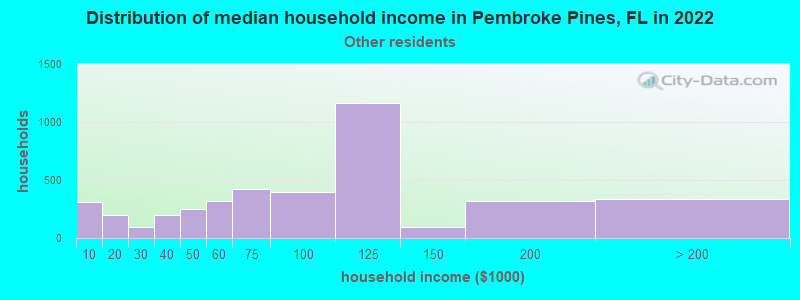
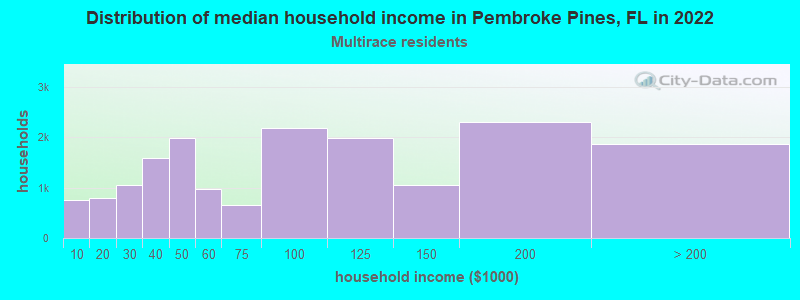
Income and house value in Pembroke Pines Median household income in 2022 $93,282 White non-Hispanic householders$72,231 Black householders$77,061 Asian householders$53,497 Some other race householders$80,061 Two or more races householders$66,802 Hispanic or Latino race householdersMedian 2022 house value $487,133 White Non-Hispanic householders$526,356 Black or African American householders$410,438 American Indian or Alaska Native householders $544,566 Asian householders$447,210 Some other race householders$493,437 Two or more races householders$510,246 Hispanic or Latino householders
Median age by race in Pembroke Pines
44.2 Median age for White residents39.6 48.7 41.1 Median age for Black or African American residents36.7 44.8 46.5 Median age for American Indian / Alaska Native residents-666,666,666.0 -666,666,666.0 42.6 Median age for Asian residents46.3 36.9 -666,666,666.0 Median age for Native Hawaiian / Pacific Islander residents-666,666,666.0 -666,666,666.0 36.0 Median age for Other race residents35.7 37.1 47.8 Median age for Two or more races residents44.3 50.3 48.5 Median age for White alone residents39.7 52.4 43.6 Median age for Hispanic or Latino residents40.9 44.9
Owner/renter occupied households by race in Pembroke Pines
House owners and renters - White residents 20,984 74.4% Owner occupied7,239 25.6% Renter occupiedHouse owners and renters - Black or African American residents 6,822 69.3% Owner occupied3,029 30.7% Renter occupiedHouse owners and renters - American Indian / Alaska Native residents 169 83.3% Owner occupied34 16.7% Renter occupiedHouse owners and renters - Asian residents 1,968 72.5% Owner occupied746 27.5% Renter occupiedHouse owners and renters - Native Hawaiian / Pacific Islander residents 54 100.0% Owner occupiedHouse owners and renters - Other race residents 2,571 56.0% Owner occupied2,022 44.0% Renter occupiedHouse owners and renters - Two or more races residents 13,796 80.0% Owner occupied3,447 20.0% Renter occupiedHouse owners and renters - White alone residents 14,158 83.3% Owner occupied2,836 16.7% Renter occupiedHouse owners and renters - Hispanic or Latino residents 21,709 68.9% Owner occupied9,794 31.1% Renter occupied
Language usage in Pembroke Pines
English speakers - Total 44.1% of residents of Pembroke Pines speak English at home.
43.7% of residents speak Spanish at home 43,306 60.9% Speak English very well27,779 39.1% Speak English less than very well12.2% of residents speak other language at home 14,864 75.1% Speak English very well4,941 24.9% Speak English less than very well
English speakers - Born in the United States 71.7% of residents of Pembroke Pines speak English at home.
20.4% of residents speak Spanish at home 5,797 93.9% Speak English very well375 6.1% Speak English less than very well7.9% of residents speak other language at home 2,344 97.8% Speak English very well52 2.2% Speak English less than very well
English speakers - Native, born elsewhere 17.8% of residents of Pembroke Pines speak English at home.
82.2% of residents speak Spanish at home 3,141 87.7% Speak English very well442 12.3% Speak English less than very well
English speakers - Foreign-born 14.4% of residents of Pembroke Pines speak English at home.
64.5% of residents speak Spanish at home 20,017 45.1% Speak English very well24,338 54.9% Speak English less than very well21.1% of residents speak other language at home 9,845 67.9% Speak English very well4,655 32.1% Speak English less than very well
White (Caucasian) - Speak only English Native:
72.1% (35,069)Foreign-born:
6.3% (1,149)
White (Caucasian) - Speak another language Native:
27.9% (13,564)Foreign-born:
93.7% (17,170)
Black or African American - Speak only English Native:
83.1% (14,368)Foreign-born:
47.6% (5,201)
Black or African American - Speak another language Native:
16.9% (2,927)Foreign-born:
52.4% (5,717)
American Indian / Alaska Native - Speak only English Native:
68.0% (210)Foreign-born:
44.2% (130)
American Indian / Alaska Native - Speak another language Native:
32.8% (101)Foreign-born:
59.1% (173)
Asian - Speak only English Native:
63.9% (1,564)Foreign-born:
16.7% (1,094)
Asian - Speak another language Native:
36.1% (884)Foreign-born:
83.3% (5,456)
Other race - Speak only English Native:
22.1% (1,346)Foreign-born:
4.1% (321)
Other race - Speak another language Native:
77.9% (4,754)Foreign-born:
95.9% (7,525)
Two or more races - Speak only English Native:
48.8% (9,397)Foreign-born:
8.2% (2,049)
Two or more races - Speak another language Native:
51.2% (9,850)Foreign-born:
91.8% (22,922)
White alone - Speak only English Native:
88.7% (31,666)Foreign-born:
28.2% (1,025)
White alone - Speak another language Native:
11.3% (4,036)Foreign-born:
71.8% (2,605)
Hispanic or Latino - Speak only English Native:
31.6% (10,985)Foreign-born:
3.0% (1,381)
Hispanic or Latino - Speak another language Native:
68.4% (23,806)Foreign-born:
97.0% (44,092)
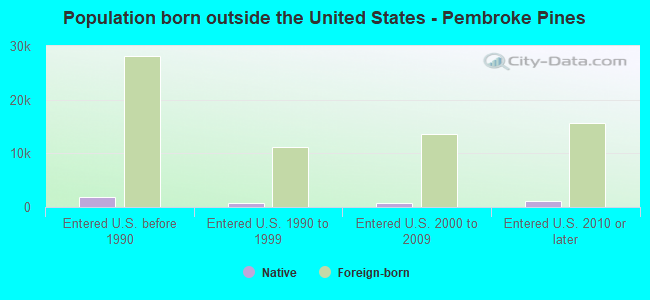
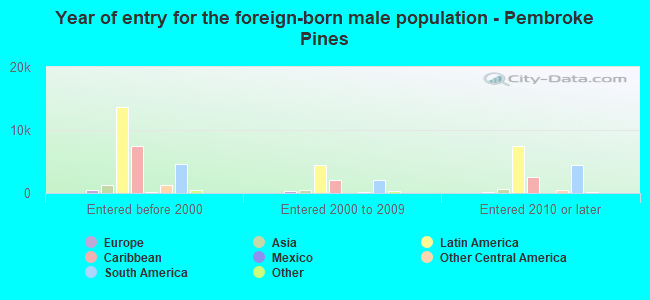
Foreign-born residents in Pembroke Pines 69,019 residents are foreign born (32.7% Latin America ).
This city:
40.4%Florida:
21.1%
Marital status for residents in Pembroke Pines Marital status - White (Caucasian) population 15 years and over
Males 42.1% Never married47.7% Now married0.8% Separated1.9% Widowed7.6% DivorcedFemales 29.2% Never married44.8% Now married2.3% Separated12.1% Widowed11.6% DivorcedWomen who gave birth in the past 12 months Now married:
39.8% (187)Unmarried:
60.2% (283)
Women who did not give birth in the past 12 months Now married:
41.2% (5,878)Unmarried:
58.8% (8,373)
Marital status - Black or African American population 15 years and over
Males 42.2% Never married43.5% Now married4.0% Separated0.9% Widowed9.4% DivorcedFemales 43.0% Never married25.7% Now married8.4% Separated10.0% Widowed12.9% DivorcedWomen who gave birth in the past 12 months Now married:
29.5% (70)Unmarried:
70.5% (167)
Women who did not give birth in the past 12 months Now married:
31.1% (2,445)Unmarried:
68.9% (5,421)
Marital status - American Indian / Alaska Native population 15 years and over
Males 39.6% Never married34.0% Now married0.0% Separated0.0% Widowed26.4% DivorcedFemales 39.6% Never married60.4% Now married0.0% Separated0.0% Widowed0.0% DivorcedWomen who did not give birth in the past 12 months Now married:
18.1% (31)Unmarried:
81.9% (141)
Marital status - Asian population 15 years and over
Males 28.8% Never married66.2% Now married0.0% Separated2.8% Widowed2.2% DivorcedFemales 22.3% Never married62.4% Now married0.3% Separated8.4% Widowed6.6% DivorcedWomen who gave birth in the past 12 months Now married:
100.0% (83)Unmarried:
0.0% (0)
Women who did not give birth in the past 12 months Now married:
57.2% (1,132)Unmarried:
42.8% (847)
Marital status - Native Hawaiian / Pacific Islander population 15 years and over
Males 0.0% Never married100.0% Now married0.0% Separated0.0% Widowed0.0% DivorcedFemales 0.0% Never married67.7% Now married0.0% Separated32.3% Widowed0.0% DivorcedWomen who did not give birth in the past 12 months Now married:
100.0% (68)Unmarried:
0.0% (0)
Marital status - Other race population 15 years and over
Males 52.4% Never married43.9% Now married0.0% Separated0.0% Widowed3.8% DivorcedFemales 39.8% Never married34.4% Now married0.0% Separated4.1% Widowed21.7% DivorcedWomen who gave birth in the past 12 months Now married:
62.9% (91)Unmarried:
37.1% (54)
Women who did not give birth in the past 12 months Now married:
41.8% (1,559)Unmarried:
58.2% (2,174)
Marital status - Two or more races population 15 years and over
Males 24.9% Never married62.4% Now married0.6% Separated3.7% Widowed8.3% DivorcedFemales 23.6% Never married53.4% Now married3.4% Separated9.4% Widowed10.2% DivorcedWomen who gave birth in the past 12 months Now married:
100.0% (164)Unmarried:
0.0% (0)
Women who did not give birth in the past 12 months Now married:
56.7% (4,817)Unmarried:
43.3% (3,682)
Marital status - White alone, not Hispanic / Latino population 15 years and over
Males 43.3% Never married43.4% Now married0.9% Separated1.9% Widowed10.4% DivorcedFemales 21.9% Never married46.4% Now married0.6% Separated17.3% Widowed13.7% DivorcedWomen who gave birth in the past 12 months Now married:
100.0% (187)Unmarried:
0.0% (0)
Women who did not give birth in the past 12 months Now married:
46.9% (3,136)Unmarried:
53.1% (3,547)
Marital status - Hispanic or Latino population 15 years and over
Males 32.0% Never married58.4% Now married0.5% Separated2.7% Widowed6.4% DivorcedFemales 31.4% Never married47.2% Now married3.5% Separated6.8% Widowed11.2% DivorcedWomen who gave birth in the past 12 months Now married:
30.1% (177)Unmarried:
69.9% (412)
Women who did not give birth in the past 12 months Now married:
42.4% (8,136)Unmarried:
57.6% (11,046)
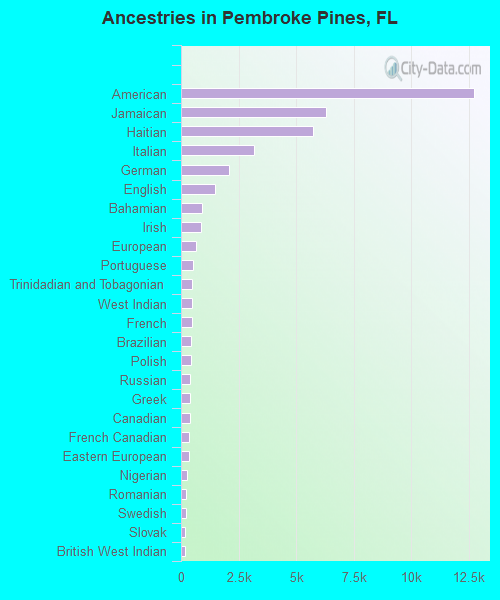
Ancestries in Pembroke Pines
12,752 11.3% American6,316 5.6% Jamaican5,746 5.1% Haitian3,158 2.8% Italian2,084 1.8% German1,486 1.3% English907 0.8% Bahamian883 0.8% Irish650 0.6% European517 0.5% Portuguese494 0.4% Trinidadian and Tobagonian475 0.4% West Indian463 0.4% French439 0.4% Brazilian421 0.4% Polish405 0.4% Russian399 0.4% Greek373 0.3% Canadian362 0.3% French Canadian356 0.3% Eastern European267 0.2% Nigerian202 0.2% Romanian197 0.2% Swedish193 0.2% Slovak159 0.1% British West Indian154 0.1% British151 0.1% Guyanese147 0.1% Hungarian140 0.1% Scottish139 0.1% Turkish118 0.1% Jordanian108 0.10% Dutch105 0.09% African102 0.09% Lebanese101 0.09% Norwegian90 0.08% Egyptian75 0.07% Arab73 0.06% Palestinian60 0.05% Barbadian56 0.05% Ukrainian54 0.05% Czech51 0.05% Cape Verdean47 0.04% Israeli46 0.04% Scotch-Irish44 0.04% Northern European40 0.04% Dutch West Indian38 0.03% Syrian26 0.02% U.S. Virgin Islander25 0.02% Moroccan25 0.02% Iranian24 0.02% Armenian21 0.02% Yugoslavian20 0.02% Belizean19 0.02% Scandinavian13 0.01% Ghanaian13 0.01% Danish11 0.01% Bulgarian9 0.01% Croatian9 0.01% Austrian8 0.01% Czechoslovakian6 0.01% Welsh
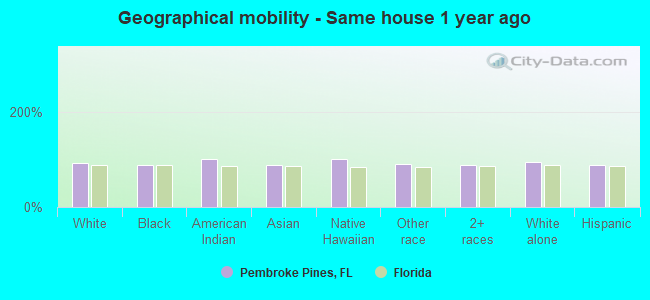
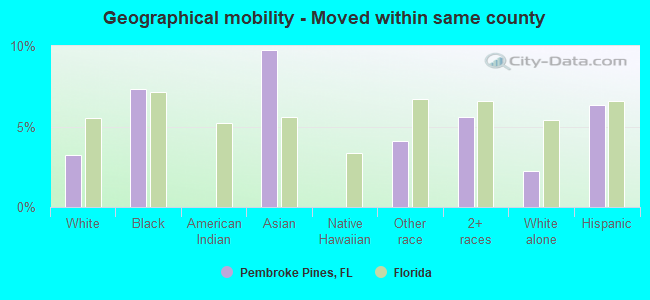
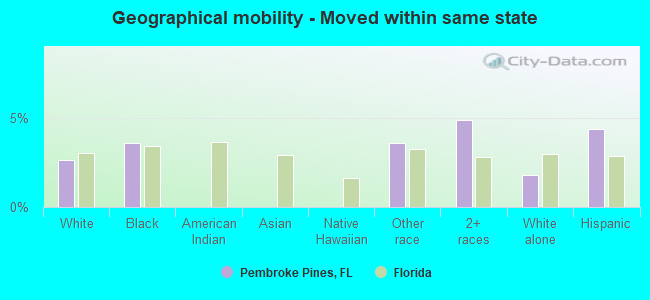
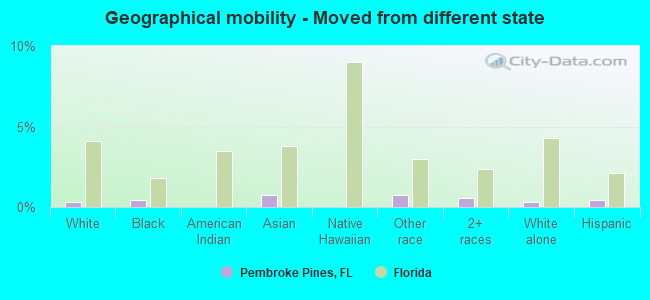
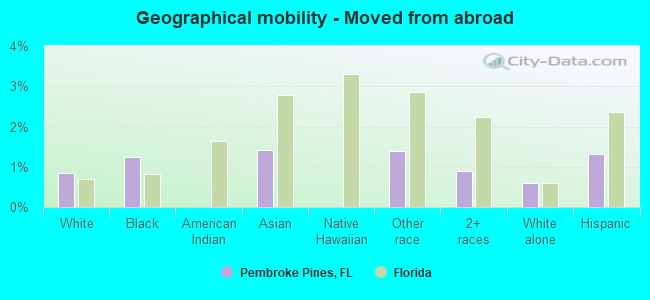
Geographical mobility in Pembroke Pines Same house 1 year ago 64,798 93.0% White (Caucasian)31,391 87.4% Black or African American814 100.0% American Indian / Alaska Native8,362 88.1% Asian174 100.0% Native Hawaiian / Pacific Islander11,385 90.9% Other race40,580 88.1% Two or more races38,772 95.1% White alone, not Hispanic / Latino73,214 87.6% Hispanic or LatinoMoved within same county 2,255 3.2% White / Caucasian2,629 7.3% Black or African American923 9.7% Asian514 4.1% Other race2,588 5.6% Two or more races907 2.2% White alone, not Hispanic / Latino5,281 6.3% Hispanic or LatinoMoved within same state 1,850 2.7% White / Caucasian1,289 3.6% Black or African American448 3.6% Other race2,249 4.9% Two or more races721 1.8% White alone, not Hispanic / Latino3,625 4.3% Hispanic or LatinoMoved from different state 224 0.3% White / Caucasian165 0.5% Black or African American73 0.8% Asian97 0.8% Other race246 0.5% Two or more races122 0.3% White alone, not Hispanic / Latino348 0.4% Hispanic or LatinoMoved from abroad 582 0.8% White444 1.2% Black or African American135 1.4% Asian174 1.4% Other race409 0.9% Two or more races240 0.6% White alone, not Hispanic / Latino1,106 1.3% Hispanic or Latino
Children Nativity (place of birth) in Pembroke Pines
Children under 6 years - Living with two parents Both parents native 2,783 100.0% NativeBoth parents foreign-born 2,054 100.0% NativeOne native, one foreign-born parent 1,351 100.0% NativeChildren under 6 years - Living with one parent Native parent 1,185 100.0% NativeForeign-born parent 821 100.0% NativeChildren 6 to 17 years - Living with two parents Both parents native 7,551 97.7% Native175 2.3% Foreign-bornBoth parents foreign-born 4,049 85.1% Native708 14.9% Foreign-bornOne native, one foreign-born parent 1,865 100.0% NativeChildren 6 to 17 years - Living with one parent Native parent 4,146 100.0% NativeForeign-born parent 3,922 52.4% Native3,569 47.6% Foreign-born
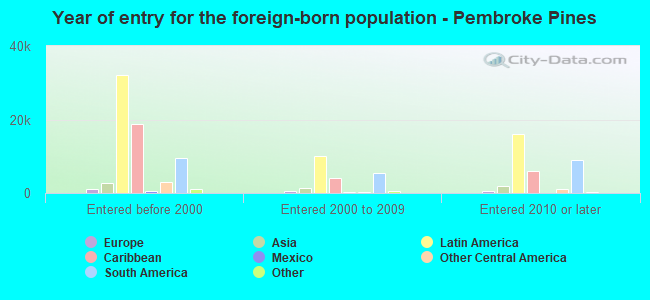
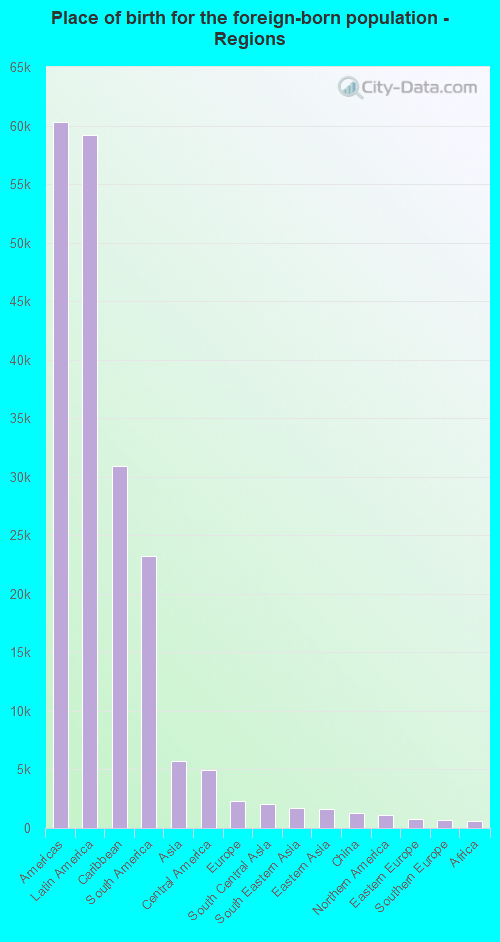
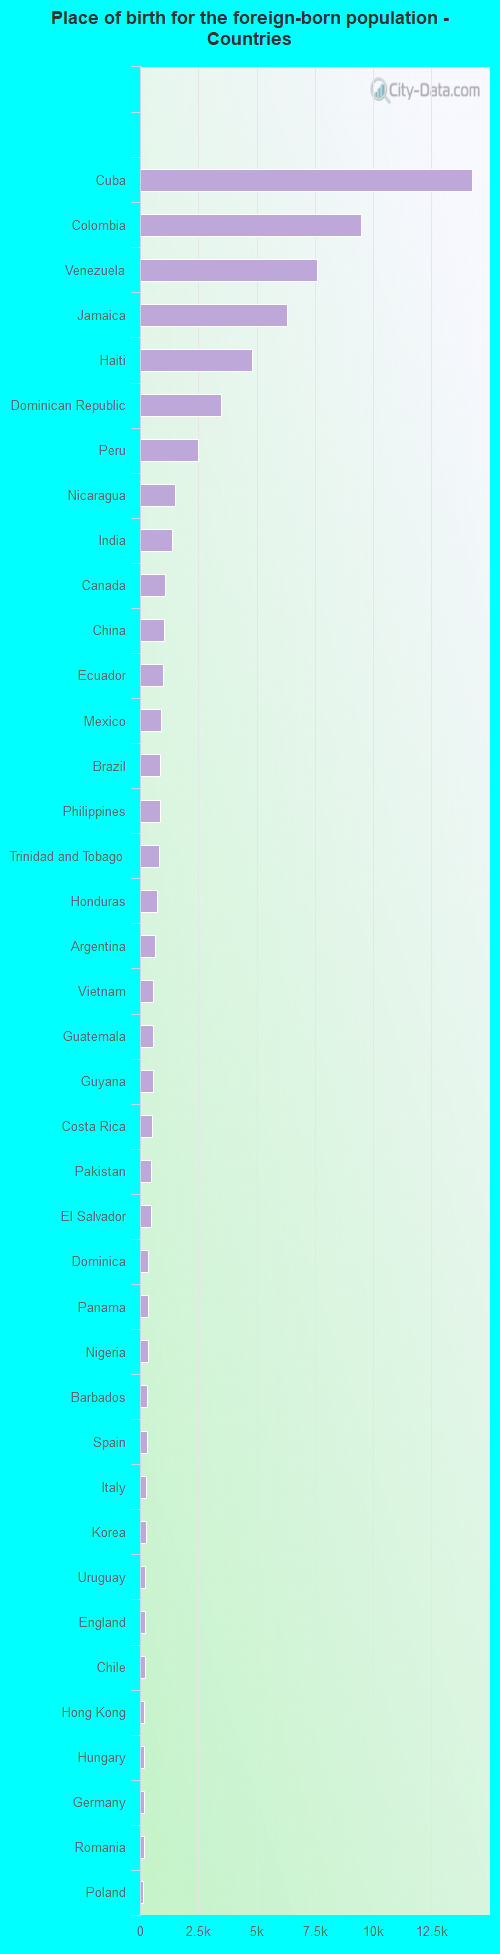
Place of birth for residents in Pembroke Pines 60,273 Americas59,200 Latin America30,949 Caribbean23,257 South America5,751 Asia4,993 Central America2,326 Europe2,079 South Central Asia1,674 South Eastern Asia1,620 Eastern Asia1,315 China1,072 Northern America772 Eastern Europe692 Southern Europe621 Africa483 Northern Europe366 Western Asia348 Western Africa339 Western Europe116 Northern Africa98 Southern Africa57 Eastern Africa45 Oceania14,257 Cuba9,492 Colombia7,584 Venezuela6,319 Jamaica4,809 Haiti3,474 Dominican Republic2,483 Peru1,483 Nicaragua1,377 India1,072 Canada1,046 China1,000 Ecuador917 Mexico865 Brazil862 Philippines818 Trinidad and Tobago732 Honduras626 Argentina570 Vietnam563 Guatemala559 Guyana494 Costa Rica478 Pakistan451 El Salvador347 Dominica333 Panama327 Nigeria314 Barbados289 Spain274 Italy246 Korea230 Uruguay229 England220 Chile176 Hong Kong155 Hungary155 Germany153 Romania149 Poland118 Sweden113 Jordan98 South Africa95 Bangladesh93 Laos92 Taiwan89 United Kingdom87 Greece83 Russia81 Egypt75 Singapore70 Bolivia63 Uzbekistan63 France62 Israel60 Moldova58 Japan57 Syria57 Belarus57 Netherlands48 Grenada47 Thailand46 Switzerland45 Turkey45 Zimbabwe45 Marshall Islands43 Lebanon41 Portugal38 West Indies35 Ireland35 Morocco34 Iran29 Czechoslovakia25 Bulgaria22 Bahamas21 Ghana20 Serbia19 St. Lucia17 Belize17 Lithuania15 Sri Lanka15 Austria14 Saudi Arabia13 Cambodia13 Nepal11 Ethiopia11 Norway10 Malaysia9 Ukraine8 United Arab Emirates8 Iraq7 Georgia4 Kuwait
Grandparents responsible for own grandchildren in Pembroke Pines
Grandparents (30 to 59 years) White / Caucasian 78 23.6% Responsible for grandchildren253 76.4% Not responsible for grandchildrenBlack or African American 61 11.5% Responsible for grandchildren470 88.5% Not responsible for grandchildrenNative Hawaiian / Pacific Islander 40 100.0% Not responsible for grandchildrenOther race 94 84.4% Responsible for grandchildren17 15.6% Not responsible for grandchildrenTwo or more races 51 21.8% Responsible for grandchildren184 78.2% Not responsible for grandchildrenWhite alone, not Hispanic / Latino 33 70.8% Responsible for grandchildren13 29.2% Not responsible for grandchildrenHispanic or Latino 265 29.2% Responsible for grandchildren644 70.8% Not responsible for grandchildrenGrandparents (60 years and over) White / Caucasian 188 20.0% Responsible for grandchildren749 80.0% Not responsible for grandchildrenBlack or African American 239 33.4% Responsible for grandchildren476 66.6% Not responsible for grandchildrenOther race 107 100.0% Not responsible for grandchildrenTwo or more races 224 25.4% Responsible for grandchildren656 74.6% Not responsible for grandchildrenWhite alone, not Hispanic / Latino 99 14.5% Responsible for grandchildren587 85.5% Not responsible for grandchildrenHispanic or Latino 194 17.6% Responsible for grandchildren909 82.4% Not responsible for grandchildren