Races in Pittsburg, California (CA) Detailed Stats
Data:
Races - White alone (%)
Races - White alone (% change since 2000)
Races - Black alone (%)
Races - Black alone (% change since 2000)
Races - American Indian alone (%)
Races - American Indian alone (% change since 2000)
Races - Asian alone (%)
Races - Asian alone (% change since 2000)
Races - Hispanic (%)
Races - Hispanic (% change since 2000)
Races - Native Hawaiian and Other Pacific Islander alone (%)
Races - Native Hawaiian and Other Pacific Islander alone (% change since 2000)
Races - Two or more races(%)
Races - Two or more races(% change since 2000)
Races - Other race alone (%)
Races - Other race alone (% change since 2000)
Racial diversity
Place of birth - Born in state of residence (%)
Place of birth - Born in state of residence (%) - White
Place of birth - Born in state of residence (%) - Black or African American
Place of birth - Born in state of residence (%) - Asian
Place of birth - Born in state of residence (%) - Hispanic or Latino
Place of birth - Born in state of residence (%) - American Indian and Alaska Native
Place of birth - Born in state of residence (%) - Multirace
Place of birth - Born in state of residence (%) - Other Race
Place of birth - Born in other state (%)
Place of birth - Born in other state (%) - White
Place of birth - Born in other state (%) - Black or African American
Place of birth - Born in other state (%) - Asian
Place of birth - Born in other state (%) - Hispanic or Latino
Place of birth - Born in other state (%) - American Indian and Alaska Native
Place of birth - Born in other state (%) - Multirace
Place of birth - Born in other state (%) - Other Race
Place of birth - Native, outside of US (%)
Place of birth - Native, outside of US (%) - White
Place of birth - Native, outside of US (%) - Black or African American
Place of birth - Native, outside of US (%) - Asian
Place of birth - Native, outside of US (%) - Hispanic or Latino
Place of birth - Native, outside of US (%) - American Indian and Alaska Native
Place of birth - Native, outside of US (%) - Multirace
Place of birth - Native, outside of US (%) - Other Race
Place of birth - Foreign born (%)
Place of birth - Foreign born (%) - White
Place of birth - Foreign born (%) - Black or African American
Place of birth - Foreign born (%) - Asian
Place of birth - Foreign born (%) - Hispanic or Latino
Place of birth - Foreign born (%) - American Indian and Alaska Native
Place of birth - Foreign born (%) - Multirace
Place of birth - Foreign born (%) - Other Race
Residents speaking English at home (%)
Residents speaking English at home - Born in the United States (%)
Residents speaking English at home - Native, born elsewhere (%)
Residents speaking English at home - Foreign born (%)
Residents speaking Spanish at home (%)
Residents speaking Spanish at home - Born in the United States (%)
Residents speaking Spanish at home - Native, born elsewhere (%)
Residents speaking Spanish at home - Foreign born (%)
Residents speaking other language at home (%)
Residents speaking other language at home - Born in the United States (%)
Residents speaking other language at home - Native, born elsewhere (%)
Residents speaking other language at home - Foreign born (%)
Marital status - Never married (%)
Marital status - Now married (%)
Marital status - Separated (%)
Marital status - Widowed (%)
Marital status - Divorced (%)
Ancestries Reported - Arab (%)
Ancestries Reported - Czech (%)
Ancestries Reported - Danish (%)
Ancestries Reported - Dutch (%)
Ancestries Reported - English (%)
Ancestries Reported - French (%)
Ancestries Reported - French Canadian (%)
Ancestries Reported - German (%)
Ancestries Reported - Greek (%)
Ancestries Reported - Hungarian (%)
Ancestries Reported - Irish (%)
Ancestries Reported - Italian (%)
Ancestries Reported - Lithuanian (%)
Ancestries Reported - Norwegian (%)
Ancestries Reported - Polish (%)
Ancestries Reported - Portuguese (%)
Ancestries Reported - Russian (%)
Ancestries Reported - Scotch-Irish (%)
Ancestries Reported - Scottish (%)
Ancestries Reported - Slovak (%)
Ancestries Reported - Subsaharan African (%)
Ancestries Reported - Swedish (%)
Ancestries Reported - Swiss (%)
Ancestries Reported - Ukrainian (%)
Ancestries Reported - United States (%)
Ancestries Reported - Welsh (%)
Ancestries Reported - West Indian (%)
Ancestries Reported - Other (%)
Geographical mobility - Same house 1 year ago (%)
Geographical mobility - Same house 1 year ago (%) - White
Geographical mobility - Same house 1 year ago (%) - Black or African American
Geographical mobility - Same house 1 year ago (%) - Asian
Geographical mobility - Same house 1 year ago (%) - Hispanic or Latino
Geographical mobility - Same house 1 year ago (%) - American Indian and Alaska Native
Geographical mobility - Same house 1 year ago (%) - Multirace
Geographical mobility - Same house 1 year ago (%) - Other Race
Geographical mobility - Moved within same county (%)
Geographical mobility - Moved within same county (%) - White
Geographical mobility - Moved within same county (%) - Black or African American
Geographical mobility - Moved within same county (%) - Asian
Geographical mobility - Moved within same county (%) - Hispanic or Latino
Geographical mobility - Moved within same county (%) - American Indian and Alaska Native
Geographical mobility - Moved within same county (%) - Multirace
Geographical mobility - Moved within same county (%) - Other Race
Geographical mobility - Moved from different county within same state (%)
Geographical mobility - Moved from different county within same state (%) - White
Geographical mobility - Moved from different county within same state (%) - Black or African American
Geographical mobility - Moved from different county within same state (%) - Asian
Geographical mobility - Moved from different county within same state (%) - Hispanic or Latino
Geographical mobility - Moved from different county within same state (%) - American Indian and Alaska Native
Geographical mobility - Moved from different county within same state (%) - Multirace
Geographical mobility - Moved from different county within same state (%) - Other Race
Geographical mobility - Moved from different state (%)
Geographical mobility - Moved from different state (%) - White
Geographical mobility - Moved from different state (%) - Black or African American
Geographical mobility - Moved from different state (%) - Asian
Geographical mobility - Moved from different state (%) - Hispanic or Latino
Geographical mobility - Moved from different state (%) - American Indian and Alaska Native
Geographical mobility - Moved from different state (%) - Multirace
Geographical mobility - Moved from different state (%) - Other Race
Geographical mobility - Moved from abroad (%)
Geographical mobility - Moved from abroad (%) - White
Geographical mobility - Moved from abroad (%) - Black or African American
Geographical mobility - Moved from abroad (%) - Asian
Geographical mobility - Moved from abroad (%) - Hispanic or Latino
Geographical mobility - Moved from abroad (%) - American Indian and Alaska Native
Geographical mobility - Moved from abroad (%) - Multirace
Geographical mobility - Moved from abroad (%) - Other Race
Place of birth for the foreign-born population - Ireland (%)
Place of birth for the foreign-born population - Denmark (%)
Place of birth for the foreign-born population - Norway (%)
Place of birth for the foreign-born population - Sweden (%)
Place of birth for the foreign-born population - United Kingdom (%)
Place of birth for the foreign-born population - England (%)
Place of birth for the foreign-born population - Scotland (%)
Place of birth for the foreign-born population - Other Northern Europe (%)
Place of birth for the foreign-born population - Austria (%)
Place of birth for the foreign-born population - Belgium (%)
Place of birth for the foreign-born population - France (%)
Place of birth for the foreign-born population - Germany (%)
Place of birth for the foreign-born population - Netherlands (%)
Place of birth for the foreign-born population - Switzerland (%)
Place of birth for the foreign-born population - Other Western Europe (%)
Place of birth for the foreign-born population - Greece (%)
Place of birth for the foreign-born population - Italy (%)
Place of birth for the foreign-born population - Portugal (%)
Place of birth for the foreign-born population - Spain (%)
Place of birth for the foreign-born population - Other Southern Europe (%)
Place of birth for the foreign-born population - Albania (%)
Place of birth for the foreign-born population - Belarus (%)
Place of birth for the foreign-born population - Bosnia and Herzegovina (%)
Place of birth for the foreign-born population - Bulgaria (%)
Place of birth for the foreign-born population - Croatia (%)
Place of birth for the foreign-born population - Czechoslovakia (%)
Place of birth for the foreign-born population - Hungary (%)
Place of birth for the foreign-born population - Latvia (%)
Place of birth for the foreign-born population - Lithuania (%)
Place of birth for the foreign-born population - North Macedonia (Macedonia) (%)
Place of birth for the foreign-born population - Moldova (%)
Place of birth for the foreign-born population - Poland (%)
Place of birth for the foreign-born population - Romania (%)
Place of birth for the foreign-born population - Russia (%)
Place of birth for the foreign-born population - Serbia (%)
Place of birth for the foreign-born population - Ukraine (%)
Place of birth for the foreign-born population - Other Eastern Europe (%)
Place of birth for the foreign-born population - China (%)
Place of birth for the foreign-born population - Hong Kong (%)
Place of birth for the foreign-born population - Taiwan (%)
Place of birth for the foreign-born population - Japan (%)
Place of birth for the foreign-born population - Korea (%)
Place of birth for the foreign-born population - Other Eastern Asia (%)
Place of birth for the foreign-born population - Afghanistan (%)
Place of birth for the foreign-born population - Bangladesh (%)
Place of birth for the foreign-born population - India (%)
Place of birth for the foreign-born population - Iran (%)
Place of birth for the foreign-born population - Kazakhstan (%)
Place of birth for the foreign-born population - Nepal (%)
Place of birth for the foreign-born population - Pakistan (%)
Place of birth for the foreign-born population - Sri Lanka (%)
Place of birth for the foreign-born population - Uzbekistan (%)
Place of birth for the foreign-born population - Other South Central Asia (%)
Place of birth for the foreign-born population - Burma (%)
Place of birth for the foreign-born population - Cambodia (%)
Place of birth for the foreign-born population - Indonesia (%)
Place of birth for the foreign-born population - Laos (%)
Place of birth for the foreign-born population - Malaysia (%)
Place of birth for the foreign-born population - Philippines (%)
Place of birth for the foreign-born population - Singapore (%)
Place of birth for the foreign-born population - Thailand (%)
Place of birth for the foreign-born population - Vietnam (%)
Place of birth for the foreign-born population - Other South Eastern Asia (%)
Place of birth for the foreign-born population - Armenia (%)
Place of birth for the foreign-born population - Iraq (%)
Place of birth for the foreign-born population - Israel (%)
Place of birth for the foreign-born population - Jordan (%)
Place of birth for the foreign-born population - Kuwait (%)
Place of birth for the foreign-born population - Lebanon (%)
Place of birth for the foreign-born population - Saudi Arabia (%)
Place of birth for the foreign-born population - Syria (%)
Place of birth for the foreign-born population - Turkey (%)
Place of birth for the foreign-born population - Yemen (%)
Place of birth for the foreign-born population - Other Western Asia (%)
Place of birth for the foreign-born population - Eritrea (%)
Place of birth for the foreign-born population - Ethiopia (%)
Place of birth for the foreign-born population - Kenya (%)
Place of birth for the foreign-born population - Somalia (%)
Place of birth for the foreign-born population - Uganda (%)
Place of birth for the foreign-born population - Zimbabwe (%)
Place of birth for the foreign-born population - Other Eastern Africa (%)
Place of birth for the foreign-born population - Cameroon (%)
Place of birth for the foreign-born population - Congo (%)
Place of birth for the foreign-born population - Democratic Republic of Congo (Zaire) (%)
Place of birth for the foreign-born population - Other Middle Africa (%)
Place of birth for the foreign-born population - Egypt (%)
Place of birth for the foreign-born population - Morocco (%)
Place of birth for the foreign-born population - Sudan (%)
Place of birth for the foreign-born population - Other Northern Africa (%)
Place of birth for the foreign-born population - South Africa (%)
Place of birth for the foreign-born population - Other Southern Africa (%)
Place of birth for the foreign-born population - Cabo Verde (%)
Place of birth for the foreign-born population - Ghana (%)
Place of birth for the foreign-born population - Liberia (%)
Place of birth for the foreign-born population - Nigeria (%)
Place of birth for the foreign-born population - Senegal (%)
Place of birth for the foreign-born population - Sierra Leone (%)
Place of birth for the foreign-born population - Other Western Africa (%)
Place of birth for the foreign-born population - Australia (%)
Place of birth for the foreign-born population - New Zealand (%)
Place of birth for the foreign-born population - Fiji (%)
Place of birth for the foreign-born population - Micronesia (%)
Place of birth for the foreign-born population - Bahamas (%)
Place of birth for the foreign-born population - Barbados (%)
Place of birth for the foreign-born population - Cuba (%)
Place of birth for the foreign-born population - Dominica (%)
Place of birth for the foreign-born population - Dominican Republic (%)
Place of birth for the foreign-born population - Grenada (%)
Place of birth for the foreign-born population - Haiti (%)
Place of birth for the foreign-born population - Jamaica (%)
Place of birth for the foreign-born population - St. Vincent and the Grenadines (%)
Place of birth for the foreign-born population - Trinidad and Tobago (%)
Place of birth for the foreign-born population - West Indies (%)
Place of birth for the foreign-born population - Other Caribbean (%)
Place of birth for the foreign-born population - Belize (%)
Place of birth for the foreign-born population - Costa Rica (%)
Place of birth for the foreign-born population - El Salvador (%)
Place of birth for the foreign-born population - Guatemala (%)
Place of birth for the foreign-born population - Honduras (%)
Place of birth for the foreign-born population - Mexico (%)
Place of birth for the foreign-born population - Nicaragua (%)
Place of birth for the foreign-born population - Panama (%)
Place of birth for the foreign-born population - Other Central America (%)
Place of birth for the foreign-born population - Argentina (%)
Place of birth for the foreign-born population - Bolivia (%)
Place of birth for the foreign-born population - Brazil (%)
Place of birth for the foreign-born population - Chile (%)
Place of birth for the foreign-born population - Colombia (%)
Place of birth for the foreign-born population - Ecuador (%)
Place of birth for the foreign-born population - Guyana (%)
Place of birth for the foreign-born population - Peru (%)
Place of birth for the foreign-born population - Uruguay (%)
Place of birth for the foreign-born population - Venezuela (%)
Place of birth for the foreign-born population - Other South America (%)
Place of birth for the foreign-born population - Canada (%)
Place of birth for the foreign-born population - Other Northern America (%)
Place of birth for the foreign-born population - Other (%)
Latest news about races in Pittsburg, CA collected exclusively by city-data.com from local newspapers, TV, and radio stations
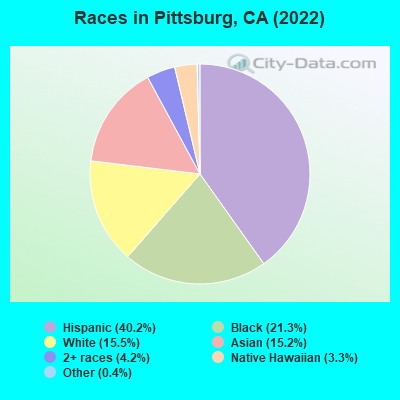
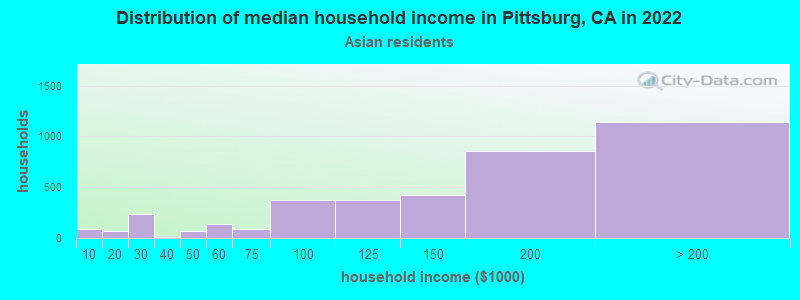
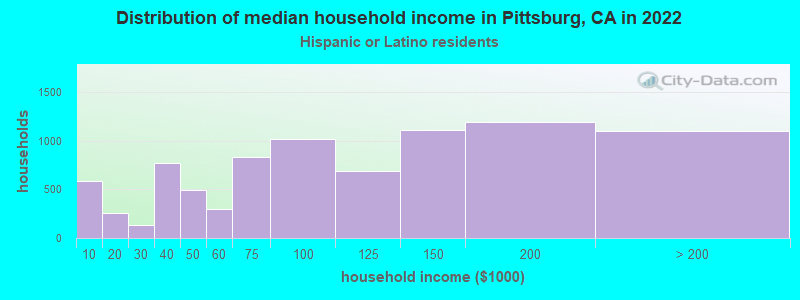
According to 2022 data, the most numerous races in Pittsburg, CA are Hispanic (34,011 residents), White alone (13,443 residents), and Asian alone (11,036 residents). 50.4% of Pittsburg residents speak English at home. 32.1% of Pittsburg, CA residents are foreign-born (17.2% born in Latin America, 12.0% born in Asia), which is 19.0% greater than the foreign-born rate of 26.0% across the entire state of California.
Race distribution in Pittsburg
2000 2022
18,287 32.2% Hispanic 17,697 31.2% White alone 10,457 18.4% Black alone 7,031 12.4% Asian alone 2,433 4.3% Two or more races 464 0.8% Native Hawaiian and Other 210 0.4% American Indian alone 190 0.3% Other race alone
34,011 46.8% Hispanic 13,443 18.5% White alone 11,036 15.2% Asian alone 8,888 12.2% Black alone 4,453 6.1% Two or more races 2,678 3.7% Other race alone 184 0.3% Native Hawaiian and Other 30 0.04% American Indian alone
2000 2022
15,816,790 46.7% White alone 10,966,556 32.4% Hispanic 3,648,860 10.8% Asian alone 2,181,926 6.4% Black alone 903,115 2.7% Two or more races 178,984 0.5% American Indian alone 103,736 0.3% Native Hawaiian and Other 71,681 0.2% Other race alone
15,732,184 40.3% Hispanic 13,160,426 33.7% White alone 5,957,867 15.3% Asian alone 2,025,218 5.2% Black alone 1,663,222 4.3% Two or more races 251,618 0.6% Other race alone 135,777 0.3% Native Hawaiian and Other 103,030 0.3% American Indian alone
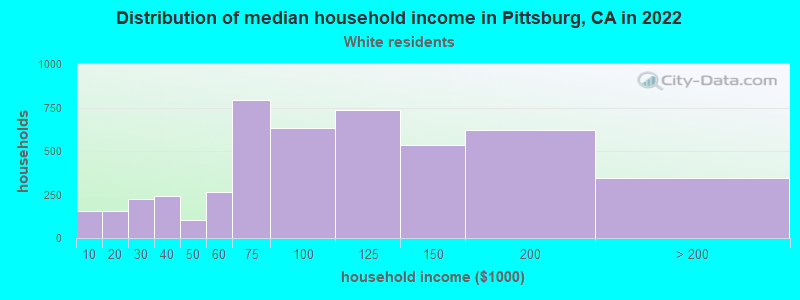
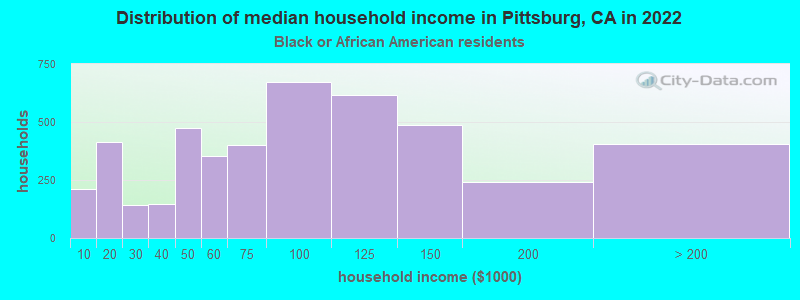
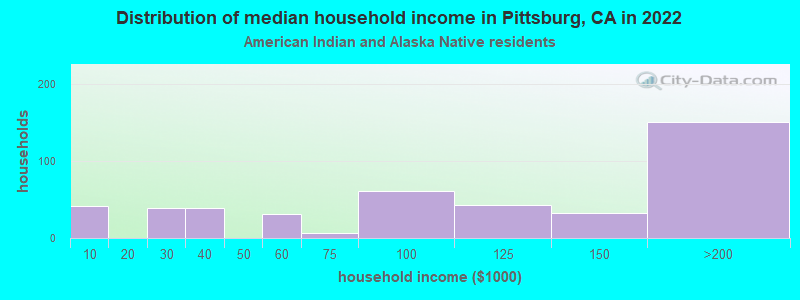
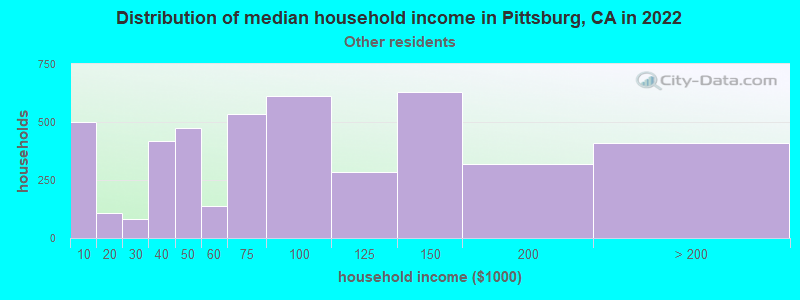
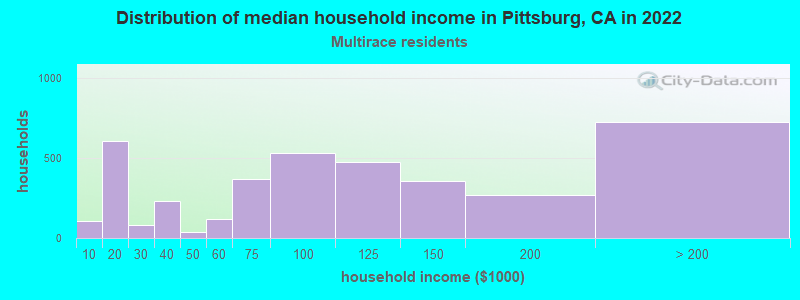
Income and house value in Pittsburg Median household income in 2022 $111,408 White non-Hispanic householders$87,841 Black householders$84,413 American Indian and Alaska Native householders$123,938 Asian householders$114,014 Native Hawaiian and other Pacific Islander householders$97,404 Some other race householders$109,358 Two or more races householders$88,465 Hispanic or Latino race householdersMedian 2022 house value $598,203 White Non-Hispanic householders$582,366 Black or African American householders$557,890 American Indian or Alaska Native householders $664,789 Asian householders$522,257 Native Hawaiian and other Pacific Islander householders$530,896 Some other race householders$648,953 Two or more races householders$548,532 Hispanic or Latino householders
Median age by race in Pittsburg
40.1 Median age for White residents39.6 40.3 40.1 Median age for Black or African American residents31.4 46.2 25.4 Median age for American Indian / Alaska Native residents25.7 25.4 44.5 Median age for Asian residents40.7 48.2 30.3 Median age for Native Hawaiian / Pacific Islander residents31.8 Median age for Other race residents32.0 30.9 36.6 Median age for Two or more races residents26.5 37.3 40.8 Median age for White alone residents39.2 45.5 31.3 Median age for Hispanic or Latino residents31.8 30.4
Owner/renter occupied households by race in Pittsburg
House owners and renters - White residents 5,205 72.1% Owner occupied2,012 27.9% Renter occupiedHouse owners and renters - Black or African American residents 882 23.6% Owner occupied2,854 76.4% Renter occupiedHouse owners and renters - American Indian / Alaska Native residents 178 77.4% Owner occupied52 22.6% Renter occupiedHouse owners and renters - Asian residents 2,637 81.3% Owner occupied608 18.7% Renter occupiedHouse owners and renters - Native Hawaiian / Pacific Islander residents 30 16.7% Owner occupied148 83.3% Renter occupiedHouse owners and renters - Other race residents 2,230 47.0% Owner occupied2,513 53.0% Renter occupiedHouse owners and renters - Two or more races residents 2,134 32.1% Owner occupied4,521 67.9% Renter occupiedHouse owners and renters - White alone residents 3,936 75.6% Owner occupied1,274 24.4% Renter occupiedHouse owners and renters - Hispanic or Latino residents 4,277 53.9% Owner occupied3,652 46.1% Renter occupied
Language usage in Pittsburg
English speakers - Total 50.4% of residents of Pittsburg speak English at home.
33.0% of residents speak Spanish at home 13,361 60.9% Speak English very well8,588 39.1% Speak English less than very well16.5% of residents speak other language at home 6,819 62.0% Speak English very well4,178 38.0% Speak English less than very well
English speakers - Born in the United States 88.3% of residents of Pittsburg speak English at home.
8.0% of residents speak Spanish at home 498 91.9% Speak English very well44 8.1% Speak English less than very well3.7% of residents speak other language at home 190 76.6% Speak English very well58 23.4% Speak English less than very well
English speakers - Native, born elsewhere 44.2% of residents of Pittsburg speak English at home.
23.5% of residents speak Spanish at home 185 73.7% Speak English very well66 26.3% Speak English less than very well31.4% of residents speak other language at home 268 80.0% Speak English very well67 20.0% Speak English less than very well
English speakers - Foreign-born 10.3% of residents of Pittsburg speak English at home.
50.0% of residents speak Spanish at home 4,068 36.0% Speak English very well7,229 64.0% Speak English less than very well39.5% of residents speak other language at home 5,007 56.1% Speak English very well3,918 43.9% Speak English less than very well
White (Caucasian) - Speak only English Native:
83.1% (13,125)Foreign-born:
18.7% (812)
White (Caucasian) - Speak another language Native:
16.4% (2,589)Foreign-born:
81.4% (3,527)
Black or African American - Speak only English Native:
95.9% (9,027)Foreign-born:
34.5% (352)
Black or African American - Speak another language Native:
4.0% (376)Foreign-born:
65.5% (666)
American Indian / Alaska Native - Speak another language Native:
69.0% (315)Foreign-born:
100.0% (411)
Asian - Speak only English Native:
75.2% (2,733)Foreign-born:
8.8% (563)
Asian - Speak another language Native:
26.0% (944)Foreign-born:
91.0% (5,834)
Native Hawaiian / Pacific Islander - Speak only English Native:
56.8% (109)Foreign-born:
39.2% (90)
Native Hawaiian / Pacific Islander - Speak another language Native:
39.1% (75)Foreign-born:
66.5% (153)
Other race - Speak only English Native:
36.7% (4,026)Foreign-born:
0.4% (32)
Other race - Speak another language Native:
64.0% (7,032)Foreign-born:
98.1% (8,215)
Two or more races - Speak only English Native:
63.3% (6,516)Foreign-born:
2.4% (170)
Two or more races - Speak another language Native:
36.8% (3,791)Foreign-born:
100.0% (6,939)
White alone - Speak only English Native:
94.9% (10,695)Foreign-born:
53.7% (780)
White alone - Speak another language Native:
5.1% (573)Foreign-born:
45.8% (666)
Hispanic or Latino - Speak only English Native:
45.1% (8,452)Foreign-born:
1.8% (227)
Hispanic or Latino - Speak another language Native:
55.1% (10,317)Foreign-born:
97.2% (11,950)
Foreign-born residents in Pittsburg 23,202 residents are foreign born (17.2% Latin America , 12.0% Asia ).
This city:
32.1%California:
100.0%
Marital status for residents in Pittsburg Marital status - White (Caucasian) population 15 years and over
Males 42.7% Never married43.2% Now married1.1% Separated1.4% Widowed11.6% DivorcedFemales 27.9% Never married45.4% Now married0.7% Separated10.0% Widowed15.9% DivorcedWomen who gave birth in the past 12 months Now married:
36.9% (48)Unmarried:
63.1% (83)
Women who did not give birth in the past 12 months Now married:
46.9% (2,460)Unmarried:
53.1% (2,790)
Marital status - Black or African American population 15 years and over
Males 78.2% Never married16.1% Now married0.0% Separated4.0% Widowed1.8% DivorcedFemales 52.7% Never married12.7% Now married2.9% Separated7.3% Widowed24.4% DivorcedWomen who gave birth in the past 12 months Now married:
62.8% (86)Unmarried:
37.2% (51)
Women who did not give birth in the past 12 months Now married:
21.4% (585)Unmarried:
78.6% (2,145)
Marital status - American Indian / Alaska Native population 15 years and over
Males 63.3% Never married33.8% Now married0.0% Separated0.0% Widowed2.9% DivorcedFemales 39.0% Never married34.1% Now married14.5% Separated11.2% Widowed1.2% DivorcedWomen who gave birth in the past 12 months Now married:
63.6% (10)Unmarried:
36.4% (6)
Women who did not give birth in the past 12 months Now married:
26.1% (45)Unmarried:
73.9% (128)
Marital status - Asian population 15 years and over
Males 34.4% Never married53.1% Now married6.0% Separated4.9% Widowed1.5% DivorcedFemales 23.7% Never married62.6% Now married4.5% Separated0.7% Widowed8.5% DivorcedWomen who gave birth in the past 12 months Now married:
70.1% (96)Unmarried:
29.9% (41)
Women who did not give birth in the past 12 months Now married:
49.1% (1,396)Unmarried:
50.9% (1,447)
Marital status - Native Hawaiian / Pacific Islander population 15 years and over
Males 31.0% Never married69.0% Now married0.0% Separated0.0% Widowed0.0% DivorcedFemales 45.3% Never married54.7% Now married0.0% Separated0.0% Widowed0.0% DivorcedWomen who gave birth in the past 12 months Now married:
100.0% (5)Unmarried:
0.0% (0)
Women who did not give birth in the past 12 months Now married:
33.6% (36)Unmarried:
66.4% (70)
Marital status - Other race population 15 years and over
Males 47.4% Never married45.1% Now married0.7% Separated0.1% Widowed6.7% DivorcedFemales 41.2% Never married41.1% Now married5.3% Separated2.6% Widowed9.8% DivorcedWomen who gave birth in the past 12 months Now married:
100.0% (301)Unmarried:
0.0% (0)
Women who did not give birth in the past 12 months Now married:
34.9% (1,722)Unmarried:
65.1% (3,209)
Marital status - Two or more races population 15 years and over
Males 54.3% Never married38.1% Now married1.9% Separated1.0% Widowed4.8% DivorcedFemales 40.6% Never married38.8% Now married3.2% Separated5.7% Widowed11.7% DivorcedWomen who gave birth in the past 12 months Now married:
62.7% (556)Unmarried:
37.3% (331)
Women who did not give birth in the past 12 months Now married:
31.3% (1,198)Unmarried:
68.7% (2,624)
Marital status - White alone, not Hispanic / Latino population 15 years and over
Males 35.4% Never married50.8% Now married0.0% Separated2.4% Widowed11.4% DivorcedFemales 21.8% Never married44.4% Now married0.0% Separated15.3% Widowed18.6% DivorcedWomen who gave birth in the past 12 months Now married:
55.8% (86)Unmarried:
44.2% (68)
Women who did not give birth in the past 12 months Now married:
48.7% (1,157)Unmarried:
51.3% (1,221)
Marital status - Hispanic or Latino population 15 years and over
Males 50.2% Never married43.0% Now married1.0% Separated0.0% Widowed5.9% DivorcedFemales 39.8% Never married44.3% Now married2.7% Separated2.7% Widowed10.5% DivorcedWomen who gave birth in the past 12 months Now married:
42.7% (163)Unmarried:
57.3% (218)
Women who did not give birth in the past 12 months Now married:
36.7% (3,150)Unmarried:
63.3% (5,432)
Ancestries in Pittsburg
827 2.2% American718 1.9% Italian650 1.7% Afghan593 1.5% Nigerian470 1.2% English444 1.2% African399 1.0% European393 1.0% German371 1.0% Irish139 0.4% Liberian117 0.3% Palestinian86 0.2% Brazilian84 0.2% Turkish74 0.2% Norwegian74 0.2% Kenyan71 0.2% Portuguese71 0.2% Sudanese67 0.2% Scottish63 0.2% Dutch62 0.2% Scandinavian62 0.2% Polish61 0.2% Jordanian58 0.2% Bulgarian53 0.1% Hungarian50 0.1% Swedish49 0.1% Iraqi44 0.1% Guyanese43 0.1% Russian37 0.10% French30 0.08% Greek29 0.08% Belizean27 0.07% Arab25 0.07% Scotch-Irish23 0.06% Iranian22 0.06% Ukrainian18 0.05% Finnish15 0.04% Lebanese15 0.04% British14 0.04% Maltese12 0.03% Lithuanian11 0.03% Jamaican9 0.02% Slovene8 0.02% Egyptian8 0.02% Latvian8 0.02% Northern European7 0.02% French Canadian6 0.02% Australian5 0.01% Romanian4 0.01% Armenian3 0.01% Danish2 0.01% Yugoslavian
Geographical mobility in Pittsburg Same house 1 year ago 19,665 91.1% White (Caucasian)9,192 85.1% Black or African American753 100.0% American Indian / Alaska Native12,155 91.9% Asian331 79.9% Native Hawaiian / Pacific Islander16,118 90.7% Other race15,529 87.6% Two or more races10,985 85.7% White alone, not Hispanic / Latino28,184 91.0% Hispanic or LatinoMoved within same county 1,262 5.8% White / Caucasian818 7.6% Black or African American15 2.0% American Indian / Alaska Native625 4.7% Asian30 7.2% Native Hawaiian / Pacific Islander1,051 5.9% Other race1,346 7.6% Two or more races1,173 9.1% White alone, not Hispanic / Latino1,919 6.2% Hispanic or LatinoMoved within same state 671 3.1% White / Caucasian503 4.7% Black or African American264 2.0% Asian24 5.8% Native Hawaiian / Pacific Islander528 3.0% Other race392 2.2% Two or more races371 2.9% White alone, not Hispanic / Latino763 2.5% Hispanic or LatinoMoved from different state 199 1.8% Black or African American83 0.6% Asian33 7.9% Native Hawaiian / Pacific Islander337 1.9% Two or more races181 1.4% White alone, not Hispanic / Latino24 0.1% Hispanic or LatinoMoved from abroad 27 0.1% White19 0.2% Black or African American78 0.6% Asian71 0.4% Other race76 0.6% White alone, not Hispanic / Latino101 0.3% Hispanic or Latino
Children Nativity (place of birth) in Pittsburg
Children under 6 years - Living with two parents Both parents native 1,077 100.0% NativeBoth parents foreign-born 2,056 100.0% NativeOne native, one foreign-born parent 235 100.0% NativeChildren under 6 years - Living with one parent Native parent 1,860 100.0% NativeForeign-born parent 328 100.0% NativeChildren 6 to 17 years - Living with two parents Both parents native 1,774 100.0% NativeBoth parents foreign-born 2,729 93.5% Native189 6.5% Foreign-bornOne native, one foreign-born parent 887 100.0% NativeChildren 6 to 17 years - Living with one parent Native parent 2,571 100.0% NativeForeign-born parent 1,233 50.0% Native1,233 50.0% Foreign-born
Place of birth for residents in Pittsburg 12,477 Americas12,445 Latin America11,812 Central America8,661 Asia5,701 South Eastern Asia1,919 South Central Asia1,099 Africa676 Western Africa661 Eastern Asia604 South America593 Europe580 China370 Oceania267 Western Asia245 Northern Europe190 Eastern Europe145 Southern Africa134 Eastern Africa124 Western Europe82 Australia and New Zealand Subregion67 Northern Africa42 Middle Africa33 Southern Europe32 Northern America28 Caribbean9,014 Mexico4,650 Philippines1,725 El Salvador1,005 India598 Vietnam586 Afghanistan567 Nicaragua481 Guatemala473 China429 Nigeria239 Pakistan234 Peru216 Fiji216 Liberia145 South Africa140 Brazil131 United Kingdom127 Thailand115 Yemen113 Kenya100 Laos93 Colombia88 England80 Taiwan79 Germany72 Indonesia72 Romania67 Guyana66 Malaysia63 Bulgaria61 Japan57 New Zealand53 Jordan44 Russia43 Iran42 Cameroon42 Iraq37 Ecuador34 Sudan34 Cambodia33 Egypt30 Ghana28 Netherlands28 Singapore27 Hong Kong25 Ireland25 Bangladesh24 Australia22 Burma20 Uruguay19 Nepal19 Korea17 Switzerland13 Canada13 Italy12 Costa Rica11 Honduras10 Cuba10 Jamaica9 Poland8 Dominican Republic8 Venezuela5 Armenia4 Zimbabwe3 Spain3 Saudi Arabia2 Argentina
Grandparents responsible for own grandchildren in Pittsburg
Grandparents (30 to 59 years) White / Caucasian 31 22.8% Responsible for grandchildren105 77.2% Not responsible for grandchildrenBlack or African American 27 15.4% Responsible for grandchildren151 84.6% Not responsible for grandchildrenAmerican Indian / Alaska Native 2 26.3% Responsible for grandchildren5 73.7% Not responsible for grandchildrenAsian 26 14.5% Responsible for grandchildren150 85.5% Not responsible for grandchildrenNative Hawaiian / Pacific Islander 36 100.0% Not responsible for grandchildrenOther race 27 7.5% Responsible for grandchildren333 92.5% Not responsible for grandchildrenTwo or more races 78 15.3% Responsible for grandchildren431 84.7% Not responsible for grandchildrenWhite alone, not Hispanic / Latino 9 11.5% Responsible for grandchildren73 88.5% Not responsible for grandchildrenHispanic or Latino 45 9.6% Responsible for grandchildren426 90.4% Not responsible for grandchildrenGrandparents (60 years and over) White / Caucasian 43 10.7% Responsible for grandchildren362 89.3% Not responsible for grandchildrenBlack or African American 101 57.2% Responsible for grandchildren75 42.8% Not responsible for grandchildrenAmerican Indian / Alaska Native 20 100.0% Not responsible for grandchildrenAsian 36 5.9% Responsible for grandchildren576 94.1% Not responsible for grandchildrenNative Hawaiian / Pacific Islander 4 100.0% Not responsible for grandchildrenOther race 25 5.7% Responsible for grandchildren410 94.3% Not responsible for grandchildrenTwo or more races 126 21.2% Responsible for grandchildren469 78.8% Not responsible for grandchildrenWhite alone, not Hispanic / Latino 13 4.1% Responsible for grandchildren293 95.9% Not responsible for grandchildrenHispanic or Latino 87 13.2% Responsible for grandchildren569 86.8% Not responsible for grandchildren