Races in Placentia, California (CA) Detailed Stats
Data:
Races - White alone (%)
Races - White alone (% change since 2000)
Races - Black alone (%)
Races - Black alone (% change since 2000)
Races - American Indian alone (%)
Races - American Indian alone (% change since 2000)
Races - Asian alone (%)
Races - Asian alone (% change since 2000)
Races - Hispanic (%)
Races - Hispanic (% change since 2000)
Races - Native Hawaiian and Other Pacific Islander alone (%)
Races - Native Hawaiian and Other Pacific Islander alone (% change since 2000)
Races - Two or more races(%)
Races - Two or more races(% change since 2000)
Races - Other race alone (%)
Races - Other race alone (% change since 2000)
Racial diversity
Place of birth - Born in state of residence (%)
Place of birth - Born in state of residence (%) - White
Place of birth - Born in state of residence (%) - Black or African American
Place of birth - Born in state of residence (%) - Asian
Place of birth - Born in state of residence (%) - Hispanic or Latino
Place of birth - Born in state of residence (%) - American Indian and Alaska Native
Place of birth - Born in state of residence (%) - Multirace
Place of birth - Born in state of residence (%) - Other Race
Place of birth - Born in other state (%)
Place of birth - Born in other state (%) - White
Place of birth - Born in other state (%) - Black or African American
Place of birth - Born in other state (%) - Asian
Place of birth - Born in other state (%) - Hispanic or Latino
Place of birth - Born in other state (%) - American Indian and Alaska Native
Place of birth - Born in other state (%) - Multirace
Place of birth - Born in other state (%) - Other Race
Place of birth - Native, outside of US (%)
Place of birth - Native, outside of US (%) - White
Place of birth - Native, outside of US (%) - Black or African American
Place of birth - Native, outside of US (%) - Asian
Place of birth - Native, outside of US (%) - Hispanic or Latino
Place of birth - Native, outside of US (%) - American Indian and Alaska Native
Place of birth - Native, outside of US (%) - Multirace
Place of birth - Native, outside of US (%) - Other Race
Place of birth - Foreign born (%)
Place of birth - Foreign born (%) - White
Place of birth - Foreign born (%) - Black or African American
Place of birth - Foreign born (%) - Asian
Place of birth - Foreign born (%) - Hispanic or Latino
Place of birth - Foreign born (%) - American Indian and Alaska Native
Place of birth - Foreign born (%) - Multirace
Place of birth - Foreign born (%) - Other Race
Residents speaking English at home (%)
Residents speaking English at home - Born in the United States (%)
Residents speaking English at home - Native, born elsewhere (%)
Residents speaking English at home - Foreign born (%)
Residents speaking Spanish at home (%)
Residents speaking Spanish at home - Born in the United States (%)
Residents speaking Spanish at home - Native, born elsewhere (%)
Residents speaking Spanish at home - Foreign born (%)
Residents speaking other language at home (%)
Residents speaking other language at home - Born in the United States (%)
Residents speaking other language at home - Native, born elsewhere (%)
Residents speaking other language at home - Foreign born (%)
Marital status - Never married (%)
Marital status - Now married (%)
Marital status - Separated (%)
Marital status - Widowed (%)
Marital status - Divorced (%)
Ancestries Reported - Arab (%)
Ancestries Reported - Czech (%)
Ancestries Reported - Danish (%)
Ancestries Reported - Dutch (%)
Ancestries Reported - English (%)
Ancestries Reported - French (%)
Ancestries Reported - French Canadian (%)
Ancestries Reported - German (%)
Ancestries Reported - Greek (%)
Ancestries Reported - Hungarian (%)
Ancestries Reported - Irish (%)
Ancestries Reported - Italian (%)
Ancestries Reported - Lithuanian (%)
Ancestries Reported - Norwegian (%)
Ancestries Reported - Polish (%)
Ancestries Reported - Portuguese (%)
Ancestries Reported - Russian (%)
Ancestries Reported - Scotch-Irish (%)
Ancestries Reported - Scottish (%)
Ancestries Reported - Slovak (%)
Ancestries Reported - Subsaharan African (%)
Ancestries Reported - Swedish (%)
Ancestries Reported - Swiss (%)
Ancestries Reported - Ukrainian (%)
Ancestries Reported - United States (%)
Ancestries Reported - Welsh (%)
Ancestries Reported - West Indian (%)
Ancestries Reported - Other (%)
Geographical mobility - Same house 1 year ago (%)
Geographical mobility - Same house 1 year ago (%) - White
Geographical mobility - Same house 1 year ago (%) - Black or African American
Geographical mobility - Same house 1 year ago (%) - Asian
Geographical mobility - Same house 1 year ago (%) - Hispanic or Latino
Geographical mobility - Same house 1 year ago (%) - American Indian and Alaska Native
Geographical mobility - Same house 1 year ago (%) - Multirace
Geographical mobility - Same house 1 year ago (%) - Other Race
Geographical mobility - Moved within same county (%)
Geographical mobility - Moved within same county (%) - White
Geographical mobility - Moved within same county (%) - Black or African American
Geographical mobility - Moved within same county (%) - Asian
Geographical mobility - Moved within same county (%) - Hispanic or Latino
Geographical mobility - Moved within same county (%) - American Indian and Alaska Native
Geographical mobility - Moved within same county (%) - Multirace
Geographical mobility - Moved within same county (%) - Other Race
Geographical mobility - Moved from different county within same state (%)
Geographical mobility - Moved from different county within same state (%) - White
Geographical mobility - Moved from different county within same state (%) - Black or African American
Geographical mobility - Moved from different county within same state (%) - Asian
Geographical mobility - Moved from different county within same state (%) - Hispanic or Latino
Geographical mobility - Moved from different county within same state (%) - American Indian and Alaska Native
Geographical mobility - Moved from different county within same state (%) - Multirace
Geographical mobility - Moved from different county within same state (%) - Other Race
Geographical mobility - Moved from different state (%)
Geographical mobility - Moved from different state (%) - White
Geographical mobility - Moved from different state (%) - Black or African American
Geographical mobility - Moved from different state (%) - Asian
Geographical mobility - Moved from different state (%) - Hispanic or Latino
Geographical mobility - Moved from different state (%) - American Indian and Alaska Native
Geographical mobility - Moved from different state (%) - Multirace
Geographical mobility - Moved from different state (%) - Other Race
Geographical mobility - Moved from abroad (%)
Geographical mobility - Moved from abroad (%) - White
Geographical mobility - Moved from abroad (%) - Black or African American
Geographical mobility - Moved from abroad (%) - Asian
Geographical mobility - Moved from abroad (%) - Hispanic or Latino
Geographical mobility - Moved from abroad (%) - American Indian and Alaska Native
Geographical mobility - Moved from abroad (%) - Multirace
Geographical mobility - Moved from abroad (%) - Other Race
Place of birth for the foreign-born population - Ireland (%)
Place of birth for the foreign-born population - Denmark (%)
Place of birth for the foreign-born population - Norway (%)
Place of birth for the foreign-born population - Sweden (%)
Place of birth for the foreign-born population - United Kingdom (%)
Place of birth for the foreign-born population - England (%)
Place of birth for the foreign-born population - Scotland (%)
Place of birth for the foreign-born population - Other Northern Europe (%)
Place of birth for the foreign-born population - Austria (%)
Place of birth for the foreign-born population - Belgium (%)
Place of birth for the foreign-born population - France (%)
Place of birth for the foreign-born population - Germany (%)
Place of birth for the foreign-born population - Netherlands (%)
Place of birth for the foreign-born population - Switzerland (%)
Place of birth for the foreign-born population - Other Western Europe (%)
Place of birth for the foreign-born population - Greece (%)
Place of birth for the foreign-born population - Italy (%)
Place of birth for the foreign-born population - Portugal (%)
Place of birth for the foreign-born population - Spain (%)
Place of birth for the foreign-born population - Other Southern Europe (%)
Place of birth for the foreign-born population - Albania (%)
Place of birth for the foreign-born population - Belarus (%)
Place of birth for the foreign-born population - Bosnia and Herzegovina (%)
Place of birth for the foreign-born population - Bulgaria (%)
Place of birth for the foreign-born population - Croatia (%)
Place of birth for the foreign-born population - Czechoslovakia (%)
Place of birth for the foreign-born population - Hungary (%)
Place of birth for the foreign-born population - Latvia (%)
Place of birth for the foreign-born population - Lithuania (%)
Place of birth for the foreign-born population - North Macedonia (Macedonia) (%)
Place of birth for the foreign-born population - Moldova (%)
Place of birth for the foreign-born population - Poland (%)
Place of birth for the foreign-born population - Romania (%)
Place of birth for the foreign-born population - Russia (%)
Place of birth for the foreign-born population - Serbia (%)
Place of birth for the foreign-born population - Ukraine (%)
Place of birth for the foreign-born population - Other Eastern Europe (%)
Place of birth for the foreign-born population - China (%)
Place of birth for the foreign-born population - Hong Kong (%)
Place of birth for the foreign-born population - Taiwan (%)
Place of birth for the foreign-born population - Japan (%)
Place of birth for the foreign-born population - Korea (%)
Place of birth for the foreign-born population - Other Eastern Asia (%)
Place of birth for the foreign-born population - Afghanistan (%)
Place of birth for the foreign-born population - Bangladesh (%)
Place of birth for the foreign-born population - India (%)
Place of birth for the foreign-born population - Iran (%)
Place of birth for the foreign-born population - Kazakhstan (%)
Place of birth for the foreign-born population - Nepal (%)
Place of birth for the foreign-born population - Pakistan (%)
Place of birth for the foreign-born population - Sri Lanka (%)
Place of birth for the foreign-born population - Uzbekistan (%)
Place of birth for the foreign-born population - Other South Central Asia (%)
Place of birth for the foreign-born population - Burma (%)
Place of birth for the foreign-born population - Cambodia (%)
Place of birth for the foreign-born population - Indonesia (%)
Place of birth for the foreign-born population - Laos (%)
Place of birth for the foreign-born population - Malaysia (%)
Place of birth for the foreign-born population - Philippines (%)
Place of birth for the foreign-born population - Singapore (%)
Place of birth for the foreign-born population - Thailand (%)
Place of birth for the foreign-born population - Vietnam (%)
Place of birth for the foreign-born population - Other South Eastern Asia (%)
Place of birth for the foreign-born population - Armenia (%)
Place of birth for the foreign-born population - Iraq (%)
Place of birth for the foreign-born population - Israel (%)
Place of birth for the foreign-born population - Jordan (%)
Place of birth for the foreign-born population - Kuwait (%)
Place of birth for the foreign-born population - Lebanon (%)
Place of birth for the foreign-born population - Saudi Arabia (%)
Place of birth for the foreign-born population - Syria (%)
Place of birth for the foreign-born population - Turkey (%)
Place of birth for the foreign-born population - Yemen (%)
Place of birth for the foreign-born population - Other Western Asia (%)
Place of birth for the foreign-born population - Eritrea (%)
Place of birth for the foreign-born population - Ethiopia (%)
Place of birth for the foreign-born population - Kenya (%)
Place of birth for the foreign-born population - Somalia (%)
Place of birth for the foreign-born population - Uganda (%)
Place of birth for the foreign-born population - Zimbabwe (%)
Place of birth for the foreign-born population - Other Eastern Africa (%)
Place of birth for the foreign-born population - Cameroon (%)
Place of birth for the foreign-born population - Congo (%)
Place of birth for the foreign-born population - Democratic Republic of Congo (Zaire) (%)
Place of birth for the foreign-born population - Other Middle Africa (%)
Place of birth for the foreign-born population - Egypt (%)
Place of birth for the foreign-born population - Morocco (%)
Place of birth for the foreign-born population - Sudan (%)
Place of birth for the foreign-born population - Other Northern Africa (%)
Place of birth for the foreign-born population - South Africa (%)
Place of birth for the foreign-born population - Other Southern Africa (%)
Place of birth for the foreign-born population - Cabo Verde (%)
Place of birth for the foreign-born population - Ghana (%)
Place of birth for the foreign-born population - Liberia (%)
Place of birth for the foreign-born population - Nigeria (%)
Place of birth for the foreign-born population - Senegal (%)
Place of birth for the foreign-born population - Sierra Leone (%)
Place of birth for the foreign-born population - Other Western Africa (%)
Place of birth for the foreign-born population - Australia (%)
Place of birth for the foreign-born population - New Zealand (%)
Place of birth for the foreign-born population - Fiji (%)
Place of birth for the foreign-born population - Micronesia (%)
Place of birth for the foreign-born population - Bahamas (%)
Place of birth for the foreign-born population - Barbados (%)
Place of birth for the foreign-born population - Cuba (%)
Place of birth for the foreign-born population - Dominica (%)
Place of birth for the foreign-born population - Dominican Republic (%)
Place of birth for the foreign-born population - Grenada (%)
Place of birth for the foreign-born population - Haiti (%)
Place of birth for the foreign-born population - Jamaica (%)
Place of birth for the foreign-born population - St. Vincent and the Grenadines (%)
Place of birth for the foreign-born population - Trinidad and Tobago (%)
Place of birth for the foreign-born population - West Indies (%)
Place of birth for the foreign-born population - Other Caribbean (%)
Place of birth for the foreign-born population - Belize (%)
Place of birth for the foreign-born population - Costa Rica (%)
Place of birth for the foreign-born population - El Salvador (%)
Place of birth for the foreign-born population - Guatemala (%)
Place of birth for the foreign-born population - Honduras (%)
Place of birth for the foreign-born population - Mexico (%)
Place of birth for the foreign-born population - Nicaragua (%)
Place of birth for the foreign-born population - Panama (%)
Place of birth for the foreign-born population - Other Central America (%)
Place of birth for the foreign-born population - Argentina (%)
Place of birth for the foreign-born population - Bolivia (%)
Place of birth for the foreign-born population - Brazil (%)
Place of birth for the foreign-born population - Chile (%)
Place of birth for the foreign-born population - Colombia (%)
Place of birth for the foreign-born population - Ecuador (%)
Place of birth for the foreign-born population - Guyana (%)
Place of birth for the foreign-born population - Peru (%)
Place of birth for the foreign-born population - Uruguay (%)
Place of birth for the foreign-born population - Venezuela (%)
Place of birth for the foreign-born population - Other South America (%)
Place of birth for the foreign-born population - Canada (%)
Place of birth for the foreign-born population - Other Northern America (%)
Place of birth for the foreign-born population - Other (%)
Latest news about races in Placentia, CA collected exclusively by city-data.com from local newspapers, TV, and radio stations
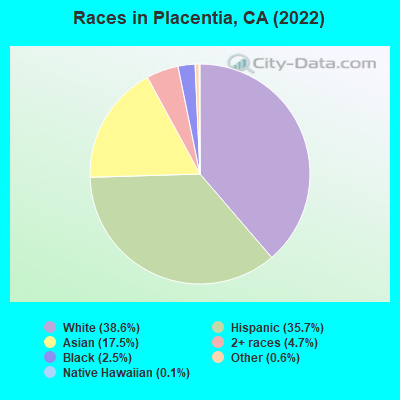
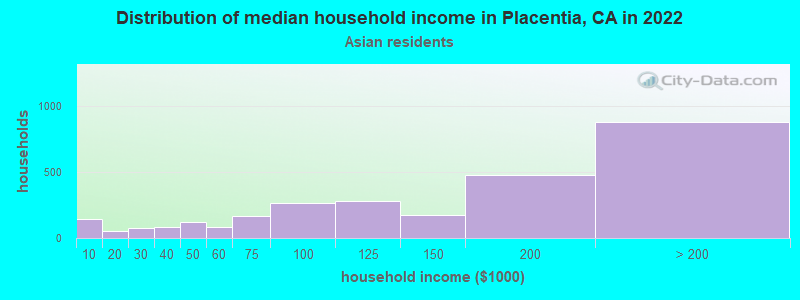
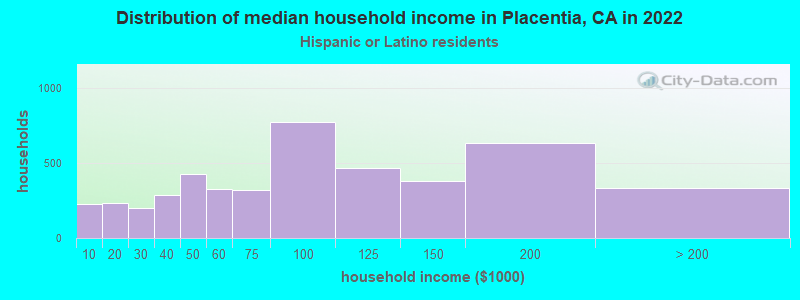
According to 2022 data, the most numerous races in Placentia, CA are Hispanic (20,735 residents), White alone (18,908 residents), and Asian alone (9,483 residents). 62.7% of Placentia residents speak English at home. 24.6% of Placentia, CA residents are foreign-born (11.3% born in Latin America, 10.9% born in Asia), which is 5.6% less than the foreign-born rate of 26.0% across the entire state of California.
Race distribution in Placentia
2000 2022
15,816,790 46.7% White alone 10,966,556 32.4% Hispanic 3,648,860 10.8% Asian alone 2,181,926 6.4% Black alone 903,115 2.7% Two or more races 178,984 0.5% American Indian alone 103,736 0.3% Native Hawaiian and Other 71,681 0.2% Other race alone
15,732,184 40.3% Hispanic 13,160,426 33.7% White alone 5,957,867 15.3% Asian alone 2,025,218 5.2% Black alone 1,663,222 4.3% Two or more races 251,618 0.6% Other race alone 135,777 0.3% Native Hawaiian and Other 103,030 0.3% American Indian alone
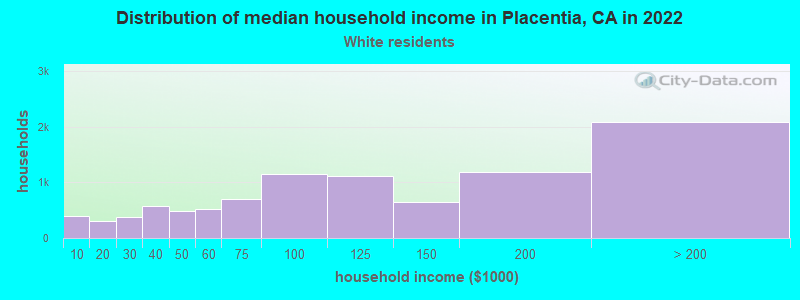
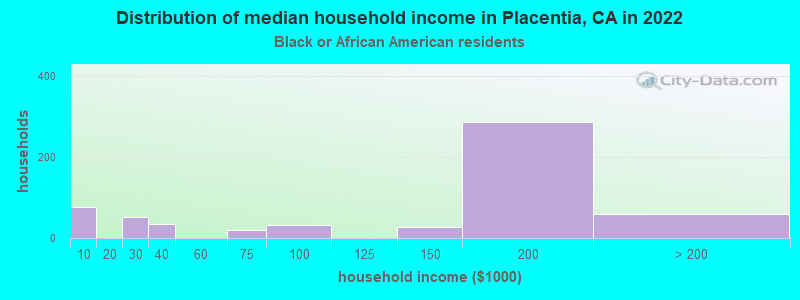
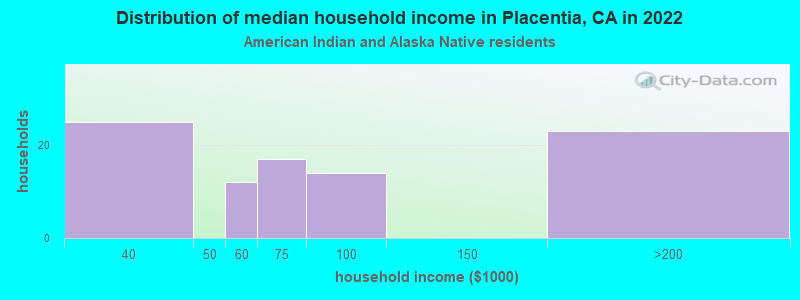
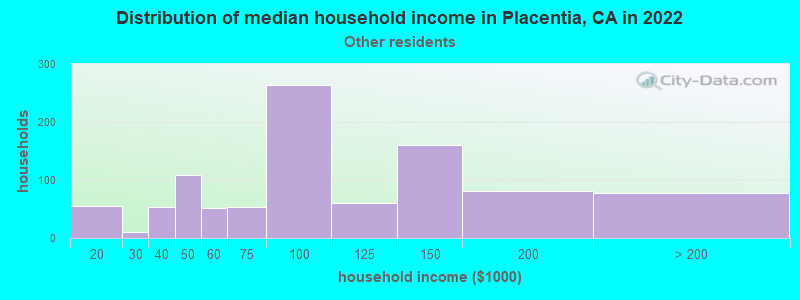
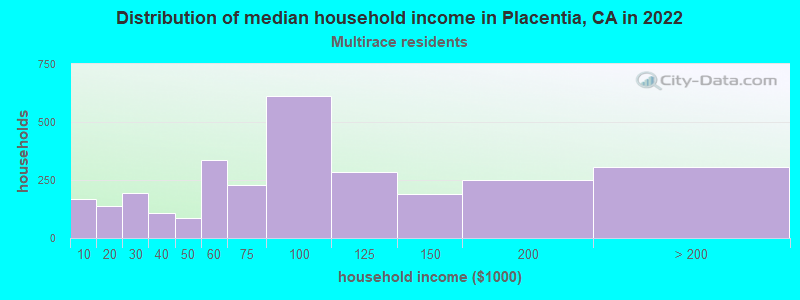
Income and house value in Placentia Median household income in 2022 $127,199 White non-Hispanic householders$129,174 Black householders$117,098 American Indian and Alaska Native householders$164,323 Asian householders$159,515 Native Hawaiian and other Pacific Islander householders$104,643 Some other race householders$131,437 Two or more races householders$95,819 Hispanic or Latino race householdersMedian 2022 house value $963,891 White Non-Hispanic householders$918,540 Black or African American householders$993,765 American Indian or Alaska Native householders $976,848 Asian householders$671,268 Some other race householders$854,832 Two or more races householders$795,804 Hispanic or Latino householders
Median age by race in Placentia
41.4 Median age for White residents40.3 42.9 31.5 Median age for Black or African American residents31.3 29.1 45.2 Median age for American Indian / Alaska Native residents49.9 42.2 41.5 Median age for Asian residents38.7 44.3 35.3 Median age for Native Hawaiian / Pacific Islander residents39.5 8.2 31.4 Median age for Other race residents31.4 30.4 23.9 Median age for Two or more races residents21.5 28.9 47.4 Median age for White alone residents46.0 48.4 32.1 Median age for Hispanic or Latino residents31.6 32.0
Owner/renter occupied households by race in Placentia
House owners and renters - White residents 6,950 65.1% Owner occupied3,728 34.9% Renter occupiedHouse owners and renters - Black or African American residents 114 33.5% Owner occupied226 66.5% Renter occupiedHouse owners and renters - American Indian / Alaska Native residents 73 77.0% Owner occupied22 23.0% Renter occupiedHouse owners and renters - Asian residents 2,601 83.6% Owner occupied511 16.4% Renter occupiedHouse owners and renters - Other race residents 351 43.8% Owner occupied450 56.2% Renter occupiedHouse owners and renters - Two or more races residents 821 67.3% Owner occupied399 32.7% Renter occupiedHouse owners and renters - White alone residents 5,615 71.0% Owner occupied2,290 29.0% Renter occupiedHouse owners and renters - Hispanic or Latino residents 2,620 49.8% Owner occupied2,639 50.2% Renter occupied
Language usage in Placentia
English speakers - Total 62.7% of residents of Placentia speak English at home.
23.0% of residents speak Spanish at home 7,385 65.4% Speak English very well3,905 34.6% Speak English less than very well14.5% of residents speak other language at home 4,202 59.0% Speak English very well2,915 41.0% Speak English less than very well
English speakers - Born in the United States 93.2% of residents of Placentia speak English at home.
3.2% of residents speak Spanish at home 146 74.9% Speak English very well49 25.1% Speak English less than very well3.5% of residents speak other language at home 213 100.0% Speak English very well
English speakers - Native, born elsewhere 52.5% of residents of Placentia speak English at home.
35.1% of residents speak Spanish at home 184 100.0% Speak English very well12.8% of residents speak other language at home 39 58.2% Speak English very well28 41.8% Speak English less than very well
English speakers - Foreign-born 14.3% of residents of Placentia speak English at home.
41.1% of residents speak Spanish at home 1,855 36.0% Speak English very well3,293 64.0% Speak English less than very well45.2% of residents speak other language at home 3,038 53.7% Speak English very well2,616 46.3% Speak English less than very well
White (Caucasian) - Speak only English Native:
86.2% (20,834)Foreign-born:
17.0% (633)
White (Caucasian) - Speak another language Native:
14.3% (3,455)Foreign-born:
82.6% (3,077)
Black or African American - Speak only English Native:
96.8% (803)Foreign-born:
23.4% (25)
Black or African American - Speak another language Native:
3.1% (26)Foreign-born:
79.0% (83)
American Indian / Alaska Native - Speak only English Native:
53.6% (178)Foreign-born:
26.5% (23)
American Indian / Alaska Native - Speak another language Native:
50.4% (167)Foreign-born:
71.3% (62)
Asian - Speak only English Native:
67.3% (2,463)Foreign-born:
14.8% (824)
Asian - Speak another language Native:
33.0% (1,207)Foreign-born:
85.2% (4,733)
Native Hawaiian / Pacific Islander - Speak another language Native:
7.6% (10)Foreign-born:
96.4% (2)
Other race - Speak only English Native:
49.1% (931)Foreign-born:
8.9% (107)
Other race - Speak another language Native:
51.8% (983)Foreign-born:
92.4% (1,117)
Two or more races - Speak only English Native:
66.0% (2,513)Foreign-born:
11.9% (58)
Two or more races - Speak another language Native:
28.2% (1,073)Foreign-born:
84.8% (413)
White alone - Speak only English Native:
96.2% (16,176)Foreign-born:
29.1% (406)
White alone - Speak another language Native:
3.6% (608)Foreign-born:
71.3% (997)
Hispanic or Latino - Speak only English Native:
55.8% (7,987)Foreign-born:
9.6% (508)
Hispanic or Latino - Speak another language Native:
44.0% (6,294)Foreign-born:
91.8% (4,873)
Foreign-born residents in Placentia 12,816 residents are foreign born (11.3% Latin America , 10.9% Asia ).
This city:
24.6%California:
100.0%
Marital status for residents in Placentia Marital status - White (Caucasian) population 15 years and over
Males 35.8% Never married52.1% Now married1.5% Separated3.4% Widowed7.2% DivorcedFemales 31.5% Never married46.7% Now married2.5% Separated8.7% Widowed10.6% DivorcedWomen who gave birth in the past 12 months Now married:
64.5% (251)Unmarried:
35.5% (138)
Women who did not give birth in the past 12 months Now married:
43.4% (2,784)Unmarried:
56.6% (3,637)
Marital status - Black or African American population 15 years and over
Males 53.0% Never married37.3% Now married0.0% Separated0.0% Widowed9.7% DivorcedFemales 64.7% Never married25.8% Now married0.0% Separated1.8% Widowed7.8% DivorcedWomen who did not give birth in the past 12 months Now married:
7.3% (20)Unmarried:
92.7% (252)
Marital status - American Indian / Alaska Native population 15 years and over
Males 34.8% Never married28.4% Now married0.0% Separated16.9% Widowed19.9% DivorcedFemales 55.1% Never married24.4% Now married15.0% Separated0.0% Widowed5.5% DivorcedWomen who gave birth in the past 12 months Now married:
0.0% (0)Unmarried:
100.0% (25)
Women who did not give birth in the past 12 months Now married:
35.2% (25)Unmarried:
64.8% (47)
Marital status - Asian population 15 years and over
Males 32.1% Never married63.5% Now married0.0% Separated2.0% Widowed2.4% DivorcedFemales 17.5% Never married65.1% Now married0.8% Separated8.3% Widowed8.4% DivorcedWomen who gave birth in the past 12 months Now married:
100.0% (127)Unmarried:
0.0% (0)
Women who did not give birth in the past 12 months Now married:
56.0% (1,136)Unmarried:
44.0% (894)
Marital status - Native Hawaiian / Pacific Islander population 15 years and over
Males 38.5% Never married61.5% Now married0.0% Separated0.0% Widowed0.0% DivorcedFemales 0.0% Never married86.7% Now married0.0% Separated13.3% Widowed0.0% DivorcedMarital status - Other race population 15 years and over
Males 28.9% Never married63.1% Now married0.0% Separated0.0% Widowed8.0% DivorcedFemales 41.7% Never married40.3% Now married4.0% Separated2.9% Widowed11.1% DivorcedWomen who gave birth in the past 12 months Now married:
88.6% (38)Unmarried:
11.4% (5)
Women who did not give birth in the past 12 months Now married:
41.4% (456)Unmarried:
58.6% (646)
Marital status - Two or more races population 15 years and over
Males 42.9% Never married48.8% Now married0.0% Separated1.4% Widowed7.0% DivorcedFemales 38.1% Never married45.3% Now married0.0% Separated5.0% Widowed11.5% DivorcedWomen who gave birth in the past 12 months Now married:
100.0% (96)Unmarried:
0.0% (0)
Women who did not give birth in the past 12 months Now married:
38.3% (467)Unmarried:
61.7% (753)
Marital status - White alone, not Hispanic / Latino population 15 years and over
Males 28.6% Never married57.1% Now married1.9% Separated3.9% Widowed8.5% DivorcedFemales 26.1% Never married49.2% Now married1.2% Separated10.3% Widowed13.2% DivorcedWomen who gave birth in the past 12 months Now married:
71.8% (197)Unmarried:
28.2% (77)
Women who did not give birth in the past 12 months Now married:
43.5% (1,698)Unmarried:
56.5% (2,204)
Marital status - Hispanic or Latino population 15 years and over
Males 44.2% Never married46.3% Now married0.7% Separated2.8% Widowed6.0% DivorcedFemales 40.0% Never married42.1% Now married4.7% Separated5.6% Widowed7.6% DivorcedWomen who gave birth in the past 12 months Now married:
54.7% (147)Unmarried:
45.3% (122)
Women who did not give birth in the past 12 months Now married:
42.7% (2,259)Unmarried:
57.3% (3,027)
Ancestries in Placentia
1,924 6.4% American1,248 4.2% German876 2.9% European762 2.5% English717 2.4% Irish566 1.9% Italian246 0.8% Romanian216 0.7% Polish157 0.5% Iranian147 0.5% Norwegian139 0.5% French138 0.5% Russian128 0.4% Eastern European123 0.4% French Canadian101 0.3% Northern European96 0.3% Lebanese92 0.3% Dutch83 0.3% Ethiopian80 0.3% Egyptian77 0.3% British70 0.2% Scottish69 0.2% Swedish62 0.2% Scotch-Irish61 0.2% Syrian59 0.2% Danish42 0.1% Croatian38 0.1% Portuguese35 0.1% Canadian31 0.1% Hungarian29 0.10% Scandinavian29 0.10% Israeli28 0.09% Ukrainian27 0.09% Arab25 0.08% Ugandan24 0.08% Nigerian23 0.08% Palestinian20 0.07% Bulgarian19 0.06% Lithuanian15 0.05% Assyrian15 0.05% Jamaican12 0.04% Greek11 0.04% Brazilian10 0.03% Slavic8 0.03% Czech7 0.02% Slovak6 0.02% Armenian6 0.02% Slovene6 0.02% African5 0.02% Latvian5 0.02% Yugoslavian4 0.01% Basque
Geographical mobility in Placentia Same house 1 year ago 25,959 90.2% White (Caucasian)758 75.7% Black or African American515 95.1% American Indian / Alaska Native8,574 90.3% Asian128 89.3% Native Hawaiian / Pacific Islander3,073 99.8% Other race4,897 96.6% Two or more races17,150 89.8% White alone, not Hispanic / Latino19,197 93.6% Hispanic or LatinoMoved within same county 2,112 7.3% White / Caucasian16 1.6% Black or African American16 3.0% American Indian / Alaska Native661 7.0% Asian2 1.3% Native Hawaiian / Pacific Islander37 1.2% Other race230 4.5% Two or more races1,477 7.7% White alone, not Hispanic / Latino958 4.7% Hispanic or LatinoMoved within same state 505 1.8% White / Caucasian238 23.8% Black or African American202 2.1% Asian14 9.9% Native Hawaiian / Pacific Islander31 1.0% Other race47 0.9% Two or more races343 1.8% White alone, not Hispanic / Latino302 1.5% Hispanic or LatinoMoved from different state 190 0.7% White / Caucasian4 0.4% Black or African American9 1.6% American Indian / Alaska Native107 1.1% Asian33 0.6% Two or more races136 0.7% White alone, not Hispanic / Latino115 0.6% Hispanic or LatinoMoved from abroad 23 0.1% White7 0.7% Black or African American19 0.2% Asian14 0.1% White alone, not Hispanic / Latino27 0.1% Hispanic or Latino
Children Nativity (place of birth) in Placentia
Children under 6 years - Living with two parents Both parents native 1,426 100.0% NativeBoth parents foreign-born 631 99.6% Native2 0.4% Foreign-bornOne native, one foreign-born parent 530 100.0% NativeChildren under 6 years - Living with one parent Native parent 500 100.0% Native0 0.0% Foreign-bornForeign-born parent 133 91.5% Native12 8.5% Foreign-bornChildren 6 to 17 years - Living with two parents Both parents native 2,477 98.3% Native43 1.7% Foreign-bornBoth parents foreign-born 1,663 85.1% Native291 14.9% Foreign-bornOne native, one foreign-born parent 1,351 98.1% Native26 1.9% Foreign-bornChildren 6 to 17 years - Living with one parent Native parent 1,339 100.0% NativeForeign-born parent 908 50.9% Native876 49.1% Foreign-born
Grandparents responsible for own grandchildren in Placentia
Grandparents (30 to 59 years) White / Caucasian 25 12.7% Responsible for grandchildren174 87.3% Not responsible for grandchildrenAmerican Indian / Alaska Native 13 100.0% Responsible for grandchildrenAsian 22 100.0% Not responsible for grandchildrenOther race 7 16.9% Responsible for grandchildren37 83.1% Not responsible for grandchildrenWhite alone, not Hispanic / Latino 8 14.1% Responsible for grandchildren46 85.9% Not responsible for grandchildrenHispanic or Latino 50 17.2% Responsible for grandchildren240 82.8% Not responsible for grandchildrenGrandparents (60 years and over) White / Caucasian 35 8.8% Responsible for grandchildren363 91.2% Not responsible for grandchildrenAmerican Indian / Alaska Native 37 100.0% Not responsible for grandchildrenAsian 8 2.9% Responsible for grandchildren259 97.1% Not responsible for grandchildrenOther race 41 41.5% Responsible for grandchildren58 58.5% Not responsible for grandchildrenWhite alone, not Hispanic / Latino 43 14.1% Responsible for grandchildren262 85.9% Not responsible for grandchildrenHispanic or Latino 27 7.6% Responsible for grandchildren330 92.4% Not responsible for grandchildren