Races in Point Pleasant, New Jersey (NJ) Detailed Stats
Data:
Races - White alone (%)
Races - White alone (% change since 2000)
Races - Black alone (%)
Races - Black alone (% change since 2000)
Races - American Indian alone (%)
Races - American Indian alone (% change since 2000)
Races - Asian alone (%)
Races - Asian alone (% change since 2000)
Races - Hispanic (%)
Races - Hispanic (% change since 2000)
Races - Native Hawaiian and Other Pacific Islander alone (%)
Races - Native Hawaiian and Other Pacific Islander alone (% change since 2000)
Races - Two or more races(%)
Races - Two or more races(% change since 2000)
Races - Other race alone (%)
Races - Other race alone (% change since 2000)
Racial diversity
Place of birth - Born in state of residence (%)
Place of birth - Born in state of residence (%) - White
Place of birth - Born in state of residence (%) - Black or African American
Place of birth - Born in state of residence (%) - Asian
Place of birth - Born in state of residence (%) - Hispanic or Latino
Place of birth - Born in state of residence (%) - American Indian and Alaska Native
Place of birth - Born in state of residence (%) - Multirace
Place of birth - Born in state of residence (%) - Other Race
Place of birth - Born in other state (%)
Place of birth - Born in other state (%) - White
Place of birth - Born in other state (%) - Black or African American
Place of birth - Born in other state (%) - Asian
Place of birth - Born in other state (%) - Hispanic or Latino
Place of birth - Born in other state (%) - American Indian and Alaska Native
Place of birth - Born in other state (%) - Multirace
Place of birth - Born in other state (%) - Other Race
Place of birth - Native, outside of US (%)
Place of birth - Native, outside of US (%) - White
Place of birth - Native, outside of US (%) - Black or African American
Place of birth - Native, outside of US (%) - Asian
Place of birth - Native, outside of US (%) - Hispanic or Latino
Place of birth - Native, outside of US (%) - American Indian and Alaska Native
Place of birth - Native, outside of US (%) - Multirace
Place of birth - Native, outside of US (%) - Other Race
Place of birth - Foreign born (%)
Place of birth - Foreign born (%) - White
Place of birth - Foreign born (%) - Black or African American
Place of birth - Foreign born (%) - Asian
Place of birth - Foreign born (%) - Hispanic or Latino
Place of birth - Foreign born (%) - American Indian and Alaska Native
Place of birth - Foreign born (%) - Multirace
Place of birth - Foreign born (%) - Other Race
Residents speaking English at home (%)
Residents speaking English at home - Born in the United States (%)
Residents speaking English at home - Native, born elsewhere (%)
Residents speaking English at home - Foreign born (%)
Residents speaking Spanish at home (%)
Residents speaking Spanish at home - Born in the United States (%)
Residents speaking Spanish at home - Native, born elsewhere (%)
Residents speaking Spanish at home - Foreign born (%)
Residents speaking other language at home (%)
Residents speaking other language at home - Born in the United States (%)
Residents speaking other language at home - Native, born elsewhere (%)
Residents speaking other language at home - Foreign born (%)
Marital status - Never married (%)
Marital status - Now married (%)
Marital status - Separated (%)
Marital status - Widowed (%)
Marital status - Divorced (%)
Ancestries Reported - Arab (%)
Ancestries Reported - Czech (%)
Ancestries Reported - Danish (%)
Ancestries Reported - Dutch (%)
Ancestries Reported - English (%)
Ancestries Reported - French (%)
Ancestries Reported - French Canadian (%)
Ancestries Reported - German (%)
Ancestries Reported - Greek (%)
Ancestries Reported - Hungarian (%)
Ancestries Reported - Irish (%)
Ancestries Reported - Italian (%)
Ancestries Reported - Lithuanian (%)
Ancestries Reported - Norwegian (%)
Ancestries Reported - Polish (%)
Ancestries Reported - Portuguese (%)
Ancestries Reported - Russian (%)
Ancestries Reported - Scotch-Irish (%)
Ancestries Reported - Scottish (%)
Ancestries Reported - Slovak (%)
Ancestries Reported - Subsaharan African (%)
Ancestries Reported - Swedish (%)
Ancestries Reported - Swiss (%)
Ancestries Reported - Ukrainian (%)
Ancestries Reported - United States (%)
Ancestries Reported - Welsh (%)
Ancestries Reported - West Indian (%)
Ancestries Reported - Other (%)
Geographical mobility - Same house 1 year ago (%)
Geographical mobility - Same house 1 year ago (%) - White
Geographical mobility - Same house 1 year ago (%) - Black or African American
Geographical mobility - Same house 1 year ago (%) - Asian
Geographical mobility - Same house 1 year ago (%) - Hispanic or Latino
Geographical mobility - Same house 1 year ago (%) - American Indian and Alaska Native
Geographical mobility - Same house 1 year ago (%) - Multirace
Geographical mobility - Same house 1 year ago (%) - Other Race
Geographical mobility - Moved within same county (%)
Geographical mobility - Moved within same county (%) - White
Geographical mobility - Moved within same county (%) - Black or African American
Geographical mobility - Moved within same county (%) - Asian
Geographical mobility - Moved within same county (%) - Hispanic or Latino
Geographical mobility - Moved within same county (%) - American Indian and Alaska Native
Geographical mobility - Moved within same county (%) - Multirace
Geographical mobility - Moved within same county (%) - Other Race
Geographical mobility - Moved from different county within same state (%)
Geographical mobility - Moved from different county within same state (%) - White
Geographical mobility - Moved from different county within same state (%) - Black or African American
Geographical mobility - Moved from different county within same state (%) - Asian
Geographical mobility - Moved from different county within same state (%) - Hispanic or Latino
Geographical mobility - Moved from different county within same state (%) - American Indian and Alaska Native
Geographical mobility - Moved from different county within same state (%) - Multirace
Geographical mobility - Moved from different county within same state (%) - Other Race
Geographical mobility - Moved from different state (%)
Geographical mobility - Moved from different state (%) - White
Geographical mobility - Moved from different state (%) - Black or African American
Geographical mobility - Moved from different state (%) - Asian
Geographical mobility - Moved from different state (%) - Hispanic or Latino
Geographical mobility - Moved from different state (%) - American Indian and Alaska Native
Geographical mobility - Moved from different state (%) - Multirace
Geographical mobility - Moved from different state (%) - Other Race
Geographical mobility - Moved from abroad (%)
Geographical mobility - Moved from abroad (%) - White
Geographical mobility - Moved from abroad (%) - Black or African American
Geographical mobility - Moved from abroad (%) - Asian
Geographical mobility - Moved from abroad (%) - Hispanic or Latino
Geographical mobility - Moved from abroad (%) - American Indian and Alaska Native
Geographical mobility - Moved from abroad (%) - Multirace
Geographical mobility - Moved from abroad (%) - Other Race
Place of birth for the foreign-born population - Ireland (%)
Place of birth for the foreign-born population - Denmark (%)
Place of birth for the foreign-born population - Norway (%)
Place of birth for the foreign-born population - Sweden (%)
Place of birth for the foreign-born population - United Kingdom (%)
Place of birth for the foreign-born population - England (%)
Place of birth for the foreign-born population - Scotland (%)
Place of birth for the foreign-born population - Other Northern Europe (%)
Place of birth for the foreign-born population - Austria (%)
Place of birth for the foreign-born population - Belgium (%)
Place of birth for the foreign-born population - France (%)
Place of birth for the foreign-born population - Germany (%)
Place of birth for the foreign-born population - Netherlands (%)
Place of birth for the foreign-born population - Switzerland (%)
Place of birth for the foreign-born population - Other Western Europe (%)
Place of birth for the foreign-born population - Greece (%)
Place of birth for the foreign-born population - Italy (%)
Place of birth for the foreign-born population - Portugal (%)
Place of birth for the foreign-born population - Spain (%)
Place of birth for the foreign-born population - Other Southern Europe (%)
Place of birth for the foreign-born population - Albania (%)
Place of birth for the foreign-born population - Belarus (%)
Place of birth for the foreign-born population - Bosnia and Herzegovina (%)
Place of birth for the foreign-born population - Bulgaria (%)
Place of birth for the foreign-born population - Croatia (%)
Place of birth for the foreign-born population - Czechoslovakia (%)
Place of birth for the foreign-born population - Hungary (%)
Place of birth for the foreign-born population - Latvia (%)
Place of birth for the foreign-born population - Lithuania (%)
Place of birth for the foreign-born population - North Macedonia (Macedonia) (%)
Place of birth for the foreign-born population - Moldova (%)
Place of birth for the foreign-born population - Poland (%)
Place of birth for the foreign-born population - Romania (%)
Place of birth for the foreign-born population - Russia (%)
Place of birth for the foreign-born population - Serbia (%)
Place of birth for the foreign-born population - Ukraine (%)
Place of birth for the foreign-born population - Other Eastern Europe (%)
Place of birth for the foreign-born population - China (%)
Place of birth for the foreign-born population - Hong Kong (%)
Place of birth for the foreign-born population - Taiwan (%)
Place of birth for the foreign-born population - Japan (%)
Place of birth for the foreign-born population - Korea (%)
Place of birth for the foreign-born population - Other Eastern Asia (%)
Place of birth for the foreign-born population - Afghanistan (%)
Place of birth for the foreign-born population - Bangladesh (%)
Place of birth for the foreign-born population - India (%)
Place of birth for the foreign-born population - Iran (%)
Place of birth for the foreign-born population - Kazakhstan (%)
Place of birth for the foreign-born population - Nepal (%)
Place of birth for the foreign-born population - Pakistan (%)
Place of birth for the foreign-born population - Sri Lanka (%)
Place of birth for the foreign-born population - Uzbekistan (%)
Place of birth for the foreign-born population - Other South Central Asia (%)
Place of birth for the foreign-born population - Burma (%)
Place of birth for the foreign-born population - Cambodia (%)
Place of birth for the foreign-born population - Indonesia (%)
Place of birth for the foreign-born population - Laos (%)
Place of birth for the foreign-born population - Malaysia (%)
Place of birth for the foreign-born population - Philippines (%)
Place of birth for the foreign-born population - Singapore (%)
Place of birth for the foreign-born population - Thailand (%)
Place of birth for the foreign-born population - Vietnam (%)
Place of birth for the foreign-born population - Other South Eastern Asia (%)
Place of birth for the foreign-born population - Armenia (%)
Place of birth for the foreign-born population - Iraq (%)
Place of birth for the foreign-born population - Israel (%)
Place of birth for the foreign-born population - Jordan (%)
Place of birth for the foreign-born population - Kuwait (%)
Place of birth for the foreign-born population - Lebanon (%)
Place of birth for the foreign-born population - Saudi Arabia (%)
Place of birth for the foreign-born population - Syria (%)
Place of birth for the foreign-born population - Turkey (%)
Place of birth for the foreign-born population - Yemen (%)
Place of birth for the foreign-born population - Other Western Asia (%)
Place of birth for the foreign-born population - Eritrea (%)
Place of birth for the foreign-born population - Ethiopia (%)
Place of birth for the foreign-born population - Kenya (%)
Place of birth for the foreign-born population - Somalia (%)
Place of birth for the foreign-born population - Uganda (%)
Place of birth for the foreign-born population - Zimbabwe (%)
Place of birth for the foreign-born population - Other Eastern Africa (%)
Place of birth for the foreign-born population - Cameroon (%)
Place of birth for the foreign-born population - Congo (%)
Place of birth for the foreign-born population - Democratic Republic of Congo (Zaire) (%)
Place of birth for the foreign-born population - Other Middle Africa (%)
Place of birth for the foreign-born population - Egypt (%)
Place of birth for the foreign-born population - Morocco (%)
Place of birth for the foreign-born population - Sudan (%)
Place of birth for the foreign-born population - Other Northern Africa (%)
Place of birth for the foreign-born population - South Africa (%)
Place of birth for the foreign-born population - Other Southern Africa (%)
Place of birth for the foreign-born population - Cabo Verde (%)
Place of birth for the foreign-born population - Ghana (%)
Place of birth for the foreign-born population - Liberia (%)
Place of birth for the foreign-born population - Nigeria (%)
Place of birth for the foreign-born population - Senegal (%)
Place of birth for the foreign-born population - Sierra Leone (%)
Place of birth for the foreign-born population - Other Western Africa (%)
Place of birth for the foreign-born population - Australia (%)
Place of birth for the foreign-born population - New Zealand (%)
Place of birth for the foreign-born population - Fiji (%)
Place of birth for the foreign-born population - Micronesia (%)
Place of birth for the foreign-born population - Bahamas (%)
Place of birth for the foreign-born population - Barbados (%)
Place of birth for the foreign-born population - Cuba (%)
Place of birth for the foreign-born population - Dominica (%)
Place of birth for the foreign-born population - Dominican Republic (%)
Place of birth for the foreign-born population - Grenada (%)
Place of birth for the foreign-born population - Haiti (%)
Place of birth for the foreign-born population - Jamaica (%)
Place of birth for the foreign-born population - St. Vincent and the Grenadines (%)
Place of birth for the foreign-born population - Trinidad and Tobago (%)
Place of birth for the foreign-born population - West Indies (%)
Place of birth for the foreign-born population - Other Caribbean (%)
Place of birth for the foreign-born population - Belize (%)
Place of birth for the foreign-born population - Costa Rica (%)
Place of birth for the foreign-born population - El Salvador (%)
Place of birth for the foreign-born population - Guatemala (%)
Place of birth for the foreign-born population - Honduras (%)
Place of birth for the foreign-born population - Mexico (%)
Place of birth for the foreign-born population - Nicaragua (%)
Place of birth for the foreign-born population - Panama (%)
Place of birth for the foreign-born population - Other Central America (%)
Place of birth for the foreign-born population - Argentina (%)
Place of birth for the foreign-born population - Bolivia (%)
Place of birth for the foreign-born population - Brazil (%)
Place of birth for the foreign-born population - Chile (%)
Place of birth for the foreign-born population - Colombia (%)
Place of birth for the foreign-born population - Ecuador (%)
Place of birth for the foreign-born population - Guyana (%)
Place of birth for the foreign-born population - Peru (%)
Place of birth for the foreign-born population - Uruguay (%)
Place of birth for the foreign-born population - Venezuela (%)
Place of birth for the foreign-born population - Other South America (%)
Place of birth for the foreign-born population - Canada (%)
Place of birth for the foreign-born population - Other Northern America (%)
Place of birth for the foreign-born population - Other (%)
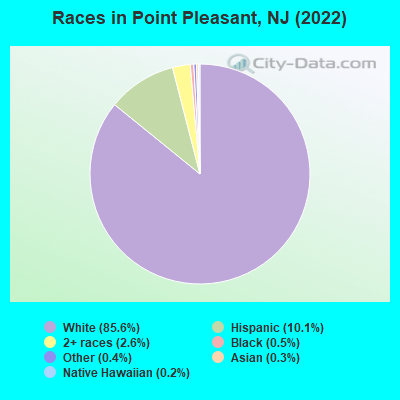
According to 2022 data, the most numerous races in Point Pleasant, NJ are White alone (16,720 residents), Hispanic (1,968 residents), and Black alone (89 residents). 90.0% of Point Pleasant residents speak English at home. 6.4% of Point Pleasant, NJ residents are foreign-born (4.6% born in Latin America, 1.3% born in Europe), which is 258.8% less than the foreign-born rate of 23.0% across the entire state of New Jersey.
Race distribution in Point Pleasant
2000 2022
5,557,209 66.0% White alone 1,117,191 13.3% Hispanic 1,096,171 13.0% Black alone 477,012 5.7% Asian alone 133,689 1.6% Two or more races 19,565 0.2% Other race alone 11,338 0.1% American Indian alone 2,175 0.03% Native Hawaiian and Other
4,766,476 51.5% White alone 2,028,470 21.9% Hispanic 1,111,632 12.0% Black alone 923,546 10.0% Asian alone 332,237 3.6% Two or more races 89,847 1.0% Other race alone 8,557 0.09% American Indian alone 934 0.01% Native Hawaiian and Other
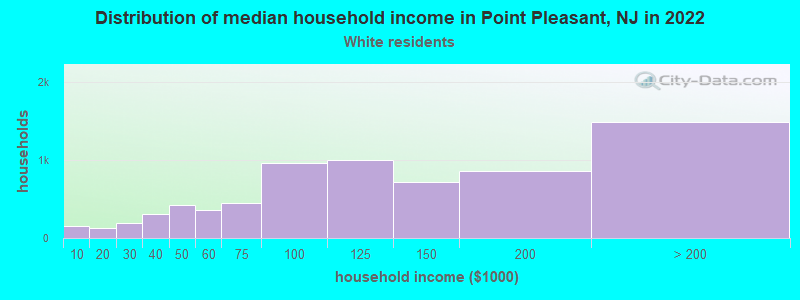
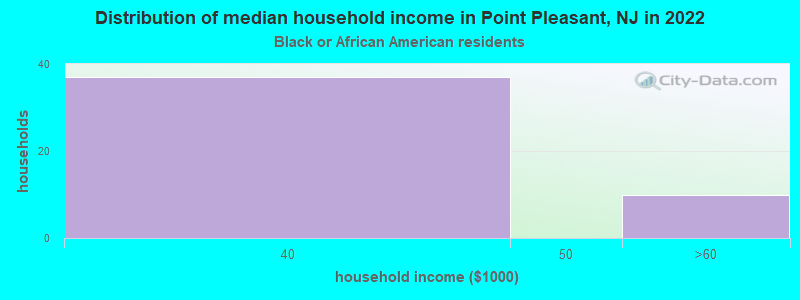
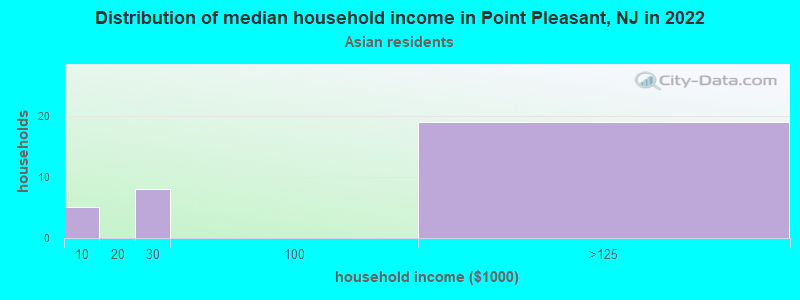
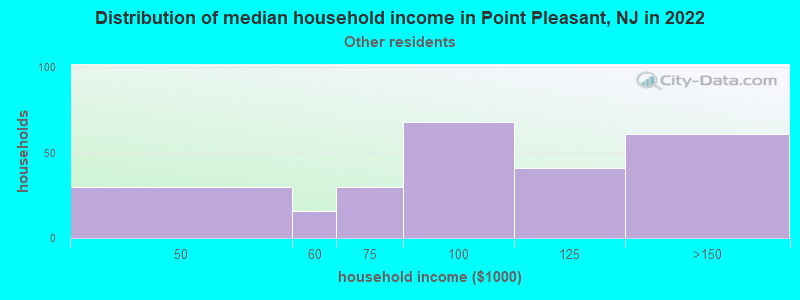
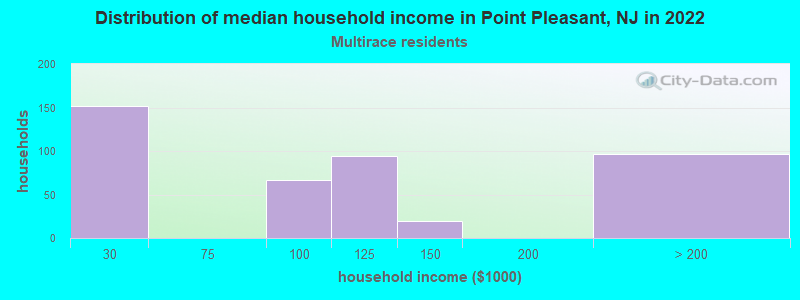
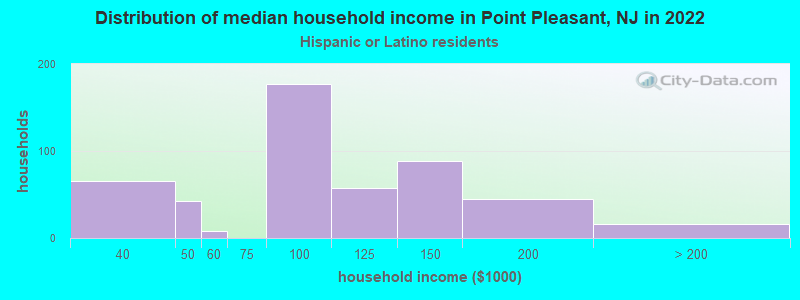
Income and house value in Point Pleasant Median household income in 2022 $106,015 White non-Hispanic householders$101,269 Some other race householders$88,134 Two or more races householders$93,206 Hispanic or Latino race householdersMedian 2022 house value $527,713 White Non-Hispanic householders$312,159 Black or African American householders$451,809 American Indian or Alaska Native householders$369,662 Some other race householders$487,954 Two or more races householders$503,069 Hispanic or Latino householders
Median age by race in Point Pleasant
45.8 Median age for White residents45.1 46.3 34.4 Median age for Black or African American residents33.3 62.1 -669,774,669.1 Median age for American Indian / Alaska Native residents-531,446,540.3 -678,185,744.5 70.3 Median age for Asian residents30.1 75.9 -804,177,544.9 Median age for Native Hawaiian / Pacific Islander residents-860,335,194.7 -713,070,378.3 29.2 Median age for Other race residents31.9 29.2 38.9 Median age for Two or more races residents41.1 38.0 46.1 Median age for White alone residents45.8 46.6 30.0 Median age for Hispanic or Latino residents34.2 26.4
Owner/renter occupied households by race in Point Pleasant
House owners and renters - White residents 6,075 85.8% Owner occupied1,003 14.2% Renter occupiedHouse owners and renters - Black or African American residents 63 100.0% Renter occupiedHouse owners and renters - Asian residents 10 48.6% Owner occupied11 51.4% Renter occupiedHouse owners and renters - Other race residents 96 33.7% Owner occupied189 66.3% Renter occupiedHouse owners and renters - Two or more races residents 154 41.1% Owner occupied221 58.9% Renter occupiedHouse owners and renters - White alone residents 6,009 85.7% Owner occupied1,005 14.3% Renter occupiedHouse owners and renters - Hispanic or Latino residents 241 53.0% Owner occupied214 47.0% Renter occupied
Language usage in Point Pleasant
English speakers - Total 90.0% of residents of Point Pleasant speak English at home.
7.8% of residents speak Spanish at home 742 51.0% Speak English very well713 49.0% Speak English less than very well2.7% of residents speak other language at home 379 74.5% Speak English very well130 25.5% Speak English less than very well
English speakers - Born in the United States 97.2% of residents of Point Pleasant speak English at home.
1.0% of residents speak Spanish at home 36 100.0% Speak English very well1.7% of residents speak other language at home 63 100.0% Speak English very well
English speakers - Native, born elsewhere 48.4% of residents of Point Pleasant speak English at home.
62.9% of residents speak Spanish at home 39 100.0% Speak English very well
English speakers - Foreign-born 14.9% of residents of Point Pleasant speak English at home.
65.5% of residents speak Spanish at home 211 25.9% Speak English very well604 74.1% Speak English less than very well21.5% of residents speak other language at home 134 50.2% Speak English very well133 49.8% Speak English less than very well
White (Caucasian) - Speak only English Native:
97.0% (15,547)Foreign-born:
23.6% (89)
White (Caucasian) - Speak another language Native:
3.2% (518)Foreign-born:
72.1% (272)
Black or African American - Speak only English Native:
100.0% (67)Foreign-born:
63.4% (12)
Asian - Speak only English Native:
100.0% (12)Foreign-born:
11.1% (5)
Other race - Speak another language Native:
33.7% (73)Foreign-born:
96.9% (422)
Two or more races - Speak only English Native:
83.3% (794)Foreign-born:
7.8% (39)
Two or more races - Speak another language Native:
13.1% (125)Foreign-born:
91.7% (452)
White alone - Speak only English Native:
97.2% (15,385)Foreign-born:
33.1% (86)
White alone - Speak another language Native:
2.9% (452)Foreign-born:
66.3% (173)
Hispanic or Latino - Speak only English Native:
65.9% (644)Foreign-born:
11.1% (98)
Hispanic or Latino - Speak another language Native:
33.0% (323)Foreign-born:
88.9% (783)
Foreign-born residents in Point Pleasant 1,252 residents are foreign born (4.6% Latin America , 1.3% Europe ).
This city:
6.4%New Jersey:
23.2%
Marital status for residents in Point Pleasant Marital status - White (Caucasian) population 15 years and over
Males 29.3% Never married58.9% Now married0.8% Separated1.6% Widowed9.4% DivorcedFemales 25.8% Never married52.7% Now married0.8% Separated6.3% Widowed14.4% DivorcedWomen who gave birth in the past 12 months Now married:
92.2% (147)Unmarried:
7.8% (12)
Women who did not give birth in the past 12 months Now married:
45.7% (1,589)Unmarried:
54.3% (1,884)
Marital status - Black or African American population 15 years and over
Males 59.7% Never married40.3% Now married0.0% Separated0.0% Widowed0.0% DivorcedFemales 0.0% Never married65.2% Now married0.0% Separated34.8% Widowed0.0% DivorcedMarital status - Asian population 15 years and over
Males 59.3% Never married40.7% Now married0.0% Separated0.0% Widowed0.0% DivorcedFemales 40.0% Never married32.5% Now married0.0% Separated17.5% Widowed10.0% DivorcedWomen who did not give birth in the past 12 months Now married:
0.0% (0)Unmarried:
100.0% (4)
Marital status - Other race population 15 years and over
Males 41.9% Never married51.9% Now married0.0% Separated0.0% Widowed6.3% DivorcedFemales 14.6% Never married66.7% Now married0.0% Separated0.0% Widowed18.7% DivorcedWomen who gave birth in the past 12 months Now married:
100.0% (51)Unmarried:
0.0% (0)
Women who did not give birth in the past 12 months Now married:
54.4% (76)Unmarried:
45.6% (64)
Marital status - Two or more races population 15 years and over
Males 54.8% Never married41.6% Now married0.0% Separated0.0% Widowed3.5% DivorcedFemales 27.8% Never married53.0% Now married0.0% Separated11.3% Widowed7.9% DivorcedWomen who did not give birth in the past 12 months Now married:
52.5% (164)Unmarried:
47.5% (148)
Marital status - White alone, not Hispanic / Latino population 15 years and over
Males 28.0% Never married59.7% Now married0.9% Separated1.6% Widowed9.7% DivorcedFemales 25.2% Never married53.4% Now married0.8% Separated6.4% Widowed14.2% DivorcedWomen who gave birth in the past 12 months Now married:
92.2% (154)Unmarried:
7.8% (13)
Women who did not give birth in the past 12 months Now married:
46.8% (1,635)Unmarried:
53.2% (1,860)
Marital status - Hispanic or Latino population 15 years and over
Males 46.0% Never married51.4% Now married0.0% Separated0.0% Widowed2.6% DivorcedFemales 39.4% Never married46.9% Now married0.0% Separated3.5% Widowed10.2% DivorcedWomen who gave birth in the past 12 months Now married:
100.0% (35)Unmarried:
0.0% (0)
Women who did not give birth in the past 12 months Now married:
39.2% (143)Unmarried:
60.8% (223)
Ancestries in Point Pleasant
1,528 20.7% Italian1,477 20.0% Irish765 10.4% American572 7.7% German462 6.3% Polish227 3.1% English154 2.1% European151 2.0% Russian106 1.4% Norwegian105 1.4% Scottish84 1.1% Hungarian51 0.7% Scotch-Irish45 0.6% Lithuanian41 0.6% Dutch34 0.5% Northern European30 0.4% Welsh28 0.4% Ukrainian26 0.4% Moroccan26 0.4% Greek25 0.3% Egyptian24 0.3% Eastern European16 0.2% Syrian16 0.2% Portuguese15 0.2% Austrian15 0.2% Slovak14 0.2% Lebanese14 0.2% Brazilian14 0.2% French13 0.2% Scandinavian13 0.2% British12 0.2% Armenian11 0.1% Czechoslovakian6 0.08% African5 0.07% Swedish3 0.04% Swiss
Children Nativity (place of birth) in Point Pleasant
Children under 6 years - Living with two parents Both parents native 688 100.0% NativeBoth parents foreign-born 49 100.0% NativeOne native, one foreign-born parent 51 100.0% NativeChildren under 6 years - Living with one parent Native parent 98 100.0% NativeChildren 6 to 17 years - Living with two parents Both parents native 1,878 100.0% NativeBoth parents foreign-born 29 100.0% NativeOne native, one foreign-born parent 113 100.0% NativeChildren 6 to 17 years - Living with one parent Native parent 584 100.0% NativeForeign-born parent 143 50.2% Native142 49.8% Foreign-born
Grandparents responsible for own grandchildren in Point Pleasant
Grandparents (30 to 59 years) White / Caucasian 4 100.0% Not responsible for grandchildrenWhite alone, not Hispanic / Latino 5 100.0% Not responsible for grandchildrenGrandparents (60 years and over) White / Caucasian 6 5.8% Responsible for grandchildren97 94.2% Not responsible for grandchildrenWhite alone, not Hispanic / Latino 101 100.0% Not responsible for grandchildren