Races in Port Hueneme, California (CA) Detailed Stats
Data:
Races - White alone (%)
Races - White alone (% change since 2000)
Races - Black alone (%)
Races - Black alone (% change since 2000)
Races - American Indian alone (%)
Races - American Indian alone (% change since 2000)
Races - Asian alone (%)
Races - Asian alone (% change since 2000)
Races - Hispanic (%)
Races - Hispanic (% change since 2000)
Races - Native Hawaiian and Other Pacific Islander alone (%)
Races - Native Hawaiian and Other Pacific Islander alone (% change since 2000)
Races - Two or more races(%)
Races - Two or more races(% change since 2000)
Races - Other race alone (%)
Races - Other race alone (% change since 2000)
Racial diversity
Place of birth - Born in state of residence (%)
Place of birth - Born in state of residence (%) - White
Place of birth - Born in state of residence (%) - Black or African American
Place of birth - Born in state of residence (%) - Asian
Place of birth - Born in state of residence (%) - Hispanic or Latino
Place of birth - Born in state of residence (%) - American Indian and Alaska Native
Place of birth - Born in state of residence (%) - Multirace
Place of birth - Born in state of residence (%) - Other Race
Place of birth - Born in other state (%)
Place of birth - Born in other state (%) - White
Place of birth - Born in other state (%) - Black or African American
Place of birth - Born in other state (%) - Asian
Place of birth - Born in other state (%) - Hispanic or Latino
Place of birth - Born in other state (%) - American Indian and Alaska Native
Place of birth - Born in other state (%) - Multirace
Place of birth - Born in other state (%) - Other Race
Place of birth - Native, outside of US (%)
Place of birth - Native, outside of US (%) - White
Place of birth - Native, outside of US (%) - Black or African American
Place of birth - Native, outside of US (%) - Asian
Place of birth - Native, outside of US (%) - Hispanic or Latino
Place of birth - Native, outside of US (%) - American Indian and Alaska Native
Place of birth - Native, outside of US (%) - Multirace
Place of birth - Native, outside of US (%) - Other Race
Place of birth - Foreign born (%)
Place of birth - Foreign born (%) - White
Place of birth - Foreign born (%) - Black or African American
Place of birth - Foreign born (%) - Asian
Place of birth - Foreign born (%) - Hispanic or Latino
Place of birth - Foreign born (%) - American Indian and Alaska Native
Place of birth - Foreign born (%) - Multirace
Place of birth - Foreign born (%) - Other Race
Residents speaking English at home (%)
Residents speaking English at home - Born in the United States (%)
Residents speaking English at home - Native, born elsewhere (%)
Residents speaking English at home - Foreign born (%)
Residents speaking Spanish at home (%)
Residents speaking Spanish at home - Born in the United States (%)
Residents speaking Spanish at home - Native, born elsewhere (%)
Residents speaking Spanish at home - Foreign born (%)
Residents speaking other language at home (%)
Residents speaking other language at home - Born in the United States (%)
Residents speaking other language at home - Native, born elsewhere (%)
Residents speaking other language at home - Foreign born (%)
Marital status - Never married (%)
Marital status - Now married (%)
Marital status - Separated (%)
Marital status - Widowed (%)
Marital status - Divorced (%)
Ancestries Reported - Arab (%)
Ancestries Reported - Czech (%)
Ancestries Reported - Danish (%)
Ancestries Reported - Dutch (%)
Ancestries Reported - English (%)
Ancestries Reported - French (%)
Ancestries Reported - French Canadian (%)
Ancestries Reported - German (%)
Ancestries Reported - Greek (%)
Ancestries Reported - Hungarian (%)
Ancestries Reported - Irish (%)
Ancestries Reported - Italian (%)
Ancestries Reported - Lithuanian (%)
Ancestries Reported - Norwegian (%)
Ancestries Reported - Polish (%)
Ancestries Reported - Portuguese (%)
Ancestries Reported - Russian (%)
Ancestries Reported - Scotch-Irish (%)
Ancestries Reported - Scottish (%)
Ancestries Reported - Slovak (%)
Ancestries Reported - Subsaharan African (%)
Ancestries Reported - Swedish (%)
Ancestries Reported - Swiss (%)
Ancestries Reported - Ukrainian (%)
Ancestries Reported - United States (%)
Ancestries Reported - Welsh (%)
Ancestries Reported - West Indian (%)
Ancestries Reported - Other (%)
Geographical mobility - Same house 1 year ago (%)
Geographical mobility - Same house 1 year ago (%) - White
Geographical mobility - Same house 1 year ago (%) - Black or African American
Geographical mobility - Same house 1 year ago (%) - Asian
Geographical mobility - Same house 1 year ago (%) - Hispanic or Latino
Geographical mobility - Same house 1 year ago (%) - American Indian and Alaska Native
Geographical mobility - Same house 1 year ago (%) - Multirace
Geographical mobility - Same house 1 year ago (%) - Other Race
Geographical mobility - Moved within same county (%)
Geographical mobility - Moved within same county (%) - White
Geographical mobility - Moved within same county (%) - Black or African American
Geographical mobility - Moved within same county (%) - Asian
Geographical mobility - Moved within same county (%) - Hispanic or Latino
Geographical mobility - Moved within same county (%) - American Indian and Alaska Native
Geographical mobility - Moved within same county (%) - Multirace
Geographical mobility - Moved within same county (%) - Other Race
Geographical mobility - Moved from different county within same state (%)
Geographical mobility - Moved from different county within same state (%) - White
Geographical mobility - Moved from different county within same state (%) - Black or African American
Geographical mobility - Moved from different county within same state (%) - Asian
Geographical mobility - Moved from different county within same state (%) - Hispanic or Latino
Geographical mobility - Moved from different county within same state (%) - American Indian and Alaska Native
Geographical mobility - Moved from different county within same state (%) - Multirace
Geographical mobility - Moved from different county within same state (%) - Other Race
Geographical mobility - Moved from different state (%)
Geographical mobility - Moved from different state (%) - White
Geographical mobility - Moved from different state (%) - Black or African American
Geographical mobility - Moved from different state (%) - Asian
Geographical mobility - Moved from different state (%) - Hispanic or Latino
Geographical mobility - Moved from different state (%) - American Indian and Alaska Native
Geographical mobility - Moved from different state (%) - Multirace
Geographical mobility - Moved from different state (%) - Other Race
Geographical mobility - Moved from abroad (%)
Geographical mobility - Moved from abroad (%) - White
Geographical mobility - Moved from abroad (%) - Black or African American
Geographical mobility - Moved from abroad (%) - Asian
Geographical mobility - Moved from abroad (%) - Hispanic or Latino
Geographical mobility - Moved from abroad (%) - American Indian and Alaska Native
Geographical mobility - Moved from abroad (%) - Multirace
Geographical mobility - Moved from abroad (%) - Other Race
Place of birth for the foreign-born population - Ireland (%)
Place of birth for the foreign-born population - Denmark (%)
Place of birth for the foreign-born population - Norway (%)
Place of birth for the foreign-born population - Sweden (%)
Place of birth for the foreign-born population - United Kingdom (%)
Place of birth for the foreign-born population - England (%)
Place of birth for the foreign-born population - Scotland (%)
Place of birth for the foreign-born population - Other Northern Europe (%)
Place of birth for the foreign-born population - Austria (%)
Place of birth for the foreign-born population - Belgium (%)
Place of birth for the foreign-born population - France (%)
Place of birth for the foreign-born population - Germany (%)
Place of birth for the foreign-born population - Netherlands (%)
Place of birth for the foreign-born population - Switzerland (%)
Place of birth for the foreign-born population - Other Western Europe (%)
Place of birth for the foreign-born population - Greece (%)
Place of birth for the foreign-born population - Italy (%)
Place of birth for the foreign-born population - Portugal (%)
Place of birth for the foreign-born population - Spain (%)
Place of birth for the foreign-born population - Other Southern Europe (%)
Place of birth for the foreign-born population - Albania (%)
Place of birth for the foreign-born population - Belarus (%)
Place of birth for the foreign-born population - Bosnia and Herzegovina (%)
Place of birth for the foreign-born population - Bulgaria (%)
Place of birth for the foreign-born population - Croatia (%)
Place of birth for the foreign-born population - Czechoslovakia (%)
Place of birth for the foreign-born population - Hungary (%)
Place of birth for the foreign-born population - Latvia (%)
Place of birth for the foreign-born population - Lithuania (%)
Place of birth for the foreign-born population - North Macedonia (Macedonia) (%)
Place of birth for the foreign-born population - Moldova (%)
Place of birth for the foreign-born population - Poland (%)
Place of birth for the foreign-born population - Romania (%)
Place of birth for the foreign-born population - Russia (%)
Place of birth for the foreign-born population - Serbia (%)
Place of birth for the foreign-born population - Ukraine (%)
Place of birth for the foreign-born population - Other Eastern Europe (%)
Place of birth for the foreign-born population - China (%)
Place of birth for the foreign-born population - Hong Kong (%)
Place of birth for the foreign-born population - Taiwan (%)
Place of birth for the foreign-born population - Japan (%)
Place of birth for the foreign-born population - Korea (%)
Place of birth for the foreign-born population - Other Eastern Asia (%)
Place of birth for the foreign-born population - Afghanistan (%)
Place of birth for the foreign-born population - Bangladesh (%)
Place of birth for the foreign-born population - India (%)
Place of birth for the foreign-born population - Iran (%)
Place of birth for the foreign-born population - Kazakhstan (%)
Place of birth for the foreign-born population - Nepal (%)
Place of birth for the foreign-born population - Pakistan (%)
Place of birth for the foreign-born population - Sri Lanka (%)
Place of birth for the foreign-born population - Uzbekistan (%)
Place of birth for the foreign-born population - Other South Central Asia (%)
Place of birth for the foreign-born population - Burma (%)
Place of birth for the foreign-born population - Cambodia (%)
Place of birth for the foreign-born population - Indonesia (%)
Place of birth for the foreign-born population - Laos (%)
Place of birth for the foreign-born population - Malaysia (%)
Place of birth for the foreign-born population - Philippines (%)
Place of birth for the foreign-born population - Singapore (%)
Place of birth for the foreign-born population - Thailand (%)
Place of birth for the foreign-born population - Vietnam (%)
Place of birth for the foreign-born population - Other South Eastern Asia (%)
Place of birth for the foreign-born population - Armenia (%)
Place of birth for the foreign-born population - Iraq (%)
Place of birth for the foreign-born population - Israel (%)
Place of birth for the foreign-born population - Jordan (%)
Place of birth for the foreign-born population - Kuwait (%)
Place of birth for the foreign-born population - Lebanon (%)
Place of birth for the foreign-born population - Saudi Arabia (%)
Place of birth for the foreign-born population - Syria (%)
Place of birth for the foreign-born population - Turkey (%)
Place of birth for the foreign-born population - Yemen (%)
Place of birth for the foreign-born population - Other Western Asia (%)
Place of birth for the foreign-born population - Eritrea (%)
Place of birth for the foreign-born population - Ethiopia (%)
Place of birth for the foreign-born population - Kenya (%)
Place of birth for the foreign-born population - Somalia (%)
Place of birth for the foreign-born population - Uganda (%)
Place of birth for the foreign-born population - Zimbabwe (%)
Place of birth for the foreign-born population - Other Eastern Africa (%)
Place of birth for the foreign-born population - Cameroon (%)
Place of birth for the foreign-born population - Congo (%)
Place of birth for the foreign-born population - Democratic Republic of Congo (Zaire) (%)
Place of birth for the foreign-born population - Other Middle Africa (%)
Place of birth for the foreign-born population - Egypt (%)
Place of birth for the foreign-born population - Morocco (%)
Place of birth for the foreign-born population - Sudan (%)
Place of birth for the foreign-born population - Other Northern Africa (%)
Place of birth for the foreign-born population - South Africa (%)
Place of birth for the foreign-born population - Other Southern Africa (%)
Place of birth for the foreign-born population - Cabo Verde (%)
Place of birth for the foreign-born population - Ghana (%)
Place of birth for the foreign-born population - Liberia (%)
Place of birth for the foreign-born population - Nigeria (%)
Place of birth for the foreign-born population - Senegal (%)
Place of birth for the foreign-born population - Sierra Leone (%)
Place of birth for the foreign-born population - Other Western Africa (%)
Place of birth for the foreign-born population - Australia (%)
Place of birth for the foreign-born population - New Zealand (%)
Place of birth for the foreign-born population - Fiji (%)
Place of birth for the foreign-born population - Micronesia (%)
Place of birth for the foreign-born population - Bahamas (%)
Place of birth for the foreign-born population - Barbados (%)
Place of birth for the foreign-born population - Cuba (%)
Place of birth for the foreign-born population - Dominica (%)
Place of birth for the foreign-born population - Dominican Republic (%)
Place of birth for the foreign-born population - Grenada (%)
Place of birth for the foreign-born population - Haiti (%)
Place of birth for the foreign-born population - Jamaica (%)
Place of birth for the foreign-born population - St. Vincent and the Grenadines (%)
Place of birth for the foreign-born population - Trinidad and Tobago (%)
Place of birth for the foreign-born population - West Indies (%)
Place of birth for the foreign-born population - Other Caribbean (%)
Place of birth for the foreign-born population - Belize (%)
Place of birth for the foreign-born population - Costa Rica (%)
Place of birth for the foreign-born population - El Salvador (%)
Place of birth for the foreign-born population - Guatemala (%)
Place of birth for the foreign-born population - Honduras (%)
Place of birth for the foreign-born population - Mexico (%)
Place of birth for the foreign-born population - Nicaragua (%)
Place of birth for the foreign-born population - Panama (%)
Place of birth for the foreign-born population - Other Central America (%)
Place of birth for the foreign-born population - Argentina (%)
Place of birth for the foreign-born population - Bolivia (%)
Place of birth for the foreign-born population - Brazil (%)
Place of birth for the foreign-born population - Chile (%)
Place of birth for the foreign-born population - Colombia (%)
Place of birth for the foreign-born population - Ecuador (%)
Place of birth for the foreign-born population - Guyana (%)
Place of birth for the foreign-born population - Peru (%)
Place of birth for the foreign-born population - Uruguay (%)
Place of birth for the foreign-born population - Venezuela (%)
Place of birth for the foreign-born population - Other South America (%)
Place of birth for the foreign-born population - Canada (%)
Place of birth for the foreign-born population - Other Northern America (%)
Place of birth for the foreign-born population - Other (%)
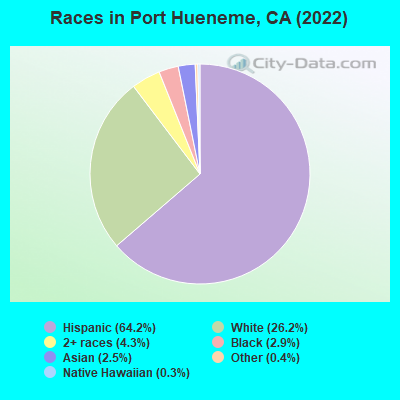
According to 2022 data, the most numerous races in Port Hueneme, CA are Hispanic (13,853 residents), White alone (5,733 residents), and Asian alone (863 residents). 53.5% of Port Hueneme residents speak English at home. 22.9% of Port Hueneme, CA residents are foreign-born (18.3% born in Latin America, 2.8% born in Asia), which is 13.4% less than the foreign-born rate of 26.0% across the entire state of California.
Race distribution in Port Hueneme
2000 2022
15,816,790 46.7% White alone 10,966,556 32.4% Hispanic 3,648,860 10.8% Asian alone 2,181,926 6.4% Black alone 903,115 2.7% Two or more races 178,984 0.5% American Indian alone 103,736 0.3% Native Hawaiian and Other 71,681 0.2% Other race alone
15,732,184 40.3% Hispanic 13,160,426 33.7% White alone 5,957,867 15.3% Asian alone 2,025,218 5.2% Black alone 1,663,222 4.3% Two or more races 251,618 0.6% Other race alone 135,777 0.3% Native Hawaiian and Other 103,030 0.3% American Indian alone
Income and house value in Port Hueneme Median household income in 2022 $73,454 White non-Hispanic householders$136,384 Black householders$51,558 American Indian and Alaska Native householders$85,565 Asian householders$168,210 Native Hawaiian and other Pacific Islander householders$82,821 Some other race householders$119,037 Two or more races householders$86,569 Hispanic or Latino race householdersMedian 2022 house value $584,525 White Non-Hispanic householders$611,520 Black or African American householders$607,561 American Indian or Alaska Native householders $603,601 Asian householders$629,516 Some other race householders$629,876 Two or more races householders$620,158 Hispanic or Latino householders
Median age by race in Port Hueneme
35.9 Median age for White residents35.9 37.3 33.2 Median age for Black or African American residents27.3 41.0 35.9 Median age for American Indian / Alaska Native residents22.6 56.1 39.5 Median age for Asian residents36.7 39.6 52.3 Median age for Native Hawaiian / Pacific Islander residents43.9 63.7 30.9 Median age for Other race residents30.5 32.1 35.9 Median age for Two or more races residents35.2 36.8 49.3 Median age for White alone residents40.5 54.8 32.3 Median age for Hispanic or Latino residents32.8 31.9
Owner/renter occupied households by race in Port Hueneme
House owners and renters - White residents 2,348 53.0% Owner occupied2,085 47.0% Renter occupiedHouse owners and renters - Black or African American residents 181 49.0% Owner occupied188 51.0% Renter occupiedHouse owners and renters - American Indian / Alaska Native residents 33 100.0% Renter occupiedHouse owners and renters - Asian residents 112 45.3% Owner occupied135 54.7% Renter occupiedHouse owners and renters - Native Hawaiian / Pacific Islander residents 16 31.7% Owner occupied35 68.3% Renter occupiedHouse owners and renters - Other race residents 209 41.5% Owner occupied295 58.5% Renter occupiedHouse owners and renters - Two or more races residents 457 39.7% Owner occupied693 60.3% Renter occupiedHouse owners and renters - White alone residents 1,659 63.1% Owner occupied972 36.9% Renter occupiedHouse owners and renters - Hispanic or Latino residents 1,217 37.2% Owner occupied2,058 62.8% Renter occupied
Language usage in Port Hueneme
English speakers - Total 53.5% of residents of Port Hueneme speak English at home.
40.9% of residents speak Spanish at home 5,387 64.4% Speak English very well2,978 35.6% Speak English less than very well5.4% of residents speak other language at home 812 73.6% Speak English very well292 26.4% Speak English less than very well
English speakers - Born in the United States 88.4% of residents of Port Hueneme speak English at home.
9.9% of residents speak Spanish at home 322 83.4% Speak English very well64 16.6% Speak English less than very well1.5% of residents speak other language at home 45 78.9% Speak English very well12 21.1% Speak English less than very well
English speakers - Native, born elsewhere 74.4% of residents of Port Hueneme speak English at home.
15.6% of residents speak Spanish at home 63 100.0% Speak English very well9.9% of residents speak other language at home 40 100.0% Speak English very well
English speakers - Foreign-born 9.2% of residents of Port Hueneme speak English at home.
75.3% of residents speak Spanish at home 1,084 29.0% Speak English very well2,659 71.0% Speak English less than very well13.5% of residents speak other language at home 395 58.7% Speak English very well278 41.3% Speak English less than very well
White (Caucasian) - Speak only English Native:
73.1% (7,263)Foreign-born:
12.8% (332)
White (Caucasian) - Speak another language Native:
24.0% (2,379)Foreign-born:
84.9% (2,208)
Black or African American - Speak only English Native:
88.9% (929)Foreign-born:
29.4% (8)
Black or African American - Speak another language Native:
12.0% (126)Foreign-born:
71.0% (20)
Asian - Speak only English Native:
72.7% (247)Foreign-born:
24.0% (125)
Asian - Speak another language Native:
28.5% (97)Foreign-born:
78.5% (408)
Native Hawaiian / Pacific Islander - Speak another language Native:
42.3% (41)Foreign-born:
96.4% (33)
Other race - Speak another language Native:
73.3% (971)Foreign-born:
100.0% (466)
Two or more races - Speak another language Native:
77.3% (2,116)Foreign-born:
100.0% (150)
White alone - Speak only English Native:
96.9% (5,043)Foreign-born:
55.7% (212)
White alone - Speak another language Native:
2.9% (148)Foreign-born:
44.3% (168)
Hispanic or Latino - Speak only English Native:
45.0% (3,954)Foreign-born:
4.9% (188)
Hispanic or Latino - Speak another language Native:
55.2% (4,854)Foreign-born:
94.7% (3,641)
Foreign-born residents in Port Hueneme 5,083 residents are foreign born (18.3% Latin America , 2.8% Asia ).
This city:
22.9%California:
100.0%
Marital status for residents in Port Hueneme Marital status - White (Caucasian) population 15 years and over
Males 43.8% Never married45.2% Now married2.1% Separated2.4% Widowed6.5% DivorcedFemales 28.9% Never married48.0% Now married1.5% Separated7.7% Widowed14.0% DivorcedWomen who gave birth in the past 12 months Now married:
58.1% (104)Unmarried:
41.9% (75)
Women who did not give birth in the past 12 months Now married:
49.9% (1,496)Unmarried:
50.1% (1,501)
Marital status - Black or African American population 15 years and over
Males 50.9% Never married38.0% Now married6.4% Separated3.8% Widowed0.9% DivorcedFemales 50.2% Never married30.4% Now married0.0% Separated6.0% Widowed13.4% DivorcedWomen who gave birth in the past 12 months Now married:
100.0% (10)Unmarried:
0.0% (0)
Women who did not give birth in the past 12 months Now married:
20.7% (49)Unmarried:
79.3% (187)
Marital status - American Indian / Alaska Native population 15 years and over
Males 55.0% Never married45.0% Now married0.0% Separated0.0% Widowed0.0% DivorcedFemales 25.0% Never married0.0% Now married0.0% Separated0.0% Widowed75.0% DivorcedWomen who gave birth in the past 12 months Now married:
0.0% (0)Unmarried:
100.0% (13)
Marital status - Asian population 15 years and over
Males 39.3% Never married57.7% Now married0.0% Separated0.0% Widowed3.0% DivorcedFemales 24.9% Never married60.4% Now married0.0% Separated3.0% Widowed11.7% DivorcedWomen who gave birth in the past 12 months Now married:
100.0% (24)Unmarried:
0.0% (0)
Women who did not give birth in the past 12 months Now married:
47.2% (103)Unmarried:
52.8% (115)
Marital status - Native Hawaiian / Pacific Islander population 15 years and over
Males 42.9% Never married57.1% Now married0.0% Separated0.0% Widowed0.0% DivorcedFemales 34.7% Never married65.3% Now married0.0% Separated0.0% Widowed0.0% DivorcedWomen who did not give birth in the past 12 months Now married:
100.0% (17)Unmarried:
0.0% (0)
Marital status - Other race population 15 years and over
Males 39.6% Never married51.0% Now married0.0% Separated2.0% Widowed7.3% DivorcedFemales 34.0% Never married38.9% Now married8.6% Separated6.5% Widowed12.0% DivorcedWomen who gave birth in the past 12 months Now married:
28.1% (10)Unmarried:
71.9% (25)
Women who did not give birth in the past 12 months Now married:
56.5% (199)Unmarried:
43.5% (154)
Marital status - Two or more races population 15 years and over
Males 54.7% Never married39.7% Now married2.1% Separated0.0% Widowed3.5% DivorcedFemales 37.8% Never married28.6% Now married0.0% Separated5.9% Widowed27.7% DivorcedWomen who gave birth in the past 12 months Now married:
50.0% (48)Unmarried:
50.0% (48)
Women who did not give birth in the past 12 months Now married:
25.9% (249)Unmarried:
74.1% (713)
Marital status - White alone, not Hispanic / Latino population 15 years and over
Males 41.4% Never married43.3% Now married1.3% Separated3.8% Widowed10.2% DivorcedFemales 18.1% Never married48.1% Now married1.4% Separated11.3% Widowed21.2% DivorcedWomen who gave birth in the past 12 months Now married:
100.0% (34)Unmarried:
0.0% (0)
Women who did not give birth in the past 12 months Now married:
55.0% (538)Unmarried:
45.0% (440)
Marital status - Hispanic or Latino population 15 years and over
Males 46.8% Never married45.9% Now married2.3% Separated1.3% Widowed3.8% DivorcedFemales 35.9% Never married45.7% Now married2.2% Separated5.2% Widowed11.0% DivorcedWomen who gave birth in the past 12 months Now married:
44.3% (119)Unmarried:
55.7% (150)
Women who did not give birth in the past 12 months Now married:
47.6% (1,617)Unmarried:
52.4% (1,779)
Ancestries in Port Hueneme
1,824 13.3% American193 1.4% German174 1.3% Italian170 1.2% Irish142 1.0% English104 0.8% European82 0.6% African67 0.5% Swedish56 0.4% Polish47 0.3% Egyptian46 0.3% Jamaican45 0.3% British42 0.3% Portuguese40 0.3% Canadian40 0.3% Russian28 0.2% Dutch23 0.2% Welsh21 0.2% Scottish20 0.1% Norwegian19 0.1% Scotch-Irish19 0.1% Ethiopian15 0.1% Czech14 0.1% Eastern European14 0.1% French14 0.1% Northern European11 0.08% Serbian9 0.07% French Canadian8 0.06% Belgian8 0.06% Slavic7 0.05% Danish
Geographical mobility in Port Hueneme Same house 1 year ago 11,968 88.1% White (Caucasian)822 69.9% Black or African American91 76.6% American Indian / Alaska Native501 58.0% Asian108 79.7% Native Hawaiian / Pacific Islander1,430 83.3% Other race2,880 76.9% Two or more races4,983 85.2% White alone, not Hispanic / Latino11,583 85.8% Hispanic or LatinoMoved within same county 1,039 7.6% White / Caucasian211 18.0% Black or African American12 10.2% American Indian / Alaska Native164 19.0% Asian111 6.5% Other race538 14.4% Two or more races362 6.2% White alone, not Hispanic / Latino1,475 10.9% Hispanic or LatinoMoved within same state 213 1.6% White / Caucasian47 4.0% Black or African American95 11.0% Asian14 10.5% Native Hawaiian / Pacific Islander85 4.9% Other race14 0.4% Two or more races167 2.8% White alone, not Hispanic / Latino216 1.6% Hispanic or LatinoMoved from different state 255 1.9% White / Caucasian60 5.1% Black or African American6 5.3% American Indian / Alaska Native23 2.6% Asian35 2.1% Other race95 2.5% Two or more races319 5.5% White alone, not Hispanic / Latino67 0.5% Hispanic or LatinoMoved from abroad 6 0.0% White46 5.4% Asian16 11.6% Native Hawaiian / Pacific Islander27 1.6% Other race41 1.1% Two or more races12 0.2% White alone, not Hispanic / Latino41 0.3% Hispanic or Latino
Children Nativity (place of birth) in Port Hueneme
Children under 6 years - Living with two parents Both parents native 619 100.0% NativeBoth parents foreign-born 112 100.0% NativeOne native, one foreign-born parent 148 100.0% NativeChildren under 6 years - Living with one parent Native parent 642 100.0% NativeForeign-born parent 73 100.0% NativeChildren 6 to 17 years - Living with two parents Both parents native 1,106 99.9% Native1 0.1% Foreign-bornBoth parents foreign-born 615 85.8% Native101 14.2% Foreign-bornOne native, one foreign-born parent 241 100.0% NativeChildren 6 to 17 years - Living with one parent Native parent 456 100.0% NativeForeign-born parent 419 50.0% Native420 50.0% Foreign-born
Grandparents responsible for own grandchildren in Port Hueneme
Grandparents (30 to 59 years) White / Caucasian 7 3.1% Responsible for grandchildren232 96.9% Not responsible for grandchildrenAsian 9 100.0% Not responsible for grandchildrenOther race 14 46.5% Responsible for grandchildren16 53.5% Not responsible for grandchildrenWhite alone, not Hispanic / Latino 2 6.7% Responsible for grandchildren27 93.3% Not responsible for grandchildrenHispanic or Latino 19 5.0% Responsible for grandchildren358 95.0% Not responsible for grandchildrenGrandparents (60 years and over) White / Caucasian 199 100.0% Not responsible for grandchildrenAsian 5 22.9% Responsible for grandchildren16 77.1% Not responsible for grandchildrenOther race 38 100.0% Not responsible for grandchildrenWhite alone, not Hispanic / Latino 84 100.0% Not responsible for grandchildrenHispanic or Latino 241 100.0% Not responsible for grandchildren