Races in Port Orange, Florida (FL) Detailed Stats
Data:
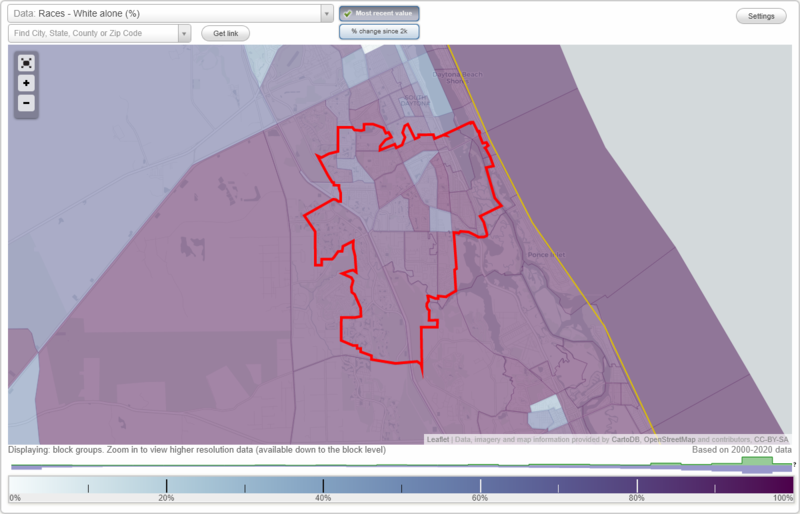
Races - White alone (%)
Races - White alone (% change since 2000)
Races - Black alone (%)
Races - Black alone (% change since 2000)
Races - American Indian alone (%)
Races - American Indian alone (% change since 2000)
Races - Asian alone (%)
Races - Asian alone (% change since 2000)
Races - Hispanic (%)
Races - Hispanic (% change since 2000)
Races - Native Hawaiian and Other Pacific Islander alone (%)
Races - Native Hawaiian and Other Pacific Islander alone (% change since 2000)
Races - Two or more races(%)
Races - Two or more races(% change since 2000)
Races - Other race alone (%)
Races - Other race alone (% change since 2000)
Racial diversity
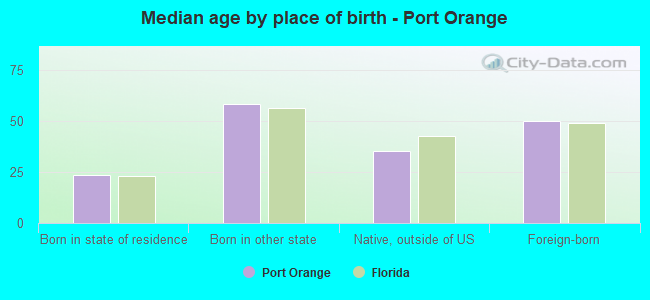
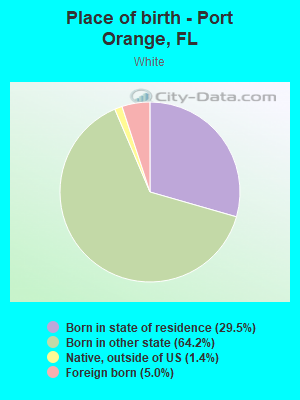
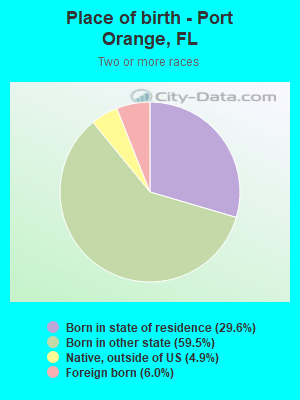
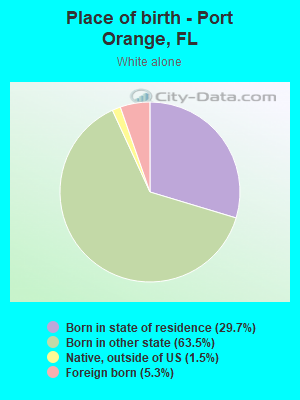
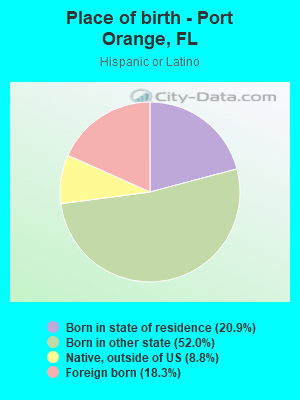
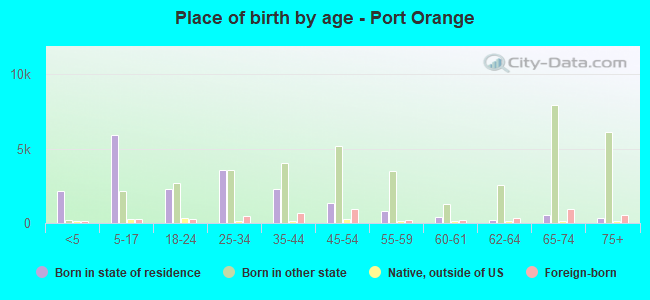
Place of birth - Born in state of residence (%)
Place of birth - Born in state of residence (%) - White
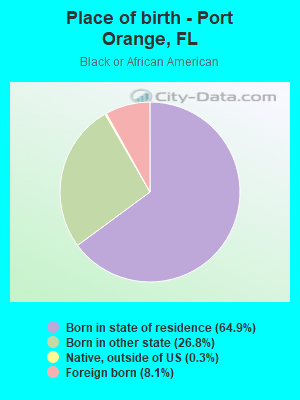
Place of birth - Born in state of residence (%) - Black or African American
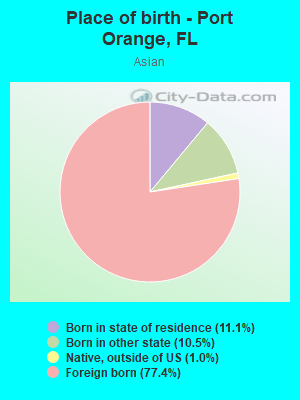
Place of birth - Born in state of residence (%) - Asian
Place of birth - Born in state of residence (%) - Hispanic or Latino
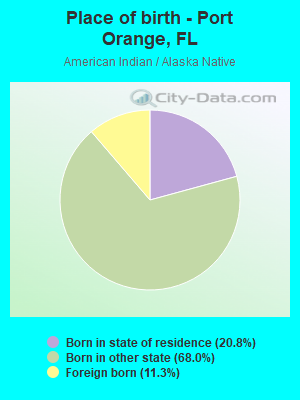
Place of birth - Born in state of residence (%) - American Indian and Alaska Native
Place of birth - Born in state of residence (%) - Multirace
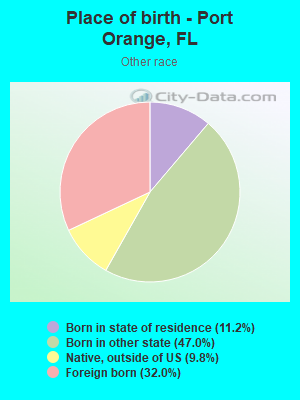
Place of birth - Born in state of residence (%) - Other Race
Place of birth - Born in other state (%)
Place of birth - Born in other state (%) - White
Place of birth - Born in other state (%) - Black or African American
Place of birth - Born in other state (%) - Asian
Place of birth - Born in other state (%) - Hispanic or Latino
Place of birth - Born in other state (%) - American Indian and Alaska Native
Place of birth - Born in other state (%) - Multirace
Place of birth - Born in other state (%) - Other Race
Place of birth - Native, outside of US (%)
Place of birth - Native, outside of US (%) - White
Place of birth - Native, outside of US (%) - Black or African American
Place of birth - Native, outside of US (%) - Asian
Place of birth - Native, outside of US (%) - Hispanic or Latino
Place of birth - Native, outside of US (%) - American Indian and Alaska Native
Place of birth - Native, outside of US (%) - Multirace
Place of birth - Native, outside of US (%) - Other Race
Place of birth - Foreign born (%)
Place of birth - Foreign born (%) - White
Place of birth - Foreign born (%) - Black or African American
Place of birth - Foreign born (%) - Asian
Place of birth - Foreign born (%) - Hispanic or Latino
Place of birth - Foreign born (%) - American Indian and Alaska Native
Place of birth - Foreign born (%) - Multirace
Place of birth - Foreign born (%) - Other Race
Residents speaking English at home (%)
Residents speaking English at home - Born in the United States (%)
Residents speaking English at home - Native, born elsewhere (%)
Residents speaking English at home - Foreign born (%)
Residents speaking Spanish at home (%)
Residents speaking Spanish at home - Born in the United States (%)
Residents speaking Spanish at home - Native, born elsewhere (%)
Residents speaking Spanish at home - Foreign born (%)
Residents speaking other language at home (%)
Residents speaking other language at home - Born in the United States (%)
Residents speaking other language at home - Native, born elsewhere (%)
Residents speaking other language at home - Foreign born (%)
Marital status - Never married (%)
Marital status - Now married (%)
Marital status - Separated (%)
Marital status - Widowed (%)
Marital status - Divorced (%)
Ancestries Reported - Arab (%)
Ancestries Reported - Czech (%)
Ancestries Reported - Danish (%)
Ancestries Reported - Dutch (%)
Ancestries Reported - English (%)
Ancestries Reported - French (%)
Ancestries Reported - French Canadian (%)
Ancestries Reported - German (%)
Ancestries Reported - Greek (%)
Ancestries Reported - Hungarian (%)
Ancestries Reported - Irish (%)
Ancestries Reported - Italian (%)
Ancestries Reported - Lithuanian (%)
Ancestries Reported - Norwegian (%)
Ancestries Reported - Polish (%)
Ancestries Reported - Portuguese (%)
Ancestries Reported - Russian (%)
Ancestries Reported - Scotch-Irish (%)
Ancestries Reported - Scottish (%)
Ancestries Reported - Slovak (%)
Ancestries Reported - Subsaharan African (%)
Ancestries Reported - Swedish (%)
Ancestries Reported - Swiss (%)
Ancestries Reported - Ukrainian (%)
Ancestries Reported - United States (%)
Ancestries Reported - Welsh (%)
Ancestries Reported - West Indian (%)
Ancestries Reported - Other (%)
Geographical mobility - Same house 1 year ago (%)
Geographical mobility - Same house 1 year ago (%) - White
Geographical mobility - Same house 1 year ago (%) - Black or African American
Geographical mobility - Same house 1 year ago (%) - Asian
Geographical mobility - Same house 1 year ago (%) - Hispanic or Latino
Geographical mobility - Same house 1 year ago (%) - American Indian and Alaska Native
Geographical mobility - Same house 1 year ago (%) - Multirace
Geographical mobility - Same house 1 year ago (%) - Other Race
Geographical mobility - Moved within same county (%)
Geographical mobility - Moved within same county (%) - White
Geographical mobility - Moved within same county (%) - Black or African American
Geographical mobility - Moved within same county (%) - Asian
Geographical mobility - Moved within same county (%) - Hispanic or Latino
Geographical mobility - Moved within same county (%) - American Indian and Alaska Native
Geographical mobility - Moved within same county (%) - Multirace
Geographical mobility - Moved within same county (%) - Other Race
Geographical mobility - Moved from different county within same state (%)
Geographical mobility - Moved from different county within same state (%) - White
Geographical mobility - Moved from different county within same state (%) - Black or African American
Geographical mobility - Moved from different county within same state (%) - Asian
Geographical mobility - Moved from different county within same state (%) - Hispanic or Latino
Geographical mobility - Moved from different county within same state (%) - American Indian and Alaska Native
Geographical mobility - Moved from different county within same state (%) - Multirace
Geographical mobility - Moved from different county within same state (%) - Other Race
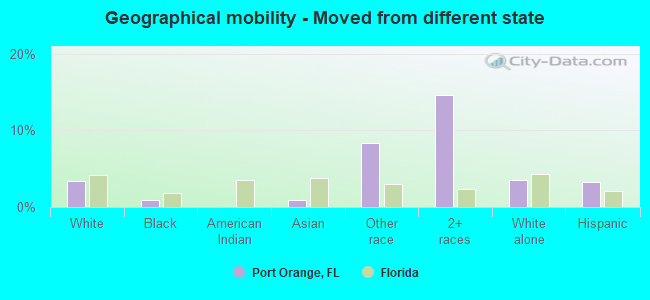
Geographical mobility - Moved from different state (%)
Geographical mobility - Moved from different state (%) - White
Geographical mobility - Moved from different state (%) - Black or African American
Geographical mobility - Moved from different state (%) - Asian
Geographical mobility - Moved from different state (%) - Hispanic or Latino
Geographical mobility - Moved from different state (%) - American Indian and Alaska Native
Geographical mobility - Moved from different state (%) - Multirace
Geographical mobility - Moved from different state (%) - Other Race
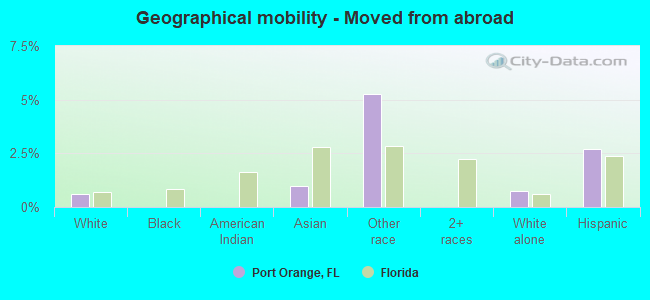
Geographical mobility - Moved from abroad (%)
Geographical mobility - Moved from abroad (%) - White
Geographical mobility - Moved from abroad (%) - Black or African American
Geographical mobility - Moved from abroad (%) - Asian
Geographical mobility - Moved from abroad (%) - Hispanic or Latino
Geographical mobility - Moved from abroad (%) - American Indian and Alaska Native
Geographical mobility - Moved from abroad (%) - Multirace
Geographical mobility - Moved from abroad (%) - Other Race
Place of birth for the foreign-born population - Ireland (%)
Place of birth for the foreign-born population - Denmark (%)
Place of birth for the foreign-born population - Norway (%)
Place of birth for the foreign-born population - Sweden (%)
Place of birth for the foreign-born population - United Kingdom (%)
Place of birth for the foreign-born population - England (%)
Place of birth for the foreign-born population - Scotland (%)
Place of birth for the foreign-born population - Other Northern Europe (%)
Place of birth for the foreign-born population - Austria (%)
Place of birth for the foreign-born population - Belgium (%)
Place of birth for the foreign-born population - France (%)
Place of birth for the foreign-born population - Germany (%)
Place of birth for the foreign-born population - Netherlands (%)
Place of birth for the foreign-born population - Switzerland (%)
Place of birth for the foreign-born population - Other Western Europe (%)
Place of birth for the foreign-born population - Greece (%)
Place of birth for the foreign-born population - Italy (%)
Place of birth for the foreign-born population - Portugal (%)
Place of birth for the foreign-born population - Spain (%)
Place of birth for the foreign-born population - Other Southern Europe (%)
Place of birth for the foreign-born population - Albania (%)
Place of birth for the foreign-born population - Belarus (%)
Place of birth for the foreign-born population - Bosnia and Herzegovina (%)
Place of birth for the foreign-born population - Bulgaria (%)
Place of birth for the foreign-born population - Croatia (%)
Place of birth for the foreign-born population - Czechoslovakia (%)
Place of birth for the foreign-born population - Hungary (%)
Place of birth for the foreign-born population - Latvia (%)
Place of birth for the foreign-born population - Lithuania (%)
Place of birth for the foreign-born population - North Macedonia (Macedonia) (%)
Place of birth for the foreign-born population - Moldova (%)
Place of birth for the foreign-born population - Poland (%)
Place of birth for the foreign-born population - Romania (%)
Place of birth for the foreign-born population - Russia (%)
Place of birth for the foreign-born population - Serbia (%)
Place of birth for the foreign-born population - Ukraine (%)
Place of birth for the foreign-born population - Other Eastern Europe (%)
Place of birth for the foreign-born population - China (%)
Place of birth for the foreign-born population - Hong Kong (%)
Place of birth for the foreign-born population - Taiwan (%)
Place of birth for the foreign-born population - Japan (%)
Place of birth for the foreign-born population - Korea (%)
Place of birth for the foreign-born population - Other Eastern Asia (%)
Place of birth for the foreign-born population - Afghanistan (%)
Place of birth for the foreign-born population - Bangladesh (%)
Place of birth for the foreign-born population - India (%)
Place of birth for the foreign-born population - Iran (%)
Place of birth for the foreign-born population - Kazakhstan (%)
Place of birth for the foreign-born population - Nepal (%)
Place of birth for the foreign-born population - Pakistan (%)
Place of birth for the foreign-born population - Sri Lanka (%)
Place of birth for the foreign-born population - Uzbekistan (%)
Place of birth for the foreign-born population - Other South Central Asia (%)
Place of birth for the foreign-born population - Burma (%)
Place of birth for the foreign-born population - Cambodia (%)
Place of birth for the foreign-born population - Indonesia (%)
Place of birth for the foreign-born population - Laos (%)
Place of birth for the foreign-born population - Malaysia (%)
Place of birth for the foreign-born population - Philippines (%)
Place of birth for the foreign-born population - Singapore (%)
Place of birth for the foreign-born population - Thailand (%)
Place of birth for the foreign-born population - Vietnam (%)
Place of birth for the foreign-born population - Other South Eastern Asia (%)
Place of birth for the foreign-born population - Armenia (%)
Place of birth for the foreign-born population - Iraq (%)
Place of birth for the foreign-born population - Israel (%)
Place of birth for the foreign-born population - Jordan (%)
Place of birth for the foreign-born population - Kuwait (%)
Place of birth for the foreign-born population - Lebanon (%)
Place of birth for the foreign-born population - Saudi Arabia (%)
Place of birth for the foreign-born population - Syria (%)
Place of birth for the foreign-born population - Turkey (%)
Place of birth for the foreign-born population - Yemen (%)
Place of birth for the foreign-born population - Other Western Asia (%)
Place of birth for the foreign-born population - Eritrea (%)
Place of birth for the foreign-born population - Ethiopia (%)
Place of birth for the foreign-born population - Kenya (%)
Place of birth for the foreign-born population - Somalia (%)
Place of birth for the foreign-born population - Uganda (%)
Place of birth for the foreign-born population - Zimbabwe (%)
Place of birth for the foreign-born population - Other Eastern Africa (%)
Place of birth for the foreign-born population - Cameroon (%)
Place of birth for the foreign-born population - Congo (%)
Place of birth for the foreign-born population - Democratic Republic of Congo (Zaire) (%)
Place of birth for the foreign-born population - Other Middle Africa (%)
Place of birth for the foreign-born population - Egypt (%)
Place of birth for the foreign-born population - Morocco (%)
Place of birth for the foreign-born population - Sudan (%)
Place of birth for the foreign-born population - Other Northern Africa (%)
Place of birth for the foreign-born population - South Africa (%)
Place of birth for the foreign-born population - Other Southern Africa (%)
Place of birth for the foreign-born population - Cabo Verde (%)
Place of birth for the foreign-born population - Ghana (%)
Place of birth for the foreign-born population - Liberia (%)
Place of birth for the foreign-born population - Nigeria (%)
Place of birth for the foreign-born population - Senegal (%)
Place of birth for the foreign-born population - Sierra Leone (%)
Place of birth for the foreign-born population - Other Western Africa (%)
Place of birth for the foreign-born population - Australia (%)
Place of birth for the foreign-born population - New Zealand (%)
Place of birth for the foreign-born population - Fiji (%)
Place of birth for the foreign-born population - Micronesia (%)
Place of birth for the foreign-born population - Bahamas (%)
Place of birth for the foreign-born population - Barbados (%)
Place of birth for the foreign-born population - Cuba (%)
Place of birth for the foreign-born population - Dominica (%)
Place of birth for the foreign-born population - Dominican Republic (%)
Place of birth for the foreign-born population - Grenada (%)
Place of birth for the foreign-born population - Haiti (%)
Place of birth for the foreign-born population - Jamaica (%)
Place of birth for the foreign-born population - St. Vincent and the Grenadines (%)
Place of birth for the foreign-born population - Trinidad and Tobago (%)
Place of birth for the foreign-born population - West Indies (%)
Place of birth for the foreign-born population - Other Caribbean (%)
Place of birth for the foreign-born population - Belize (%)
Place of birth for the foreign-born population - Costa Rica (%)
Place of birth for the foreign-born population - El Salvador (%)
Place of birth for the foreign-born population - Guatemala (%)
Place of birth for the foreign-born population - Honduras (%)
Place of birth for the foreign-born population - Mexico (%)
Place of birth for the foreign-born population - Nicaragua (%)
Place of birth for the foreign-born population - Panama (%)
Place of birth for the foreign-born population - Other Central America (%)
Place of birth for the foreign-born population - Argentina (%)
Place of birth for the foreign-born population - Bolivia (%)
Place of birth for the foreign-born population - Brazil (%)
Place of birth for the foreign-born population - Chile (%)
Place of birth for the foreign-born population - Colombia (%)
Place of birth for the foreign-born population - Ecuador (%)
Place of birth for the foreign-born population - Guyana (%)
Place of birth for the foreign-born population - Peru (%)
Place of birth for the foreign-born population - Uruguay (%)
Place of birth for the foreign-born population - Venezuela (%)
Place of birth for the foreign-born population - Other South America (%)
Place of birth for the foreign-born population - Canada (%)
Place of birth for the foreign-born population - Other Northern America (%)
Place of birth for the foreign-born population - Other (%)
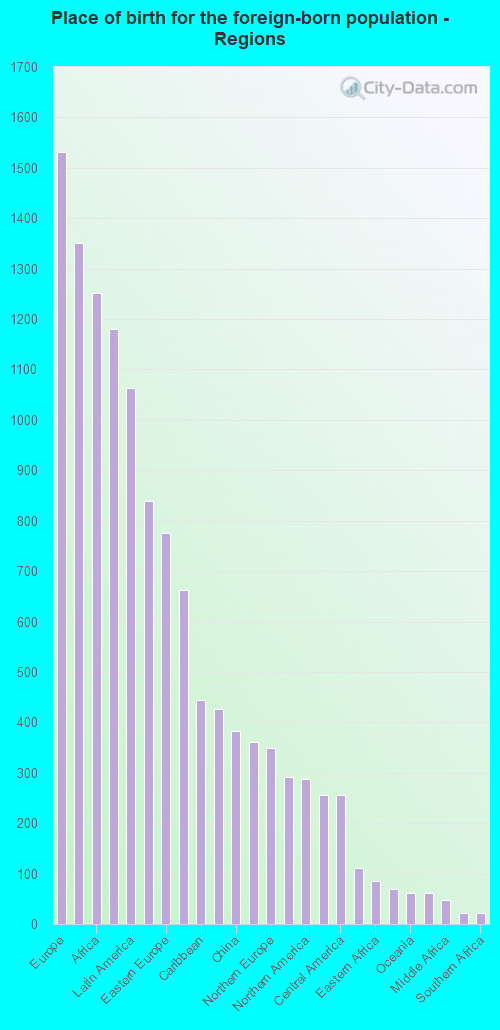
According to 2022 data, the most numerous races in Port Orange, FL are White alone (53,836 residents), Hispanic (3,991 residents), and Black alone (2,824 residents). 90.8% of Port Orange residents speak English at home. 8.3% of Port Orange, FL residents are foreign-born (2.3% born in Europe, 1.9% born in Africa, 1.8% born in Asia, 1.6% born in Latin America), which is 154.5% less than the foreign-born rate of 21.0% across the entire state of Florida.
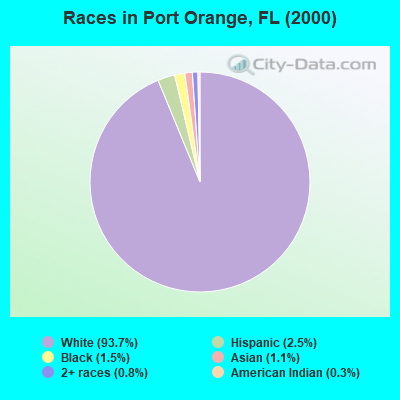
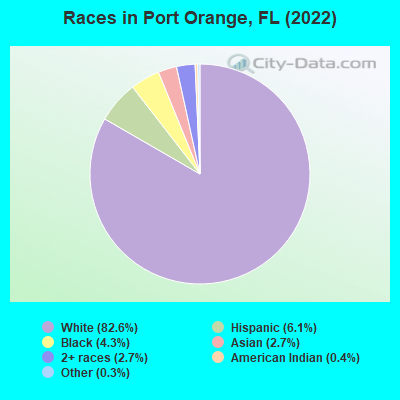
Race distribution in Port Orange
2000 2022
10,458,509 65.4% White alone 2,682,715 16.8% Hispanic 2,264,268 14.2% Black alone 261,693 1.6% Asian alone 236,954 1.5% Two or more races 42,358 0.3% American Indian alone 28,994 0.2% Other race alone 6,887 0.04% Native Hawaiian and Other
11,309,403 50.8% White alone 6,025,039 27.1% Hispanic 3,241,015 14.6% Black alone 861,630 3.9% Two or more races 623,692 2.8% Asian alone 152,054 0.7% Other race alone 22,504 0.1% American Indian alone 9,486 0.04% Native Hawaiian and Other
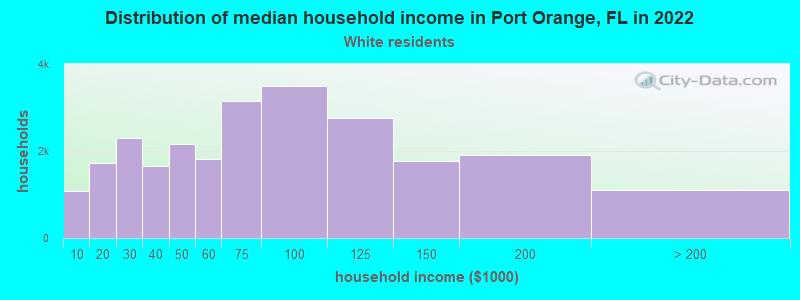
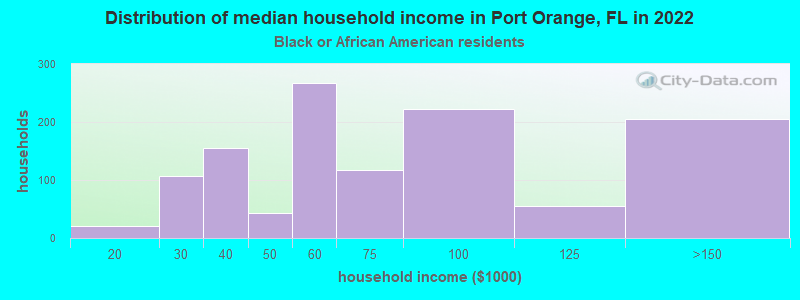
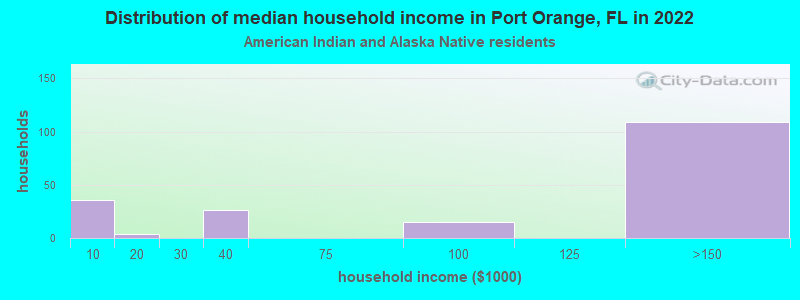
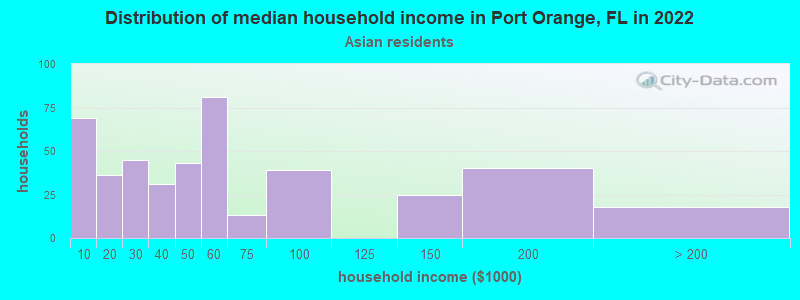
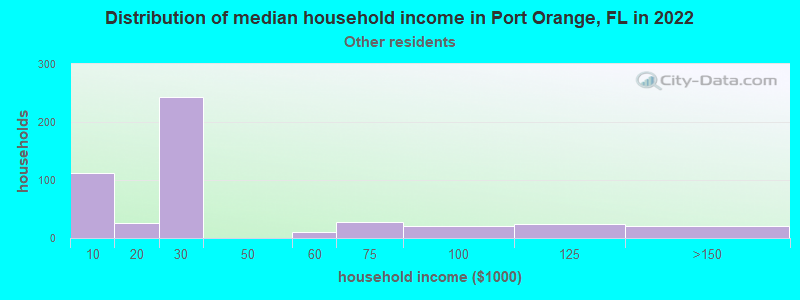
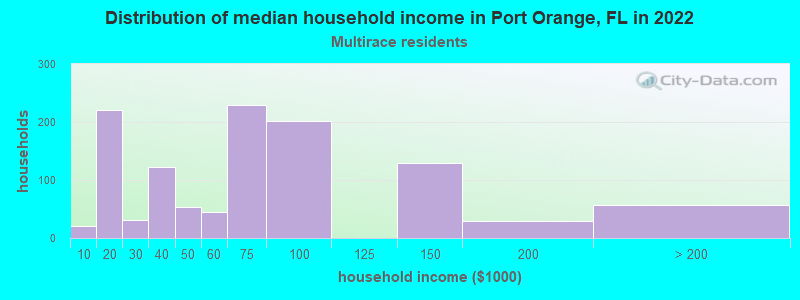
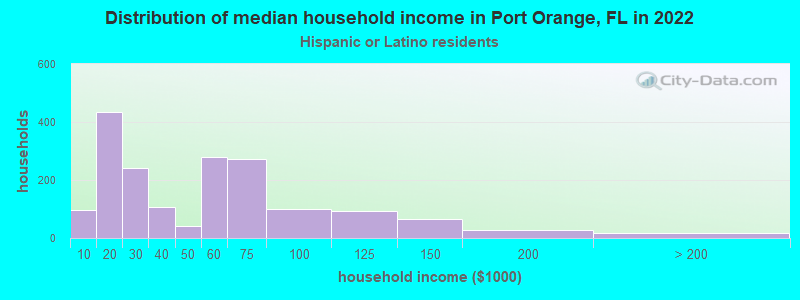
Income and house value in Port Orange Median household income in 2022 $68,785 White non-Hispanic householders$76,189 Black householders$60,390 Asian householders$26,305 Some other race householders$74,418 Two or more races householders$39,548 Hispanic or Latino race householdersMedian 2022 house value $355,708 White Non-Hispanic householders$367,872 Black or African American householders$350,179 American Indian or Alaska Native householders $347,967 Asian householders$350,179 Some other race householders$354,234 Two or more races householders$329,537 Hispanic or Latino householders
Median age by race in Port Orange
50.4 Median age for White residents48.6 52.2 29.1 Median age for Black or African American residents29.1 29.9 44.1 Median age for American Indian / Alaska Native residents30.6 41.0 37.2 Median age for Asian residents27.1 45.5 -668,922,729.2 Median age for Native Hawaiian / Pacific Islander residents-668,922,729.2 -443,298,968.6 44.7 Median age for Other race residents64.1 32.4 29.5 Median age for Two or more races residents26.8 31.1 50.5 Median age for White alone residents48.5 52.0 33.8 Median age for Hispanic or Latino residents32.2 34.5
Owner/renter occupied households by race in Port Orange
House owners and renters - White residents 19,617 78.1% Owner occupied5,493 21.9% Renter occupiedHouse owners and renters - Black or African American residents 262 24.3% Owner occupied815 75.7% Renter occupiedHouse owners and renters - American Indian / Alaska Native residents 78 45.8% Owner occupied93 54.2% Renter occupiedHouse owners and renters - Asian residents 336 71.4% Owner occupied134 28.6% Renter occupiedHouse owners and renters - Other race residents 323 72.3% Owner occupied123 27.7% Renter occupiedHouse owners and renters - Two or more races residents 623 55.0% Owner occupied510 45.0% Renter occupiedHouse owners and renters - White alone residents 19,606 79.0% Owner occupied5,227 21.0% Renter occupiedHouse owners and renters - Hispanic or Latino residents 759 44.4% Owner occupied949 55.6% Renter occupied
Language usage in Port Orange
English speakers - Total 90.8% of residents of Port Orange speak English at home.
2.9% of residents speak Spanish at home 1,472 79.7% Speak English very well376 20.3% Speak English less than very well6.2% of residents speak other language at home 2,861 72.9% Speak English very well1,061 27.1% Speak English less than very well
English speakers - Born in the United States 96.1% of residents of Port Orange speak English at home.
2.1% of residents speak Spanish at home 733 90.0% Speak English very well81 10.0% Speak English less than very well1.5% of residents speak other language at home 368 64.3% Speak English very well204 35.7% Speak English less than very well
English speakers - Native, born elsewhere 39.8% of residents of Port Orange speak English at home.
23.1% of residents speak Spanish at home 230 68.7% Speak English very well105 31.3% Speak English less than very well25.3% of residents speak other language at home 366 100.0% Speak English very well
English speakers - Foreign-born 34.0% of residents of Port Orange speak English at home.
11.5% of residents speak Spanish at home 413 72.8% Speak English very well154 27.2% Speak English less than very well55.5% of residents speak other language at home 1,947 71.1% Speak English very well793 28.9% Speak English less than very well
White (Caucasian) - Speak only English Native:
98.5% (48,728)Foreign-born:
51.8% (1,401)
White (Caucasian) - Speak another language Native:
2.2% (1,069)Foreign-born:
48.8% (1,320)
Black or African American - Speak only English Native:
96.0% (2,464)Foreign-born:
67.1% (159)
Black or African American - Speak another language Native:
3.9% (99)Foreign-born:
32.2% (76)
Asian - Speak only English Native:
84.1% (305)Foreign-born:
10.3% (133)
Asian - Speak another language Native:
13.2% (48)Foreign-born:
91.7% (1,180)
Other race - Speak only English Native:
89.5% (612)Foreign-born:
6.8% (23)
Other race - Speak another language Native:
25.4% (174)Foreign-born:
92.9% (314)
Two or more races - Speak only English Native:
79.0% (2,125)Foreign-born:
24.3% (46)
Two or more races - Speak another language Native:
18.8% (505)Foreign-born:
75.3% (141)
White alone - Speak only English Native:
97.1% (47,884)Foreign-born:
45.0% (1,291)
White alone - Speak another language Native:
2.8% (1,398)Foreign-born:
50.2% (1,439)
Hispanic or Latino - Speak only English Native:
74.2% (2,174)Foreign-born:
21.0% (158)
Hispanic or Latino - Speak another language Native:
31.9% (934)Foreign-born:
79.7% (598)
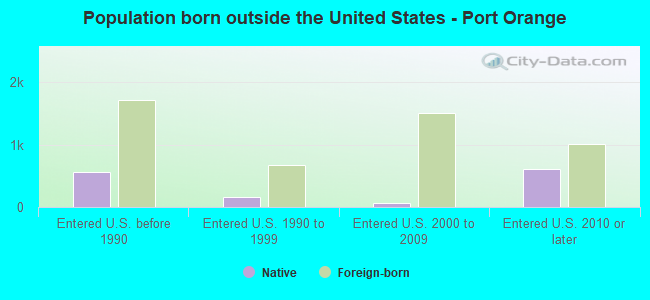
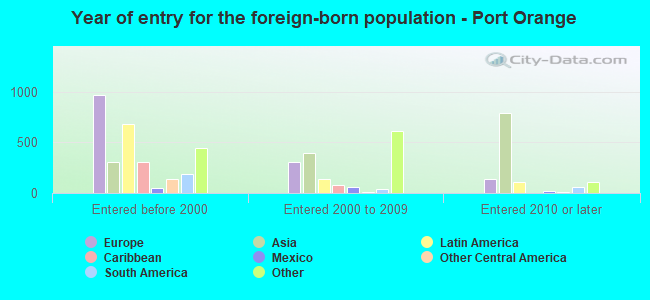
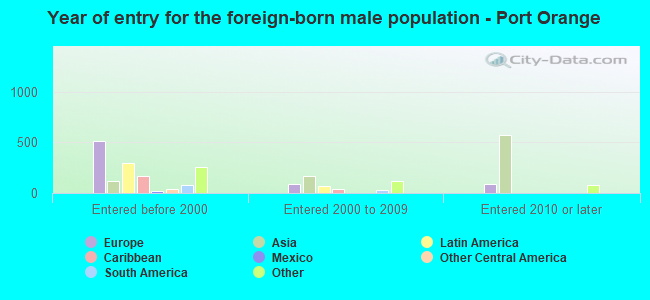
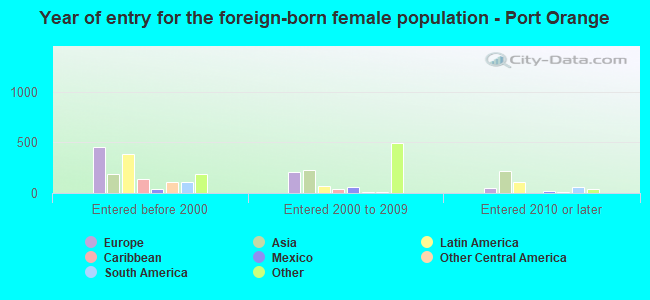
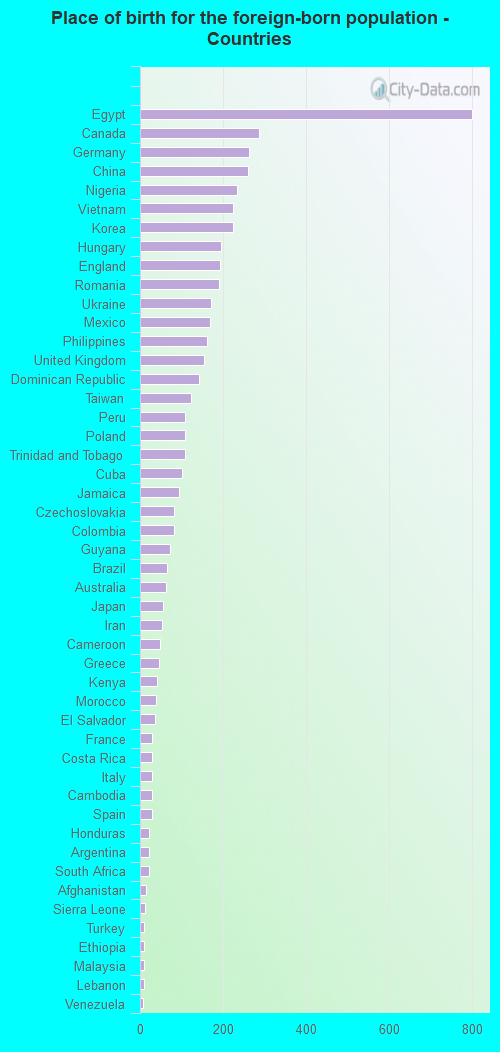
Foreign-born residents in Port Orange 5,377 residents are foreign born (2.3% Europe , 1.9% Africa , 1.8% Asia , 1.6% Latin America ).
This city:
8.3%Florida:
21.1%
Marital status for residents in Port Orange Marital status - White (Caucasian) population 15 years and over
Males 29.5% Never married51.0% Now married0.4% Separated4.5% Widowed14.5% DivorcedFemales 23.9% Never married47.6% Now married1.1% Separated13.0% Widowed14.4% DivorcedWomen who gave birth in the past 12 months Now married:
57.7% (171)Unmarried:
42.3% (125)
Women who did not give birth in the past 12 months Now married:
41.7% (4,135)Unmarried:
58.3% (5,772)
Marital status - Black or African American population 15 years and over
Males 49.2% Never married34.3% Now married4.4% Separated0.0% Widowed12.1% DivorcedFemales 63.2% Never married19.6% Now married0.7% Separated3.5% Widowed13.0% DivorcedWomen who gave birth in the past 12 months Now married:
31.7% (21)Unmarried:
68.3% (44)
Women who did not give birth in the past 12 months Now married:
12.8% (120)Unmarried:
87.2% (822)
Marital status - American Indian / Alaska Native population 15 years and over
Males 45.5% Never married54.5% Now married0.0% Separated0.0% Widowed0.0% DivorcedFemales 0.0% Never married74.9% Now married0.0% Separated0.0% Widowed25.1% DivorcedWomen who did not give birth in the past 12 months Now married:
100.0% (41)Unmarried:
0.0% (0)
Marital status - Asian population 15 years and over
Males 50.2% Never married44.8% Now married0.0% Separated0.0% Widowed5.0% DivorcedFemales 5.0% Never married72.8% Now married0.0% Separated6.2% Widowed16.0% DivorcedWomen who gave birth in the past 12 months Now married:
100.0% (9)Unmarried:
0.0% (0)
Women who did not give birth in the past 12 months Now married:
77.5% (249)Unmarried:
22.5% (72)
Marital status - Other race population 15 years and over
Males 34.2% Never married58.1% Now married0.0% Separated0.0% Widowed7.7% DivorcedFemales 38.7% Never married38.2% Now married0.0% Separated14.1% Widowed9.0% DivorcedWomen who gave birth in the past 12 months Now married:
0.0% (0)Unmarried:
100.0% (27)
Women who did not give birth in the past 12 months Now married:
29.3% (83)Unmarried:
70.7% (200)
Marital status - Two or more races population 15 years and over
Males 68.4% Never married24.3% Now married0.0% Separated1.3% Widowed6.0% DivorcedFemales 45.1% Never married23.6% Now married0.0% Separated8.0% Widowed23.3% DivorcedWomen who gave birth in the past 12 months Now married:
53.7% (36)Unmarried:
46.3% (31)
Women who did not give birth in the past 12 months Now married:
17.4% (100)Unmarried:
82.6% (475)
Marital status - White alone, not Hispanic / Latino population 15 years and over
Males 28.8% Never married51.3% Now married0.4% Separated4.7% Widowed14.7% DivorcedFemales 23.7% Never married48.0% Now married0.9% Separated12.9% Widowed14.5% DivorcedWomen who gave birth in the past 12 months Now married:
57.7% (179)Unmarried:
42.3% (131)
Women who did not give birth in the past 12 months Now married:
42.1% (4,270)Unmarried:
57.9% (5,876)
Marital status - Hispanic or Latino population 15 years and over
Males 50.2% Never married41.2% Now married1.2% Separated0.0% Widowed7.4% DivorcedFemales 38.0% Never married29.3% Now married4.4% Separated14.4% Widowed13.9% DivorcedWomen who gave birth in the past 12 months Now married:
61.7% (33)Unmarried:
38.3% (20)
Women who did not give birth in the past 12 months Now married:
25.1% (168)Unmarried:
74.9% (500)
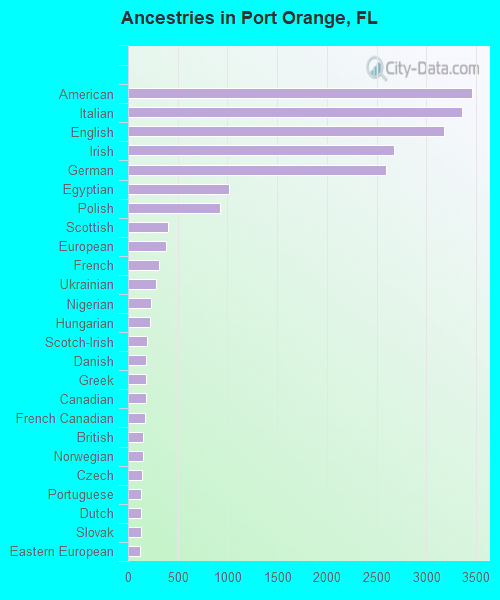
Ancestries in Port Orange
3,458 11.2% American3,360 10.8% Italian3,176 10.3% English2,678 8.6% Irish2,593 8.4% German1,014 3.3% Egyptian924 3.0% Polish400 1.3% Scottish386 1.2% European308 1.0% French286 0.9% Ukrainian227 0.7% Nigerian218 0.7% Hungarian195 0.6% Scotch-Irish185 0.6% Danish180 0.6% Greek180 0.6% Canadian174 0.6% French Canadian152 0.5% British151 0.5% Norwegian145 0.5% Czech133 0.4% Portuguese132 0.4% Dutch129 0.4% Slovak120 0.4% Eastern European118 0.4% African99 0.3% Welsh96 0.3% Jamaican76 0.2% Scandinavian69 0.2% Russian67 0.2% Swedish59 0.2% Iranian55 0.2% Swiss52 0.2% West Indian50 0.2% Trinidadian and Tobagonian48 0.2% Austrian42 0.1% Croatian37 0.1% Moroccan35 0.1% Lithuanian30 0.10% Slovene28 0.09% Israeli26 0.08% Australian16 0.05% Finnish12 0.04% Pennsylvania German12 0.04% Czechoslovakian11 0.04% Lebanese10 0.03% Brazilian9 0.03% Slavic9 0.03% Yugoslavian8 0.03% Arab8 0.03% Ethiopian7 0.02% Belgian6 0.02% Northern European
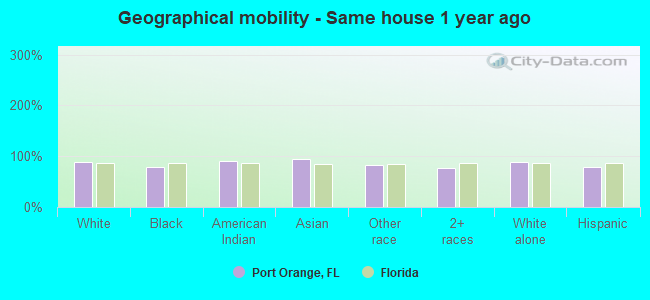
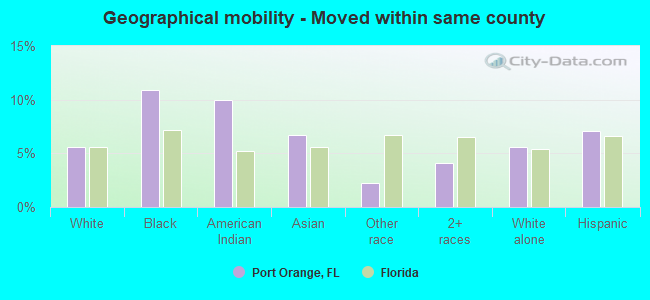
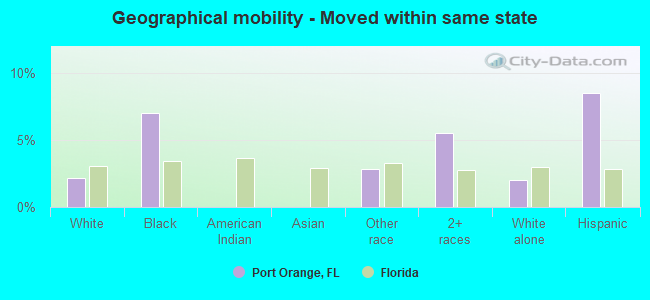
Geographical mobility in Port Orange Same house 1 year ago 47,375 88.3% White (Caucasian)2,294 78.0% Black or African American386 90.0% American Indian / Alaska Native1,663 94.8% Asian903 82.7% Other race2,324 77.2% Two or more races47,225 88.1% White alone, not Hispanic / Latino3,084 78.4% Hispanic or LatinoMoved within same county 2,985 5.6% White / Caucasian322 10.9% Black or African American43 9.9% American Indian / Alaska Native118 6.7% Asian24 2.2% Other race125 4.1% Two or more races3,000 5.6% White alone, not Hispanic / Latino279 7.1% Hispanic or LatinoMoved within same state 1,140 2.1% White / Caucasian206 7.0% Black or African American31 2.9% Other race166 5.5% Two or more races1,083 2.0% White alone, not Hispanic / Latino333 8.5% Hispanic or LatinoMoved from different state 1,827 3.4% White / Caucasian27 0.9% Black or African American16 0.9% Asian91 8.4% Other race440 14.6% Two or more races1,911 3.6% White alone, not Hispanic / Latino126 3.2% Hispanic or LatinoMoved from abroad 323 0.6% White18 1.0% Asian57 5.3% Other race402 0.8% White alone, not Hispanic / Latino106 2.7% Hispanic or Latino
Children Nativity (place of birth) in Port Orange
Children under 6 years - Living with two parents Both parents native 1,524 100.0% NativeBoth parents foreign-born 74 48.4% Native79 51.6% Foreign-bornOne native, one foreign-born parent 225 100.0% NativeChildren under 6 years - Living with one parent Native parent 1,227 100.0% NativeChildren 6 to 17 years - Living with two parents Both parents native 3,558 99.7% Native11 0.3% Foreign-bornBoth parents foreign-born 225 55.4% Native182 44.6% Foreign-bornOne native, one foreign-born parent 521 97.0% Native16 3.0% Foreign-bornChildren 6 to 17 years - Living with one parent Native parent 2,360 100.0% NativeForeign-born parent 290 50.6% Native283 49.4% Foreign-born
Grandparents responsible for own grandchildren in Port Orange
Grandparents (30 to 59 years) White / Caucasian 64 30.2% Responsible for grandchildren147 69.8% Not responsible for grandchildrenAsian 30 100.0% Not responsible for grandchildrenWhite alone, not Hispanic / Latino 66 28.9% Responsible for grandchildren162 71.1% Not responsible for grandchildrenGrandparents (60 years and over) White / Caucasian 156 25.7% Responsible for grandchildren452 74.3% Not responsible for grandchildrenWhite alone, not Hispanic / Latino 154 26.0% Responsible for grandchildren439 74.0% Not responsible for grandchildren