Races in Portsmouth, New Hampshire (NH) Detailed Stats
Data:
Races - White alone (%)
Races - White alone (% change since 2000)
Races - Black alone (%)
Races - Black alone (% change since 2000)
Races - American Indian alone (%)
Races - American Indian alone (% change since 2000)
Races - Asian alone (%)
Races - Asian alone (% change since 2000)
Races - Hispanic (%)
Races - Hispanic (% change since 2000)
Races - Native Hawaiian and Other Pacific Islander alone (%)
Races - Native Hawaiian and Other Pacific Islander alone (% change since 2000)
Races - Two or more races(%)
Races - Two or more races(% change since 2000)
Races - Other race alone (%)
Races - Other race alone (% change since 2000)
Racial diversity
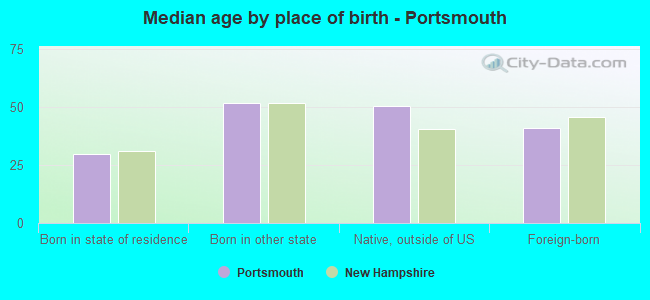
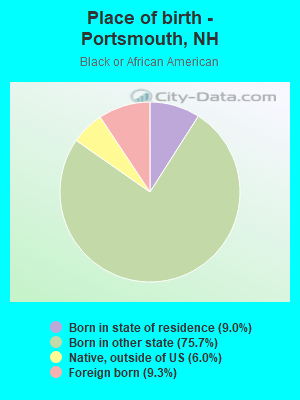
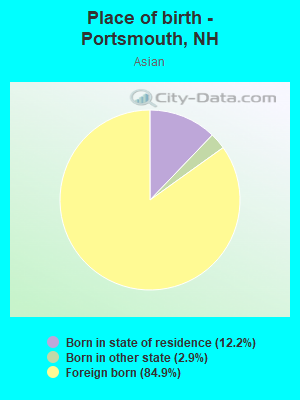
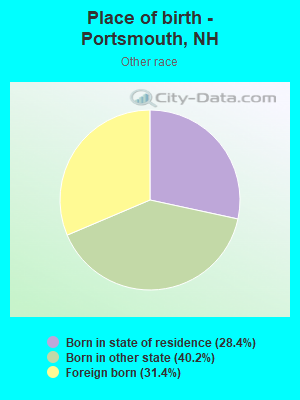
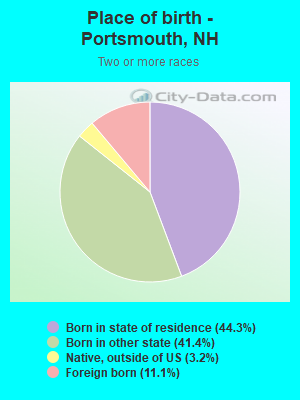
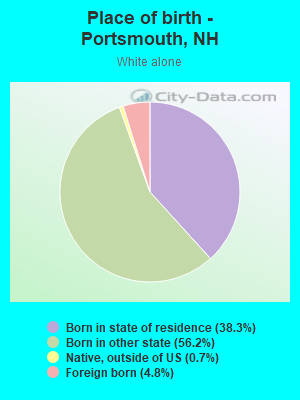
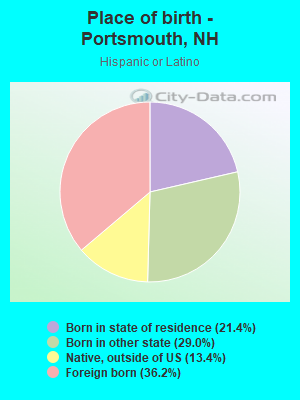
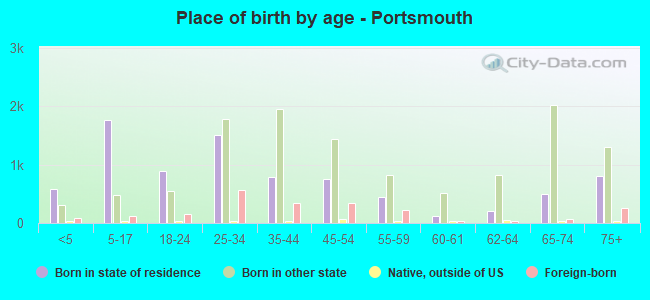
Place of birth - Born in state of residence (%)
Place of birth - Born in state of residence (%) - White
Place of birth - Born in state of residence (%) - Black or African American
Place of birth - Born in state of residence (%) - Asian
Place of birth - Born in state of residence (%) - Hispanic or Latino
Place of birth - Born in state of residence (%) - American Indian and Alaska Native
Place of birth - Born in state of residence (%) - Multirace
Place of birth - Born in state of residence (%) - Other Race
Place of birth - Born in other state (%)
Place of birth - Born in other state (%) - White
Place of birth - Born in other state (%) - Black or African American
Place of birth - Born in other state (%) - Asian
Place of birth - Born in other state (%) - Hispanic or Latino
Place of birth - Born in other state (%) - American Indian and Alaska Native
Place of birth - Born in other state (%) - Multirace
Place of birth - Born in other state (%) - Other Race
Place of birth - Native, outside of US (%)
Place of birth - Native, outside of US (%) - White
Place of birth - Native, outside of US (%) - Black or African American
Place of birth - Native, outside of US (%) - Asian
Place of birth - Native, outside of US (%) - Hispanic or Latino
Place of birth - Native, outside of US (%) - American Indian and Alaska Native
Place of birth - Native, outside of US (%) - Multirace
Place of birth - Native, outside of US (%) - Other Race
Place of birth - Foreign born (%)
Place of birth - Foreign born (%) - White
Place of birth - Foreign born (%) - Black or African American
Place of birth - Foreign born (%) - Asian
Place of birth - Foreign born (%) - Hispanic or Latino
Place of birth - Foreign born (%) - American Indian and Alaska Native
Place of birth - Foreign born (%) - Multirace
Place of birth - Foreign born (%) - Other Race
Residents speaking English at home (%)
Residents speaking English at home - Born in the United States (%)
Residents speaking English at home - Native, born elsewhere (%)
Residents speaking English at home - Foreign born (%)
Residents speaking Spanish at home (%)
Residents speaking Spanish at home - Born in the United States (%)
Residents speaking Spanish at home - Native, born elsewhere (%)
Residents speaking Spanish at home - Foreign born (%)
Residents speaking other language at home (%)
Residents speaking other language at home - Born in the United States (%)
Residents speaking other language at home - Native, born elsewhere (%)
Residents speaking other language at home - Foreign born (%)
Marital status - Never married (%)
Marital status - Now married (%)
Marital status - Separated (%)
Marital status - Widowed (%)
Marital status - Divorced (%)
Ancestries Reported - Arab (%)
Ancestries Reported - Czech (%)
Ancestries Reported - Danish (%)
Ancestries Reported - Dutch (%)
Ancestries Reported - English (%)
Ancestries Reported - French (%)
Ancestries Reported - French Canadian (%)
Ancestries Reported - German (%)
Ancestries Reported - Greek (%)
Ancestries Reported - Hungarian (%)
Ancestries Reported - Irish (%)
Ancestries Reported - Italian (%)
Ancestries Reported - Lithuanian (%)
Ancestries Reported - Norwegian (%)
Ancestries Reported - Polish (%)
Ancestries Reported - Portuguese (%)
Ancestries Reported - Russian (%)
Ancestries Reported - Scotch-Irish (%)
Ancestries Reported - Scottish (%)
Ancestries Reported - Slovak (%)
Ancestries Reported - Subsaharan African (%)
Ancestries Reported - Swedish (%)
Ancestries Reported - Swiss (%)
Ancestries Reported - Ukrainian (%)
Ancestries Reported - United States (%)
Ancestries Reported - Welsh (%)
Ancestries Reported - West Indian (%)
Ancestries Reported - Other (%)
Geographical mobility - Same house 1 year ago (%)
Geographical mobility - Same house 1 year ago (%) - White
Geographical mobility - Same house 1 year ago (%) - Black or African American
Geographical mobility - Same house 1 year ago (%) - Asian
Geographical mobility - Same house 1 year ago (%) - Hispanic or Latino
Geographical mobility - Same house 1 year ago (%) - American Indian and Alaska Native
Geographical mobility - Same house 1 year ago (%) - Multirace
Geographical mobility - Same house 1 year ago (%) - Other Race
Geographical mobility - Moved within same county (%)
Geographical mobility - Moved within same county (%) - White
Geographical mobility - Moved within same county (%) - Black or African American
Geographical mobility - Moved within same county (%) - Asian
Geographical mobility - Moved within same county (%) - Hispanic or Latino
Geographical mobility - Moved within same county (%) - American Indian and Alaska Native
Geographical mobility - Moved within same county (%) - Multirace
Geographical mobility - Moved within same county (%) - Other Race
Geographical mobility - Moved from different county within same state (%)
Geographical mobility - Moved from different county within same state (%) - White
Geographical mobility - Moved from different county within same state (%) - Black or African American
Geographical mobility - Moved from different county within same state (%) - Asian
Geographical mobility - Moved from different county within same state (%) - Hispanic or Latino
Geographical mobility - Moved from different county within same state (%) - American Indian and Alaska Native
Geographical mobility - Moved from different county within same state (%) - Multirace
Geographical mobility - Moved from different county within same state (%) - Other Race
Geographical mobility - Moved from different state (%)
Geographical mobility - Moved from different state (%) - White
Geographical mobility - Moved from different state (%) - Black or African American
Geographical mobility - Moved from different state (%) - Asian
Geographical mobility - Moved from different state (%) - Hispanic or Latino
Geographical mobility - Moved from different state (%) - American Indian and Alaska Native
Geographical mobility - Moved from different state (%) - Multirace
Geographical mobility - Moved from different state (%) - Other Race
Geographical mobility - Moved from abroad (%)
Geographical mobility - Moved from abroad (%) - White
Geographical mobility - Moved from abroad (%) - Black or African American
Geographical mobility - Moved from abroad (%) - Asian
Geographical mobility - Moved from abroad (%) - Hispanic or Latino
Geographical mobility - Moved from abroad (%) - American Indian and Alaska Native
Geographical mobility - Moved from abroad (%) - Multirace
Geographical mobility - Moved from abroad (%) - Other Race
Place of birth for the foreign-born population - Ireland (%)
Place of birth for the foreign-born population - Denmark (%)
Place of birth for the foreign-born population - Norway (%)
Place of birth for the foreign-born population - Sweden (%)
Place of birth for the foreign-born population - United Kingdom (%)
Place of birth for the foreign-born population - England (%)
Place of birth for the foreign-born population - Scotland (%)
Place of birth for the foreign-born population - Other Northern Europe (%)
Place of birth for the foreign-born population - Austria (%)
Place of birth for the foreign-born population - Belgium (%)
Place of birth for the foreign-born population - France (%)
Place of birth for the foreign-born population - Germany (%)
Place of birth for the foreign-born population - Netherlands (%)
Place of birth for the foreign-born population - Switzerland (%)
Place of birth for the foreign-born population - Other Western Europe (%)
Place of birth for the foreign-born population - Greece (%)
Place of birth for the foreign-born population - Italy (%)
Place of birth for the foreign-born population - Portugal (%)
Place of birth for the foreign-born population - Spain (%)
Place of birth for the foreign-born population - Other Southern Europe (%)
Place of birth for the foreign-born population - Albania (%)
Place of birth for the foreign-born population - Belarus (%)
Place of birth for the foreign-born population - Bosnia and Herzegovina (%)
Place of birth for the foreign-born population - Bulgaria (%)
Place of birth for the foreign-born population - Croatia (%)
Place of birth for the foreign-born population - Czechoslovakia (%)
Place of birth for the foreign-born population - Hungary (%)
Place of birth for the foreign-born population - Latvia (%)
Place of birth for the foreign-born population - Lithuania (%)
Place of birth for the foreign-born population - North Macedonia (Macedonia) (%)
Place of birth for the foreign-born population - Moldova (%)
Place of birth for the foreign-born population - Poland (%)
Place of birth for the foreign-born population - Romania (%)
Place of birth for the foreign-born population - Russia (%)
Place of birth for the foreign-born population - Serbia (%)
Place of birth for the foreign-born population - Ukraine (%)
Place of birth for the foreign-born population - Other Eastern Europe (%)
Place of birth for the foreign-born population - China (%)
Place of birth for the foreign-born population - Hong Kong (%)
Place of birth for the foreign-born population - Taiwan (%)
Place of birth for the foreign-born population - Japan (%)
Place of birth for the foreign-born population - Korea (%)
Place of birth for the foreign-born population - Other Eastern Asia (%)
Place of birth for the foreign-born population - Afghanistan (%)
Place of birth for the foreign-born population - Bangladesh (%)
Place of birth for the foreign-born population - India (%)
Place of birth for the foreign-born population - Iran (%)
Place of birth for the foreign-born population - Kazakhstan (%)
Place of birth for the foreign-born population - Nepal (%)
Place of birth for the foreign-born population - Pakistan (%)
Place of birth for the foreign-born population - Sri Lanka (%)
Place of birth for the foreign-born population - Uzbekistan (%)
Place of birth for the foreign-born population - Other South Central Asia (%)
Place of birth for the foreign-born population - Burma (%)
Place of birth for the foreign-born population - Cambodia (%)
Place of birth for the foreign-born population - Indonesia (%)
Place of birth for the foreign-born population - Laos (%)
Place of birth for the foreign-born population - Malaysia (%)
Place of birth for the foreign-born population - Philippines (%)
Place of birth for the foreign-born population - Singapore (%)
Place of birth for the foreign-born population - Thailand (%)
Place of birth for the foreign-born population - Vietnam (%)
Place of birth for the foreign-born population - Other South Eastern Asia (%)
Place of birth for the foreign-born population - Armenia (%)
Place of birth for the foreign-born population - Iraq (%)
Place of birth for the foreign-born population - Israel (%)
Place of birth for the foreign-born population - Jordan (%)
Place of birth for the foreign-born population - Kuwait (%)
Place of birth for the foreign-born population - Lebanon (%)
Place of birth for the foreign-born population - Saudi Arabia (%)
Place of birth for the foreign-born population - Syria (%)
Place of birth for the foreign-born population - Turkey (%)
Place of birth for the foreign-born population - Yemen (%)
Place of birth for the foreign-born population - Other Western Asia (%)
Place of birth for the foreign-born population - Eritrea (%)
Place of birth for the foreign-born population - Ethiopia (%)
Place of birth for the foreign-born population - Kenya (%)
Place of birth for the foreign-born population - Somalia (%)
Place of birth for the foreign-born population - Uganda (%)
Place of birth for the foreign-born population - Zimbabwe (%)
Place of birth for the foreign-born population - Other Eastern Africa (%)
Place of birth for the foreign-born population - Cameroon (%)
Place of birth for the foreign-born population - Congo (%)
Place of birth for the foreign-born population - Democratic Republic of Congo (Zaire) (%)
Place of birth for the foreign-born population - Other Middle Africa (%)
Place of birth for the foreign-born population - Egypt (%)
Place of birth for the foreign-born population - Morocco (%)
Place of birth for the foreign-born population - Sudan (%)
Place of birth for the foreign-born population - Other Northern Africa (%)
Place of birth for the foreign-born population - South Africa (%)
Place of birth for the foreign-born population - Other Southern Africa (%)
Place of birth for the foreign-born population - Cabo Verde (%)
Place of birth for the foreign-born population - Ghana (%)
Place of birth for the foreign-born population - Liberia (%)
Place of birth for the foreign-born population - Nigeria (%)
Place of birth for the foreign-born population - Senegal (%)
Place of birth for the foreign-born population - Sierra Leone (%)
Place of birth for the foreign-born population - Other Western Africa (%)
Place of birth for the foreign-born population - Australia (%)
Place of birth for the foreign-born population - New Zealand (%)
Place of birth for the foreign-born population - Fiji (%)
Place of birth for the foreign-born population - Micronesia (%)
Place of birth for the foreign-born population - Bahamas (%)
Place of birth for the foreign-born population - Barbados (%)
Place of birth for the foreign-born population - Cuba (%)
Place of birth for the foreign-born population - Dominica (%)
Place of birth for the foreign-born population - Dominican Republic (%)
Place of birth for the foreign-born population - Grenada (%)
Place of birth for the foreign-born population - Haiti (%)
Place of birth for the foreign-born population - Jamaica (%)
Place of birth for the foreign-born population - St. Vincent and the Grenadines (%)
Place of birth for the foreign-born population - Trinidad and Tobago (%)
Place of birth for the foreign-born population - West Indies (%)
Place of birth for the foreign-born population - Other Caribbean (%)
Place of birth for the foreign-born population - Belize (%)
Place of birth for the foreign-born population - Costa Rica (%)
Place of birth for the foreign-born population - El Salvador (%)
Place of birth for the foreign-born population - Guatemala (%)
Place of birth for the foreign-born population - Honduras (%)
Place of birth for the foreign-born population - Mexico (%)
Place of birth for the foreign-born population - Nicaragua (%)
Place of birth for the foreign-born population - Panama (%)
Place of birth for the foreign-born population - Other Central America (%)
Place of birth for the foreign-born population - Argentina (%)
Place of birth for the foreign-born population - Bolivia (%)
Place of birth for the foreign-born population - Brazil (%)
Place of birth for the foreign-born population - Chile (%)
Place of birth for the foreign-born population - Colombia (%)
Place of birth for the foreign-born population - Ecuador (%)
Place of birth for the foreign-born population - Guyana (%)
Place of birth for the foreign-born population - Peru (%)
Place of birth for the foreign-born population - Uruguay (%)
Place of birth for the foreign-born population - Venezuela (%)
Place of birth for the foreign-born population - Other South America (%)
Place of birth for the foreign-born population - Canada (%)
Place of birth for the foreign-born population - Other Northern America (%)
Place of birth for the foreign-born population - Other (%)
Latest news about races in Portsmouth, NH collected exclusively by city-data.com from local newspapers, TV, and radio stations
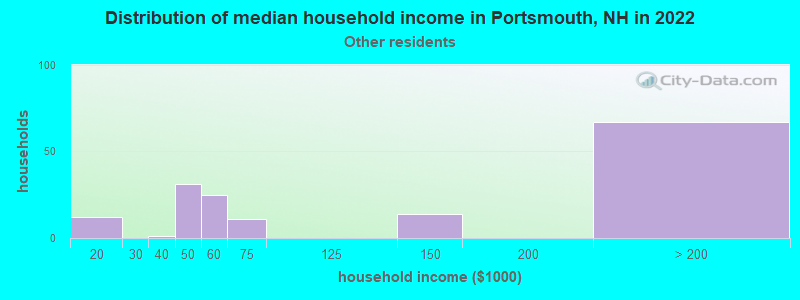
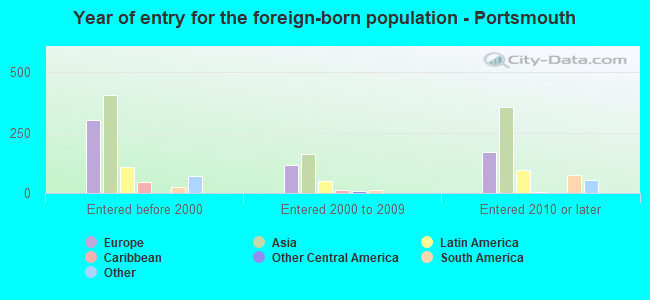
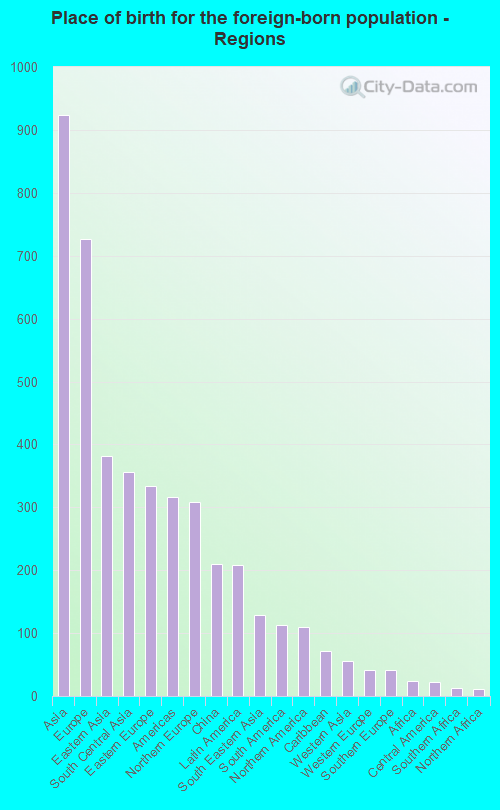
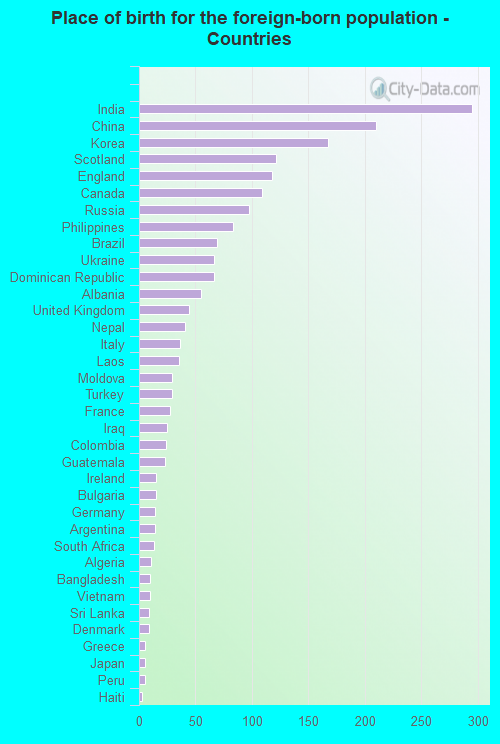
According to 2022 data, the most numerous races in Portsmouth, NH are White alone (19,417 residents), Hispanic (598 residents), and Two or more races (798 residents). 90.5% of Portsmouth residents speak English at home. 8.9% of Portsmouth, NH residents are foreign-born (4.1% born in Asia, 3.2% born in Europe, 0.9% born in Latin America), which is 43.7% greater than the foreign-born rate of 5.0% across the entire state of New Hampshire.
Race distribution in Portsmouth
2000 2022
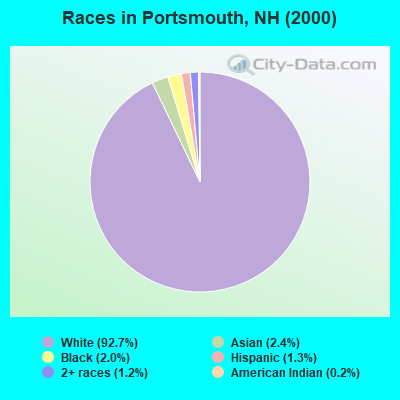
1,175,252 95.1% White alone 20,489 1.7% Hispanic 15,803 1.3% Asian alone 11,606 0.9% Two or more races 8,354 0.7% Black alone 2,698 0.2% American Indian alone 1,254 0.1% Other race alone 330 0.03% Native Hawaiian and Other
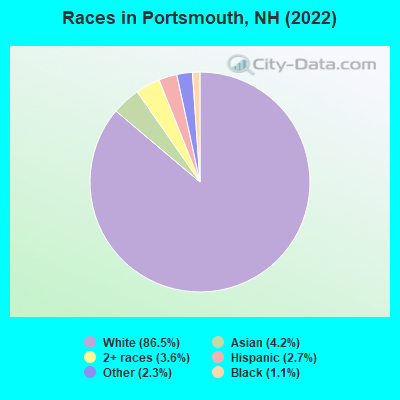
1,208,101 86.6% White alone 63,479 4.5% Hispanic 60,724 4.4% Two or more races 36,519 2.6% Asian alone 17,931 1.3% Black alone 6,615 0.5% Other race alone 1,014 0.07% American Indian alone 848 0.06% Native Hawaiian and Other
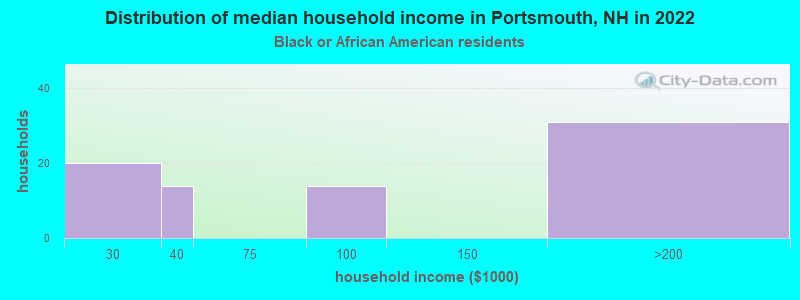
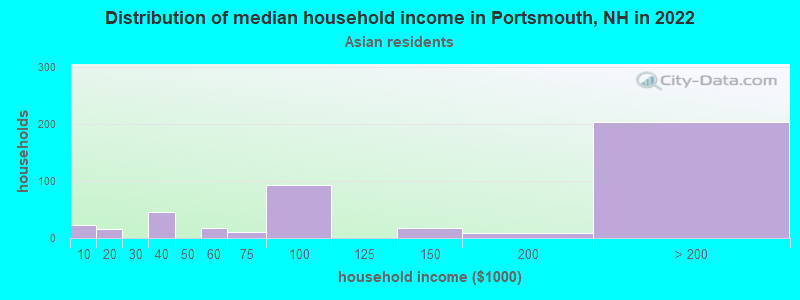
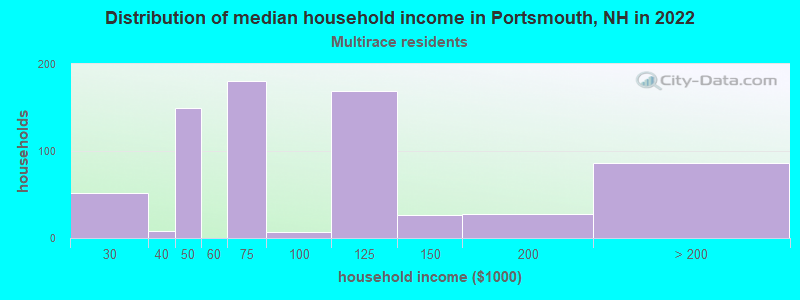
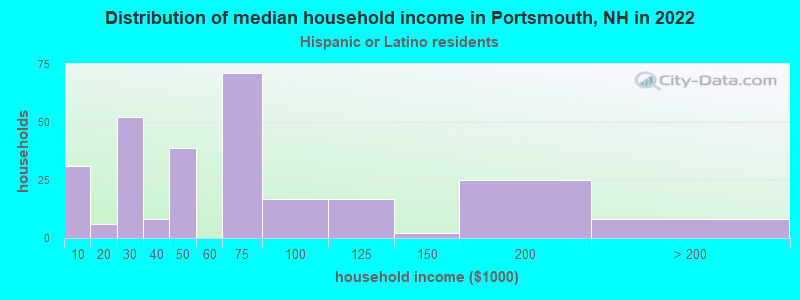
Income and house value in Portsmouth Median household income in 2022 $100,643 White non-Hispanic householders$85,989 Two or more races householders$39,589 Hispanic or Latino race householdersMedian 2022 house value $696,421 White Non-Hispanic householders$636,704 Black or African American householders $823,679 Asian householders$712,071 Some other race householders$604,992 Two or more races householders$716,601 Hispanic or Latino householders
Median age by race in Portsmouth
43.3 Median age for White residents42.3 44.8 52.9 Median age for Black or African American residents54.8 45.1 -859,452,735.5 Median age for American Indian / Alaska Native residents-772,357,722.8 -763,157,894.0 34.8 Median age for Asian residents31.8 34.3 -633,846,153.2 Median age for Native Hawaiian / Pacific Islander residents-666,666,666.0 -666,666,666.0 78.0 Median age for Other race residents52.4 69.9 36.6 Median age for Two or more races residents47.8 31.9 43.5 Median age for White alone residents42.1 45.1 35.0 Median age for Hispanic or Latino residents31.9 38.1
Owner/renter occupied households by race in Portsmouth
House owners and renters - White residents 5,120 54.4% Owner occupied4,285 45.6% Renter occupiedHouse owners and renters - Black or African American residents 25 17.9% Owner occupied113 82.1% Renter occupiedHouse owners and renters - Asian residents 58 14.1% Owner occupied350 85.9% Renter occupiedHouse owners and renters - Native Hawaiian / Pacific Islander residents 9 100.0% Owner occupiedHouse owners and renters - Other race residents 36 19.6% Owner occupied147 80.4% Renter occupiedHouse owners and renters - Two or more races residents 182 31.7% Owner occupied391 68.3% Renter occupiedHouse owners and renters - White alone residents 5,116 54.7% Owner occupied4,243 45.3% Renter occupiedHouse owners and renters - Hispanic or Latino residents 25 7.1% Owner occupied334 92.9% Renter occupied
Language usage in Portsmouth
English speakers - Total 90.5% of residents of Portsmouth speak English at home.
1.8% of residents speak Spanish at home 307 77.7% Speak English very well88 22.3% Speak English less than very well7.9% of residents speak other language at home 1,302 76.5% Speak English very well400 23.5% Speak English less than very well
English speakers - Born in the United States 96.4% of residents of Portsmouth speak English at home.
1.3% of residents speak Spanish at home 154 100.0% Speak English very well2.1% of residents speak other language at home 194 80.8% Speak English very well46 19.2% Speak English less than very well
English speakers - Native, born elsewhere 69.6% of residents of Portsmouth speak English at home.
41.4% of residents speak Spanish at home 89 90.8% Speak English very well9 9.2% Speak English less than very well4.2% of residents speak other language at home 10 100.0% Speak English very well
English speakers - Foreign-born 30.4% of residents of Portsmouth speak English at home.
6.7% of residents speak Spanish at home 38 27.1% Speak English very well102 72.9% Speak English less than very well61.3% of residents speak other language at home 925 72.3% Speak English very well355 27.7% Speak English less than very well
White (Caucasian) - Speak only English Native:
97.9% (17,339)Foreign-born:
51.9% (473)
White (Caucasian) - Speak another language Native:
2.1% (365)Foreign-born:
47.4% (432)
Black or African American - Speak only English Native:
90.6% (233)Foreign-born:
6.4% (3)
Black or African American - Speak another language Native:
10.0% (26)Foreign-born:
70.1% (29)
Asian - Speak only English Native:
38.1% (43)Foreign-born:
11.1% (91)
Asian - Speak another language Native:
57.4% (64)Foreign-born:
91.7% (751)
Other race - Speak only English Native:
100.0% (481)Foreign-born:
15.1% (19)
Other race - Speak another language Native:
3.9% (19)Foreign-born:
66.8% (86)
Two or more races - Speak only English Native:
82.8% (845)Foreign-born:
55.7% (72)
Two or more races - Speak another language Native:
15.0% (153)Foreign-born:
45.1% (59)
White alone - Speak only English Native:
97.9% (17,289)Foreign-born:
48.4% (452)
White alone - Speak another language Native:
2.1% (367)Foreign-born:
50.1% (469)
Hispanic or Latino - Speak only English Native:
49.6% (182)Foreign-born:
27.4% (62)
Hispanic or Latino - Speak another language Native:
53.3% (195)Foreign-born:
74.5% (169)
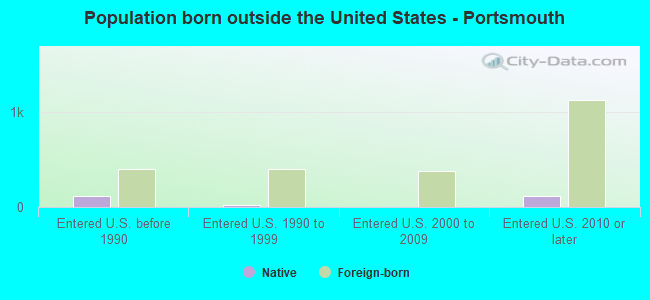
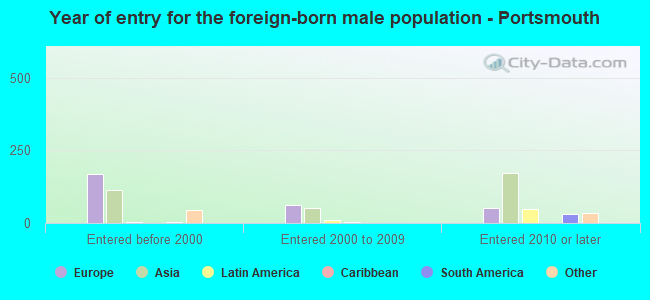
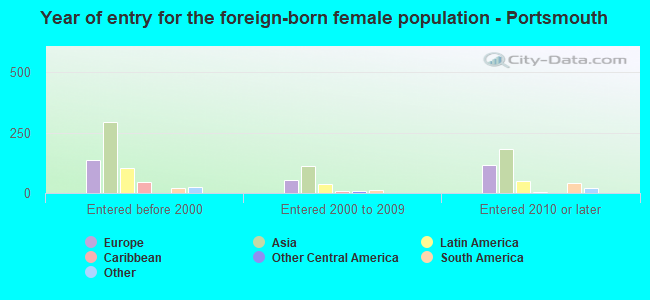
Foreign-born residents in Portsmouth 1,992 residents are foreign born (4.1% Asia , 3.2% Europe , 0.9% Latin America ).
This city:
8.9%New Hampshire:
6.0%
Marital status for residents in Portsmouth Marital status - White (Caucasian) population 15 years and over
Males 37.1% Never married47.4% Now married0.6% Separated2.6% Widowed12.3% DivorcedFemales 29.4% Never married46.9% Now married1.4% Separated9.5% Widowed12.8% DivorcedWomen who gave birth in the past 12 months Now married:
59.7% (149)Unmarried:
40.3% (101)
Women who did not give birth in the past 12 months Now married:
41.4% (1,667)Unmarried:
58.6% (2,361)
Marital status - Black or African American population 15 years and over
Males 40.8% Never married56.3% Now married1.9% Separated0.0% Widowed1.0% DivorcedFemales 40.8% Never married32.7% Now married0.0% Separated20.9% Widowed5.7% DivorcedWomen who did not give birth in the past 12 months Now married:
18.3% (21)Unmarried:
81.7% (96)
Marital status - Asian population 15 years and over
Males 44.1% Never married55.9% Now married0.0% Separated0.0% Widowed0.0% DivorcedFemales 43.9% Never married28.7% Now married0.0% Separated19.5% Widowed7.9% DivorcedWomen who gave birth in the past 12 months Now married:
100.0% (10)Unmarried:
0.0% (0)
Women who did not give birth in the past 12 months Now married:
27.7% (109)Unmarried:
72.3% (283)
Marital status - Other race population 15 years and over
Males 44.5% Never married19.3% Now married10.9% Separated13.4% Widowed11.8% DivorcedFemales 20.0% Never married76.3% Now married0.0% Separated3.7% Widowed0.0% DivorcedWomen who did not give birth in the past 12 months Now married:
0.0% (0)Unmarried:
100.0% (96)
Marital status - Two or more races population 15 years and over
Males 47.7% Never married36.6% Now married0.0% Separated0.0% Widowed15.7% DivorcedFemales 56.1% Never married35.0% Now married4.8% Separated0.0% Widowed4.1% DivorcedWomen who gave birth in the past 12 months Now married:
100.0% (31)Unmarried:
0.0% (0)
Women who did not give birth in the past 12 months Now married:
3.7% (14)Unmarried:
96.3% (359)
Marital status - White alone, not Hispanic / Latino population 15 years and over
Males 37.0% Never married47.6% Now married0.5% Separated2.6% Widowed12.3% DivorcedFemales 29.0% Never married47.1% Now married1.4% Separated9.6% Widowed12.9% DivorcedWomen who gave birth in the past 12 months Now married:
59.7% (150)Unmarried:
40.3% (101)
Women who did not give birth in the past 12 months Now married:
41.9% (1,664)Unmarried:
58.1% (2,312)
Marital status - Hispanic or Latino population 15 years and over
Males 66.7% Never married21.7% Now married3.7% Separated2.1% Widowed5.8% DivorcedFemales 44.2% Never married19.1% Now married9.2% Separated19.1% Widowed8.5% DivorcedWomen who gave birth in the past 12 months Now married:
100.0% (24)Unmarried:
0.0% (0)
Women who did not give birth in the past 12 months Now married:
9.7% (18)Unmarried:
90.3% (170)
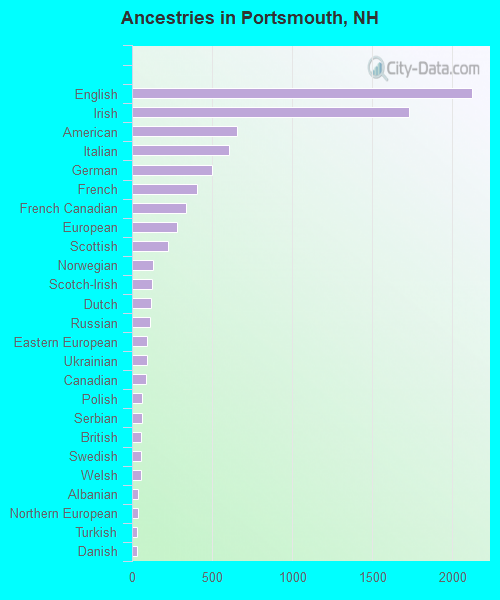
Ancestries in Portsmouth
2,122 21.5% English1,727 17.5% Irish656 6.7% American606 6.1% Italian497 5.0% German407 4.1% French340 3.4% French Canadian280 2.8% European225 2.3% Scottish130 1.3% Norwegian125 1.3% Scotch-Irish118 1.2% Dutch113 1.1% Russian92 0.9% Eastern European91 0.9% Ukrainian86 0.9% Canadian64 0.6% Polish61 0.6% Serbian58 0.6% British57 0.6% Swedish55 0.6% Welsh40 0.4% Albanian38 0.4% Northern European31 0.3% Turkish30 0.3% Danish29 0.3% Romanian28 0.3% Iraqi26 0.3% Slovak20 0.2% Greek19 0.2% Estonian18 0.2% Lithuanian18 0.2% Brazilian17 0.2% Czech17 0.2% Swiss15 0.2% Croatian14 0.1% Bulgarian11 0.1% Syrian11 0.1% Finnish10 0.1% Cajun9 0.09% Palestinian9 0.09% Scandinavian8 0.08% Hungarian8 0.08% Slovene6 0.06% Belgian5 0.05% Lebanese4 0.04% Armenian4 0.04% South African3 0.03% Haitian2 0.02% Jamaican
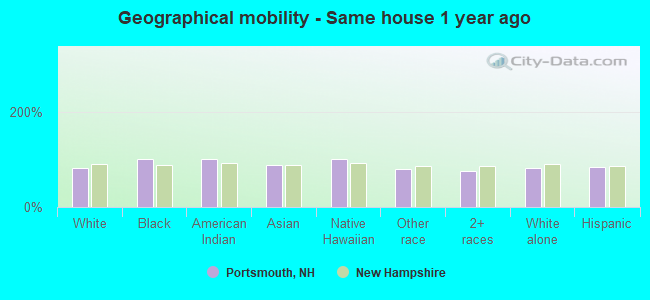
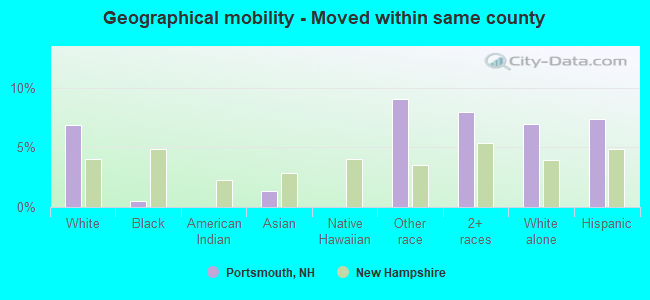
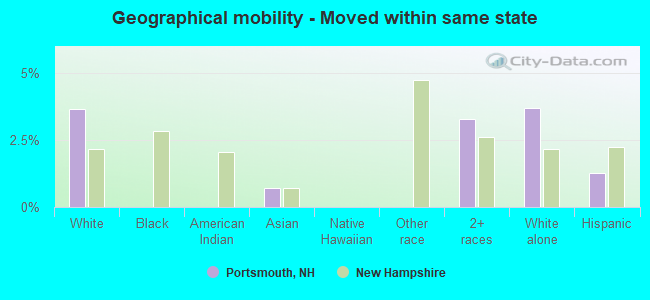
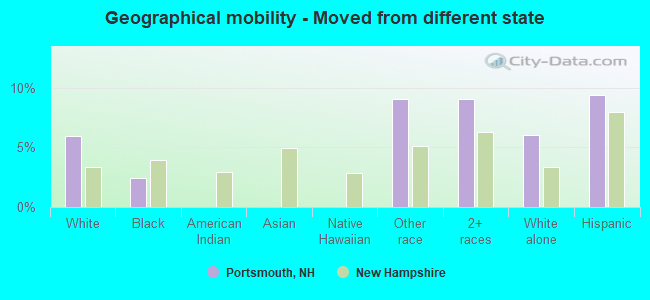
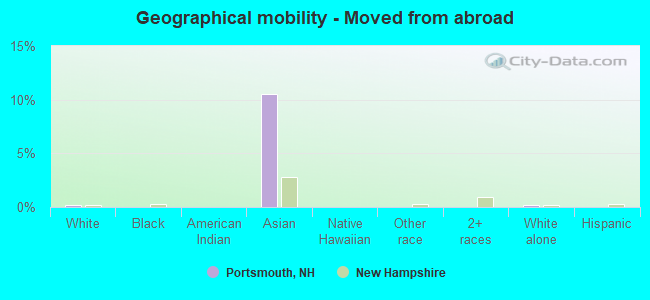
Geographical mobility in Portsmouth Same house 1 year ago 15,829 82.5% White (Caucasian)315 100.0% Black or African American12 100.0% American Indian / Alaska Native828 86.9% Asian9 100.0% Native Hawaiian / Pacific Islander530 79.0% Other race840 74.5% Two or more races15,760 82.3% White alone, not Hispanic / Latino468 82.6% Hispanic or LatinoMoved within same county 1,318 6.9% White / Caucasian2 0.5% Black or African American13 1.3% Asian61 9.1% Other race90 8.0% Two or more races1,326 6.9% White alone, not Hispanic / Latino42 7.4% Hispanic or LatinoMoved within same state 704 3.7% White / Caucasian7 0.7% Asian37 3.3% Two or more races708 3.7% White alone, not Hispanic / Latino7 1.3% Hispanic or LatinoMoved from different state 1,145 6.0% White / Caucasian7 2.4% Black or African American61 9.1% Other race102 9.0% Two or more races1,152 6.0% White alone, not Hispanic / Latino53 9.4% Hispanic or LatinoMoved from abroad 33 0.2% White100 10.5% Asian38 0.2% White alone, not Hispanic / Latino
Children Nativity (place of birth) in Portsmouth
Children under 6 years - Living with two parents Both parents native 609 100.0% NativeBoth parents foreign-born 86 100.0% Foreign-bornOne native, one foreign-born parent 68 100.0% NativeChildren under 6 years - Living with one parent Native parent 240 100.0% NativeForeign-born parent 30 100.0% NativeChildren 6 to 17 years - Living with two parents Both parents native 1,359 99.9% Native1 0.1% Foreign-bornBoth parents foreign-born 24 22.4% Native82 77.6% Foreign-bornOne native, one foreign-born parent 227 79.7% Native58 20.3% Foreign-bornChildren 6 to 17 years - Living with one parent Native parent 299 100.0% NativeForeign-born parent 121 50.0% Native121 50.0% Foreign-born
Grandparents responsible for own grandchildren in Portsmouth
Grandparents (30 to 59 years) White / Caucasian 11 15.6% Responsible for grandchildren58 84.4% Not responsible for grandchildrenWhite alone, not Hispanic / Latino 11 24.4% Responsible for grandchildren34 75.6% Not responsible for grandchildrenGrandparents (60 years and over) White / Caucasian 12 81.9% Responsible for grandchildren3 18.1% Not responsible for grandchildrenWhite alone, not Hispanic / Latino 12 82.0% Responsible for grandchildren3 18.0% Not responsible for grandchildren