Races in Poteau, Oklahoma (OK) Detailed Stats
Data:
Races - White alone (%)
Races - White alone (% change since 2000)
Races - Black alone (%)
Races - Black alone (% change since 2000)
Races - American Indian alone (%)
Races - American Indian alone (% change since 2000)
Races - Asian alone (%)
Races - Asian alone (% change since 2000)
Races - Hispanic (%)
Races - Hispanic (% change since 2000)
Races - Native Hawaiian and Other Pacific Islander alone (%)
Races - Native Hawaiian and Other Pacific Islander alone (% change since 2000)
Races - Two or more races(%)
Races - Two or more races(% change since 2000)
Races - Other race alone (%)
Races - Other race alone (% change since 2000)
Racial diversity
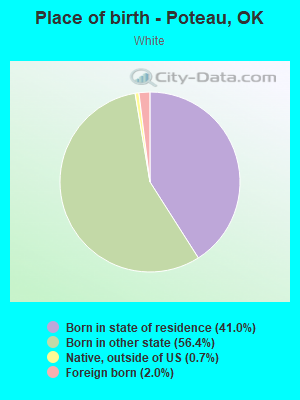
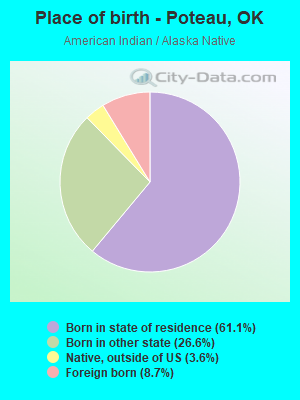
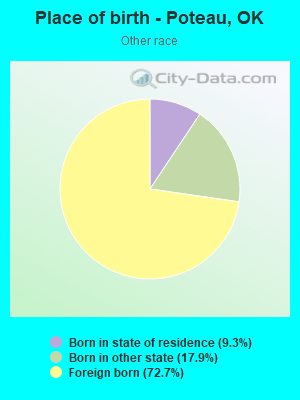
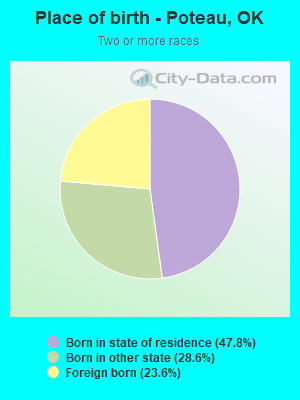
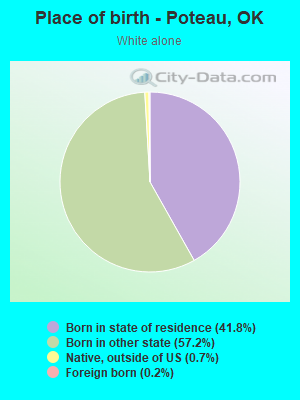
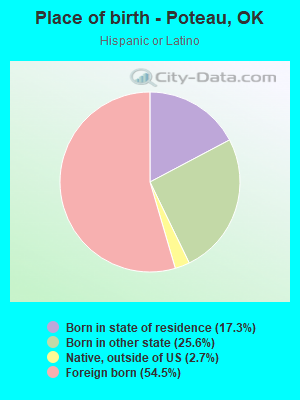
Place of birth - Born in state of residence (%)
Place of birth - Born in state of residence (%) - White
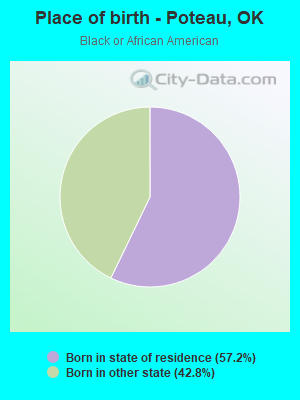
Place of birth - Born in state of residence (%) - Black or African American
Place of birth - Born in state of residence (%) - Asian
Place of birth - Born in state of residence (%) - Hispanic or Latino
Place of birth - Born in state of residence (%) - American Indian and Alaska Native
Place of birth - Born in state of residence (%) - Multirace
Place of birth - Born in state of residence (%) - Other Race
Place of birth - Born in other state (%)
Place of birth - Born in other state (%) - White
Place of birth - Born in other state (%) - Black or African American
Place of birth - Born in other state (%) - Asian
Place of birth - Born in other state (%) - Hispanic or Latino
Place of birth - Born in other state (%) - American Indian and Alaska Native
Place of birth - Born in other state (%) - Multirace
Place of birth - Born in other state (%) - Other Race
Place of birth - Native, outside of US (%)
Place of birth - Native, outside of US (%) - White
Place of birth - Native, outside of US (%) - Black or African American
Place of birth - Native, outside of US (%) - Asian
Place of birth - Native, outside of US (%) - Hispanic or Latino
Place of birth - Native, outside of US (%) - American Indian and Alaska Native
Place of birth - Native, outside of US (%) - Multirace
Place of birth - Native, outside of US (%) - Other Race
Place of birth - Foreign born (%)
Place of birth - Foreign born (%) - White
Place of birth - Foreign born (%) - Black or African American
Place of birth - Foreign born (%) - Asian
Place of birth - Foreign born (%) - Hispanic or Latino
Place of birth - Foreign born (%) - American Indian and Alaska Native
Place of birth - Foreign born (%) - Multirace
Place of birth - Foreign born (%) - Other Race
Residents speaking English at home (%)
Residents speaking English at home - Born in the United States (%)
Residents speaking English at home - Native, born elsewhere (%)
Residents speaking English at home - Foreign born (%)
Residents speaking Spanish at home (%)
Residents speaking Spanish at home - Born in the United States (%)
Residents speaking Spanish at home - Native, born elsewhere (%)
Residents speaking Spanish at home - Foreign born (%)
Residents speaking other language at home (%)
Residents speaking other language at home - Born in the United States (%)
Residents speaking other language at home - Native, born elsewhere (%)
Residents speaking other language at home - Foreign born (%)
Marital status - Never married (%)
Marital status - Now married (%)
Marital status - Separated (%)
Marital status - Widowed (%)
Marital status - Divorced (%)
Ancestries Reported - Arab (%)
Ancestries Reported - Czech (%)
Ancestries Reported - Danish (%)
Ancestries Reported - Dutch (%)
Ancestries Reported - English (%)
Ancestries Reported - French (%)
Ancestries Reported - French Canadian (%)
Ancestries Reported - German (%)
Ancestries Reported - Greek (%)
Ancestries Reported - Hungarian (%)
Ancestries Reported - Irish (%)
Ancestries Reported - Italian (%)
Ancestries Reported - Lithuanian (%)
Ancestries Reported - Norwegian (%)
Ancestries Reported - Polish (%)
Ancestries Reported - Portuguese (%)
Ancestries Reported - Russian (%)
Ancestries Reported - Scotch-Irish (%)
Ancestries Reported - Scottish (%)
Ancestries Reported - Slovak (%)
Ancestries Reported - Subsaharan African (%)
Ancestries Reported - Swedish (%)
Ancestries Reported - Swiss (%)
Ancestries Reported - Ukrainian (%)
Ancestries Reported - United States (%)
Ancestries Reported - Welsh (%)
Ancestries Reported - West Indian (%)
Ancestries Reported - Other (%)
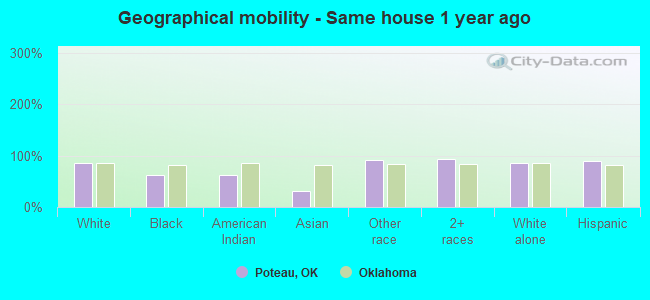
Geographical mobility - Same house 1 year ago (%)
Geographical mobility - Same house 1 year ago (%) - White
Geographical mobility - Same house 1 year ago (%) - Black or African American
Geographical mobility - Same house 1 year ago (%) - Asian
Geographical mobility - Same house 1 year ago (%) - Hispanic or Latino
Geographical mobility - Same house 1 year ago (%) - American Indian and Alaska Native
Geographical mobility - Same house 1 year ago (%) - Multirace
Geographical mobility - Same house 1 year ago (%) - Other Race
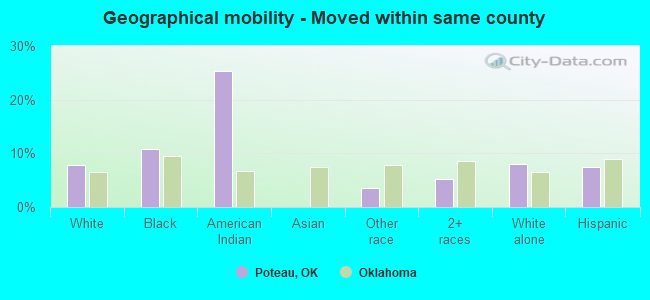
Geographical mobility - Moved within same county (%)
Geographical mobility - Moved within same county (%) - White
Geographical mobility - Moved within same county (%) - Black or African American
Geographical mobility - Moved within same county (%) - Asian
Geographical mobility - Moved within same county (%) - Hispanic or Latino
Geographical mobility - Moved within same county (%) - American Indian and Alaska Native
Geographical mobility - Moved within same county (%) - Multirace
Geographical mobility - Moved within same county (%) - Other Race
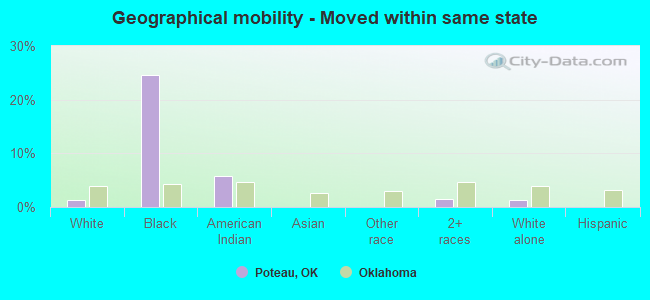
Geographical mobility - Moved from different county within same state (%)
Geographical mobility - Moved from different county within same state (%) - White
Geographical mobility - Moved from different county within same state (%) - Black or African American
Geographical mobility - Moved from different county within same state (%) - Asian
Geographical mobility - Moved from different county within same state (%) - Hispanic or Latino
Geographical mobility - Moved from different county within same state (%) - American Indian and Alaska Native
Geographical mobility - Moved from different county within same state (%) - Multirace
Geographical mobility - Moved from different county within same state (%) - Other Race
Geographical mobility - Moved from different state (%)
Geographical mobility - Moved from different state (%) - White
Geographical mobility - Moved from different state (%) - Black or African American
Geographical mobility - Moved from different state (%) - Asian
Geographical mobility - Moved from different state (%) - Hispanic or Latino
Geographical mobility - Moved from different state (%) - American Indian and Alaska Native
Geographical mobility - Moved from different state (%) - Multirace
Geographical mobility - Moved from different state (%) - Other Race
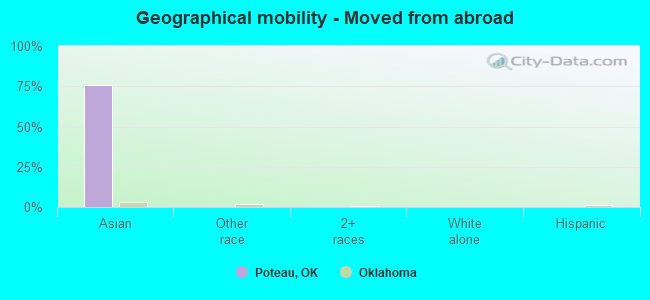
Geographical mobility - Moved from abroad (%)
Geographical mobility - Moved from abroad (%) - White
Geographical mobility - Moved from abroad (%) - Black or African American
Geographical mobility - Moved from abroad (%) - Asian
Geographical mobility - Moved from abroad (%) - Hispanic or Latino
Geographical mobility - Moved from abroad (%) - American Indian and Alaska Native
Geographical mobility - Moved from abroad (%) - Multirace
Geographical mobility - Moved from abroad (%) - Other Race
Place of birth for the foreign-born population - Ireland (%)
Place of birth for the foreign-born population - Denmark (%)
Place of birth for the foreign-born population - Norway (%)
Place of birth for the foreign-born population - Sweden (%)
Place of birth for the foreign-born population - United Kingdom (%)
Place of birth for the foreign-born population - England (%)
Place of birth for the foreign-born population - Scotland (%)
Place of birth for the foreign-born population - Other Northern Europe (%)
Place of birth for the foreign-born population - Austria (%)
Place of birth for the foreign-born population - Belgium (%)
Place of birth for the foreign-born population - France (%)
Place of birth for the foreign-born population - Germany (%)
Place of birth for the foreign-born population - Netherlands (%)
Place of birth for the foreign-born population - Switzerland (%)
Place of birth for the foreign-born population - Other Western Europe (%)
Place of birth for the foreign-born population - Greece (%)
Place of birth for the foreign-born population - Italy (%)
Place of birth for the foreign-born population - Portugal (%)
Place of birth for the foreign-born population - Spain (%)
Place of birth for the foreign-born population - Other Southern Europe (%)
Place of birth for the foreign-born population - Albania (%)
Place of birth for the foreign-born population - Belarus (%)
Place of birth for the foreign-born population - Bosnia and Herzegovina (%)
Place of birth for the foreign-born population - Bulgaria (%)
Place of birth for the foreign-born population - Croatia (%)
Place of birth for the foreign-born population - Czechoslovakia (%)
Place of birth for the foreign-born population - Hungary (%)
Place of birth for the foreign-born population - Latvia (%)
Place of birth for the foreign-born population - Lithuania (%)
Place of birth for the foreign-born population - North Macedonia (Macedonia) (%)
Place of birth for the foreign-born population - Moldova (%)
Place of birth for the foreign-born population - Poland (%)
Place of birth for the foreign-born population - Romania (%)
Place of birth for the foreign-born population - Russia (%)
Place of birth for the foreign-born population - Serbia (%)
Place of birth for the foreign-born population - Ukraine (%)
Place of birth for the foreign-born population - Other Eastern Europe (%)
Place of birth for the foreign-born population - China (%)
Place of birth for the foreign-born population - Hong Kong (%)
Place of birth for the foreign-born population - Taiwan (%)
Place of birth for the foreign-born population - Japan (%)
Place of birth for the foreign-born population - Korea (%)
Place of birth for the foreign-born population - Other Eastern Asia (%)
Place of birth for the foreign-born population - Afghanistan (%)
Place of birth for the foreign-born population - Bangladesh (%)
Place of birth for the foreign-born population - India (%)
Place of birth for the foreign-born population - Iran (%)
Place of birth for the foreign-born population - Kazakhstan (%)
Place of birth for the foreign-born population - Nepal (%)
Place of birth for the foreign-born population - Pakistan (%)
Place of birth for the foreign-born population - Sri Lanka (%)
Place of birth for the foreign-born population - Uzbekistan (%)
Place of birth for the foreign-born population - Other South Central Asia (%)
Place of birth for the foreign-born population - Burma (%)
Place of birth for the foreign-born population - Cambodia (%)
Place of birth for the foreign-born population - Indonesia (%)
Place of birth for the foreign-born population - Laos (%)
Place of birth for the foreign-born population - Malaysia (%)
Place of birth for the foreign-born population - Philippines (%)
Place of birth for the foreign-born population - Singapore (%)
Place of birth for the foreign-born population - Thailand (%)
Place of birth for the foreign-born population - Vietnam (%)
Place of birth for the foreign-born population - Other South Eastern Asia (%)
Place of birth for the foreign-born population - Armenia (%)
Place of birth for the foreign-born population - Iraq (%)
Place of birth for the foreign-born population - Israel (%)
Place of birth for the foreign-born population - Jordan (%)
Place of birth for the foreign-born population - Kuwait (%)
Place of birth for the foreign-born population - Lebanon (%)
Place of birth for the foreign-born population - Saudi Arabia (%)
Place of birth for the foreign-born population - Syria (%)
Place of birth for the foreign-born population - Turkey (%)
Place of birth for the foreign-born population - Yemen (%)
Place of birth for the foreign-born population - Other Western Asia (%)
Place of birth for the foreign-born population - Eritrea (%)
Place of birth for the foreign-born population - Ethiopia (%)
Place of birth for the foreign-born population - Kenya (%)
Place of birth for the foreign-born population - Somalia (%)
Place of birth for the foreign-born population - Uganda (%)
Place of birth for the foreign-born population - Zimbabwe (%)
Place of birth for the foreign-born population - Other Eastern Africa (%)
Place of birth for the foreign-born population - Cameroon (%)
Place of birth for the foreign-born population - Congo (%)
Place of birth for the foreign-born population - Democratic Republic of Congo (Zaire) (%)
Place of birth for the foreign-born population - Other Middle Africa (%)
Place of birth for the foreign-born population - Egypt (%)
Place of birth for the foreign-born population - Morocco (%)
Place of birth for the foreign-born population - Sudan (%)
Place of birth for the foreign-born population - Other Northern Africa (%)
Place of birth for the foreign-born population - South Africa (%)
Place of birth for the foreign-born population - Other Southern Africa (%)
Place of birth for the foreign-born population - Cabo Verde (%)
Place of birth for the foreign-born population - Ghana (%)
Place of birth for the foreign-born population - Liberia (%)
Place of birth for the foreign-born population - Nigeria (%)
Place of birth for the foreign-born population - Senegal (%)
Place of birth for the foreign-born population - Sierra Leone (%)
Place of birth for the foreign-born population - Other Western Africa (%)
Place of birth for the foreign-born population - Australia (%)
Place of birth for the foreign-born population - New Zealand (%)
Place of birth for the foreign-born population - Fiji (%)
Place of birth for the foreign-born population - Micronesia (%)
Place of birth for the foreign-born population - Bahamas (%)
Place of birth for the foreign-born population - Barbados (%)
Place of birth for the foreign-born population - Cuba (%)
Place of birth for the foreign-born population - Dominica (%)
Place of birth for the foreign-born population - Dominican Republic (%)
Place of birth for the foreign-born population - Grenada (%)
Place of birth for the foreign-born population - Haiti (%)
Place of birth for the foreign-born population - Jamaica (%)
Place of birth for the foreign-born population - St. Vincent and the Grenadines (%)
Place of birth for the foreign-born population - Trinidad and Tobago (%)
Place of birth for the foreign-born population - West Indies (%)
Place of birth for the foreign-born population - Other Caribbean (%)
Place of birth for the foreign-born population - Belize (%)
Place of birth for the foreign-born population - Costa Rica (%)
Place of birth for the foreign-born population - El Salvador (%)
Place of birth for the foreign-born population - Guatemala (%)
Place of birth for the foreign-born population - Honduras (%)
Place of birth for the foreign-born population - Mexico (%)
Place of birth for the foreign-born population - Nicaragua (%)
Place of birth for the foreign-born population - Panama (%)
Place of birth for the foreign-born population - Other Central America (%)
Place of birth for the foreign-born population - Argentina (%)
Place of birth for the foreign-born population - Bolivia (%)
Place of birth for the foreign-born population - Brazil (%)
Place of birth for the foreign-born population - Chile (%)
Place of birth for the foreign-born population - Colombia (%)
Place of birth for the foreign-born population - Ecuador (%)
Place of birth for the foreign-born population - Guyana (%)
Place of birth for the foreign-born population - Peru (%)
Place of birth for the foreign-born population - Uruguay (%)
Place of birth for the foreign-born population - Venezuela (%)
Place of birth for the foreign-born population - Other South America (%)
Place of birth for the foreign-born population - Canada (%)
Place of birth for the foreign-born population - Other Northern America (%)
Place of birth for the foreign-born population - Other (%)
Latest news about races in Poteau, OK collected exclusively by city-data.com from local newspapers, TV, and radio stations
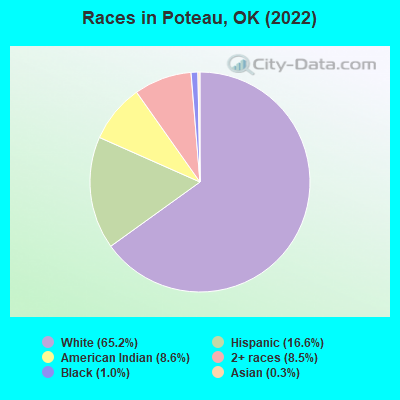
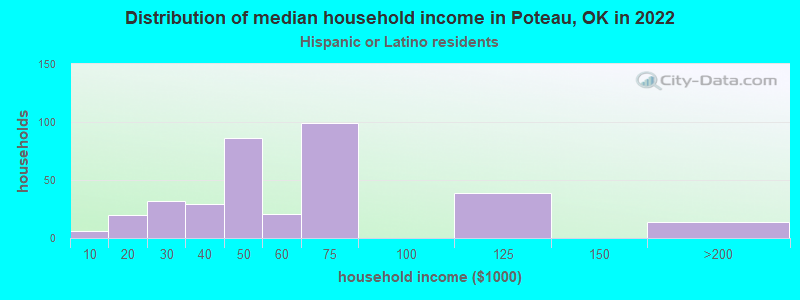
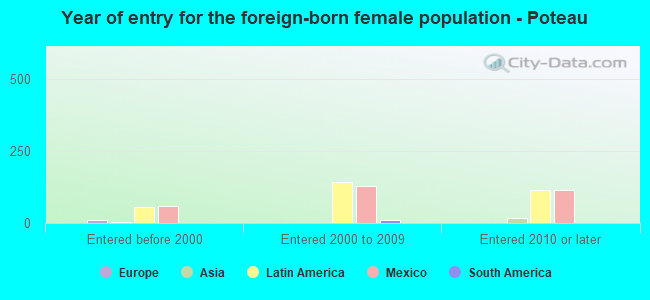
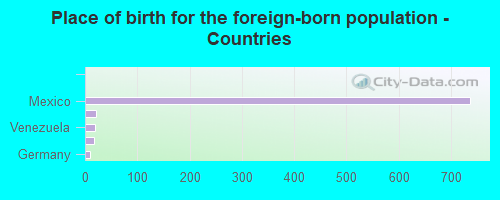
According to 2022 data, the most numerous races in Poteau, OK are White alone (5,845 residents), Hispanic (1,490 residents), and Two or more races (765 residents). 86.8% of Poteau residents speak English at home. 9.1% of Poteau, OK residents are foreign-born (8.8% born in Latin America), which is 34.1% greater than the foreign-born rate of 6.0% across the entire state of Oklahoma.
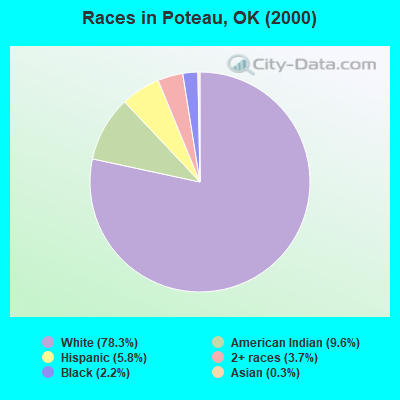
Race distribution in Poteau
2000 2022
2,556,368 74.1% White alone 266,158 7.7% American Indian alone 257,981 7.5% Black alone 179,304 5.2% Hispanic 140,249 4.1% Two or more races 46,172 1.3% Asian alone 2,322 0.07% Other race alone 2,100 0.06% Native Hawaiian and Other
2,517,403 62.6% White alone 486,692 12.1% Hispanic 364,453 9.1% Two or more races 273,650 6.8% American Indian alone 268,543 6.7% Black alone 92,672 2.3% Asian alone 10,786 0.3% Other race alone 5,601 0.1% Native Hawaiian and Other
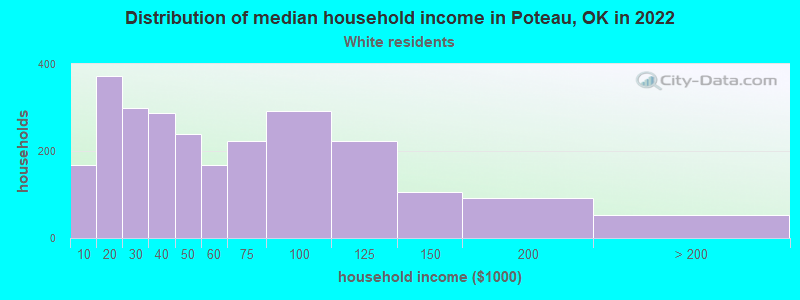
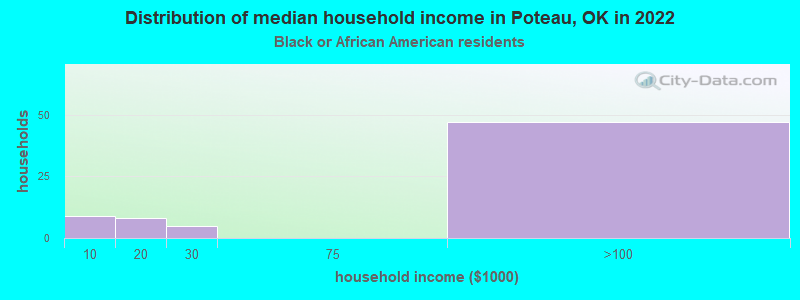
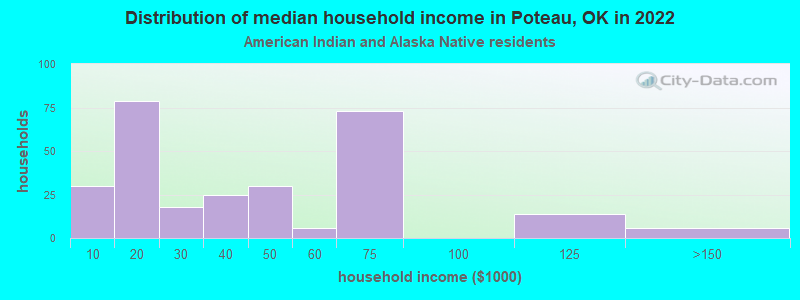
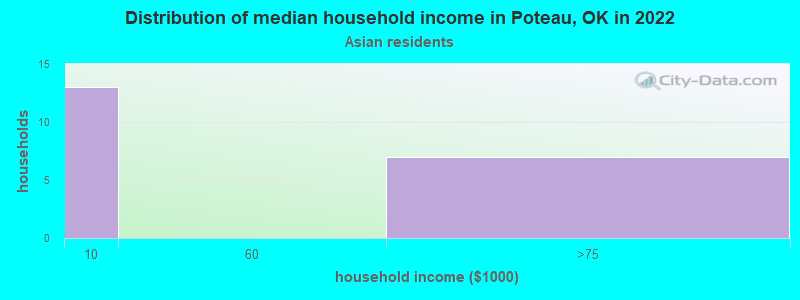
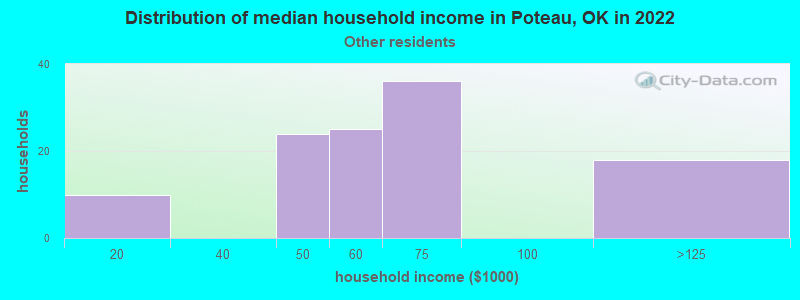
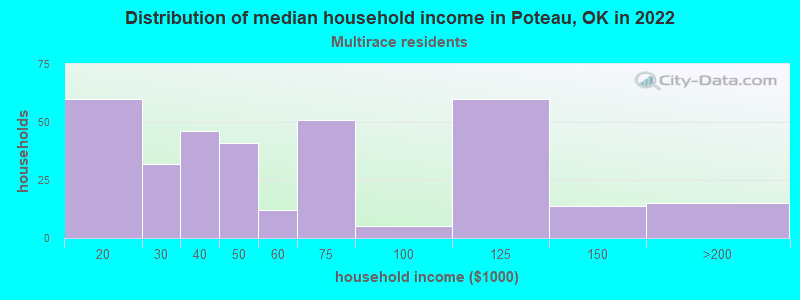
Income and house value in Poteau Median household income in 2022 $46,433 White non-Hispanic householders$32,983 American Indian and Alaska Native householders$2,396 Asian householders$55,410 Some other race householders$41,046 Two or more races householders$49,246 Hispanic or Latino race householdersMedian 2022 house value $155,608 White Non-Hispanic householders$163,858 American Indian or Alaska Native householders$156,462 Some other race householders$104,971 Two or more races householders$148,212 Hispanic or Latino householders
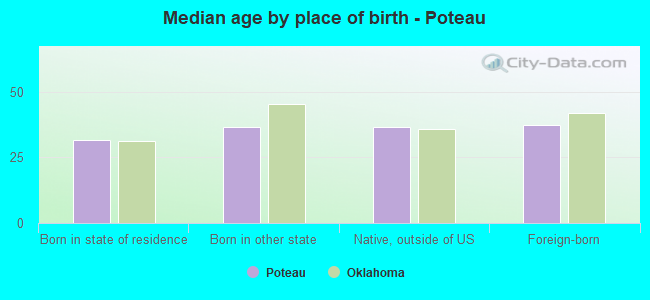
Median age by race in Poteau
38.8 Median age for White residents40.3 36.3 25.2 Median age for Black or African American residents31.7 23.3 31.2 Median age for American Indian / Alaska Native residents28.7 32.3 66.0 Median age for Asian residents-662,601,625.4 60.9 -725,225,224.5 Median age for Native Hawaiian / Pacific Islander residents-675,324,674.6 -767,251,461.2 28.4 Median age for Other race residents27.9 30.5 24.5 Median age for Two or more races residents24.4 19.6 38.5 Median age for White alone residents41.2 35.7 28.8 Median age for Hispanic or Latino residents29.2 22.4
Owner/renter occupied households by race in Poteau
House owners and renters - White residents 1,540 61.6% Owner occupied958 38.4% Renter occupiedHouse owners and renters - Black or African American residents 7 76.6% Owner occupied2 23.4% Renter occupiedHouse owners and renters - American Indian / Alaska Native residents 116 43.3% Owner occupied152 56.7% Renter occupiedHouse owners and renters - Asian residents 13 68.6% Owner occupied6 31.4% Renter occupiedHouse owners and renters - Other race residents 70 64.1% Owner occupied39 35.9% Renter occupiedHouse owners and renters - Two or more races residents 159 46.8% Owner occupied180 53.2% Renter occupiedHouse owners and renters - White alone residents 1,485 61.0% Owner occupied948 39.0% Renter occupiedHouse owners and renters - Hispanic or Latino residents 212 60.9% Owner occupied137 39.1% Renter occupied
Language usage in Poteau
English speakers - Total 86.8% of residents of Poteau speak English at home.
12.9% of residents speak Spanish at home 541 49.5% Speak English very well551 50.5% Speak English less than very well0.6% of residents speak other language at home 25 51.0% Speak English very well24 49.0% Speak English less than very well
English speakers - Born in the United States 93.4% of residents of Poteau speak English at home.
6.2% of residents speak Spanish at home 233 90.7% Speak English very well24 9.3% Speak English less than very well0.4% of residents speak other language at home 15 100.0% Speak English very well
English speakers - Native, born elsewhere 95.2% of residents of Poteau speak English at home.
English speakers - Foreign-born 7.7% of residents of Poteau speak English at home.
90.6% of residents speak Spanish at home 205 28.6% Speak English very well512 71.4% Speak English less than very well3.0% of residents speak other language at home 24 100.0% Speak English less than very well
White (Caucasian) - Speak only English Native:
99.1% (5,648)Foreign-born:
7.5% (9)
White (Caucasian) - Speak another language Native:
1.4% (78)Foreign-born:
79.7% (96)
American Indian / Alaska Native - Speak another language Native:
4.5% (34)Foreign-born:
100.0% (79)
Other race - Speak only English Native:
22.0% (30)Foreign-born:
12.5% (45)
Other race - Speak another language Native:
79.5% (107)Foreign-born:
87.6% (320)
Two or more races - Speak only English Native:
80.1% (760)Foreign-born:
4.8% (16)
Two or more races - Speak another language Native:
21.9% (208)Foreign-born:
95.8% (310)
White alone - Speak only English Native:
99.8% (5,517)Foreign-born:
100.0% (9)
Hispanic or Latino - Speak only English Native:
45.1% (284)Foreign-born:
7.3% (57)
Hispanic or Latino - Speak another language Native:
54.6% (344)Foreign-born:
92.8% (730)
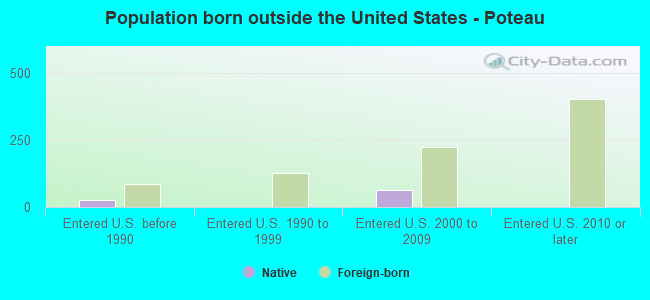
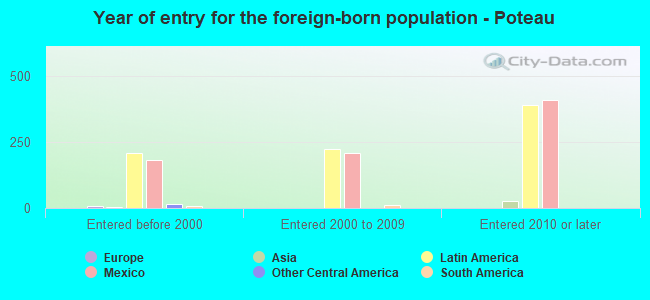
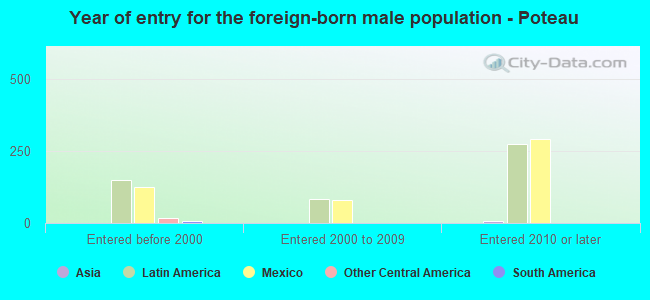
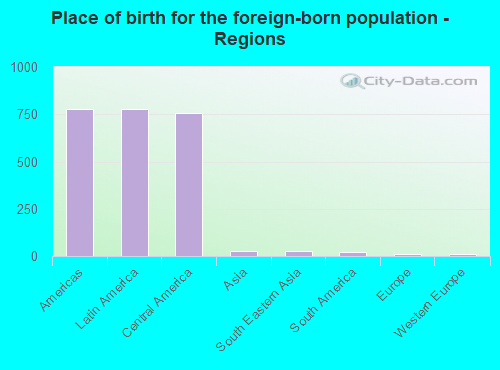
Foreign-born residents in Poteau 816 residents are foreign born (8.8% Latin America ).
This city:
9.1%Oklahoma:
6.1%
Marital status for residents in Poteau Marital status - White (Caucasian) population 15 years and over
Males 30.1% Never married40.1% Now married2.6% Separated7.8% Widowed19.4% DivorcedFemales 25.4% Never married41.6% Now married1.6% Separated13.3% Widowed18.1% DivorcedWomen who gave birth in the past 12 months Now married:
65.1% (27)Unmarried:
34.9% (14)
Women who did not give birth in the past 12 months Now married:
38.0% (497)Unmarried:
62.0% (809)
Marital status - Black or African American population 15 years and over
Males 83.7% Never married16.3% Now married0.0% Separated0.0% Widowed0.0% DivorcedFemales 61.9% Never married0.0% Now married0.0% Separated16.7% Widowed21.4% DivorcedWomen who did not give birth in the past 12 months Now married:
0.0% (0)Unmarried:
100.0% (25)
Marital status - American Indian / Alaska Native population 15 years and over
Males 35.8% Never married35.4% Now married5.6% Separated4.1% Widowed19.0% DivorcedFemales 45.9% Never married22.0% Now married4.1% Separated9.3% Widowed18.7% DivorcedWomen who gave birth in the past 12 months Now married:
32.7% (17)Unmarried:
67.3% (36)
Women who did not give birth in the past 12 months Now married:
16.9% (45)Unmarried:
83.1% (220)
Marital status - Asian population 15 years and over
Males 0.0% Never married100.0% Now married0.0% Separated0.0% Widowed0.0% DivorcedFemales 33.3% Never married47.6% Now married0.0% Separated19.0% Widowed0.0% DivorcedWomen who did not give birth in the past 12 months Now married:
0.0% (0)Unmarried:
100.0% (7)
Marital status - Other race population 15 years and over
Males 57.7% Never married42.3% Now married0.0% Separated0.0% Widowed0.0% DivorcedFemales 48.2% Never married51.8% Now married0.0% Separated0.0% Widowed0.0% DivorcedWomen who gave birth in the past 12 months Now married:
100.0% (12)Unmarried:
0.0% (0)
Women who did not give birth in the past 12 months Now married:
60.4% (71)Unmarried:
39.6% (46)
Marital status - Two or more races population 15 years and over
Males 40.6% Never married49.2% Now married2.2% Separated0.0% Widowed7.9% DivorcedFemales 39.0% Never married42.3% Now married3.9% Separated5.2% Widowed9.7% DivorcedWomen who did not give birth in the past 12 months Now married:
46.3% (143)Unmarried:
53.7% (166)
Marital status - White alone, not Hispanic / Latino population 15 years and over
Males 29.7% Never married39.5% Now married2.8% Separated8.5% Widowed19.5% DivorcedFemales 24.5% Never married41.0% Now married1.3% Separated13.9% Widowed19.2% DivorcedWomen who gave birth in the past 12 months Now married:
65.1% (28)Unmarried:
34.9% (15)
Women who did not give birth in the past 12 months Now married:
37.8% (476)Unmarried:
62.2% (782)
Marital status - Hispanic or Latino population 15 years and over
Males 53.0% Never married39.7% Now married0.0% Separated0.0% Widowed7.3% DivorcedFemales 43.6% Never married51.8% Now married2.3% Separated1.2% Widowed1.2% DivorcedWomen who gave birth in the past 12 months Now married:
22.2% (11)Unmarried:
77.8% (38)
Women who did not give birth in the past 12 months Now married:
56.2% (183)Unmarried:
43.8% (142)
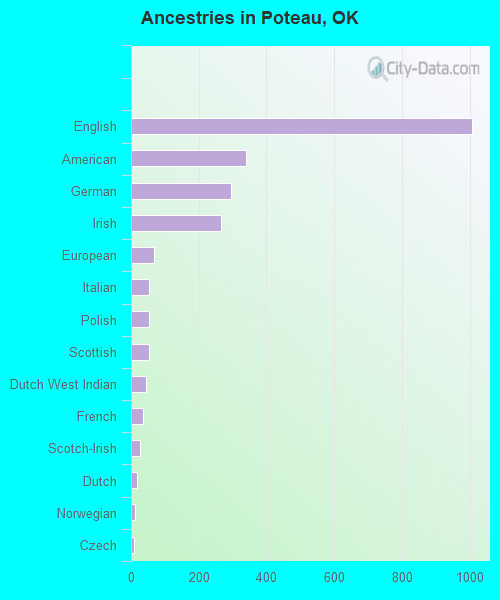
Ancestries in Poteau
1,007 20.0% English339 6.7% American294 5.8% German265 5.3% Irish67 1.3% European52 1.0% Italian52 1.0% Polish52 1.0% Scottish44 0.9% Dutch West Indian34 0.7% French27 0.5% Scotch-Irish19 0.4% Dutch13 0.3% Norwegian10 0.2% Czech6 0.1% African
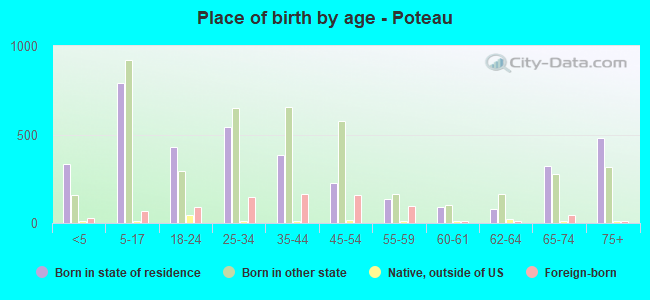
Children Nativity (place of birth) in Poteau
Children under 6 years - Living with two parents Both parents native 219 100.0% NativeBoth parents foreign-born 21 100.0% NativeOne native, one foreign-born parent 19 100.0% NativeChildren under 6 years - Living with one parent Native parent 348 91.9% Native31 8.1% Foreign-bornForeign-born parent 11 100.0% NativeChildren 6 to 17 years - Living with two parents Both parents native 602 99.7% Native2 0.3% Foreign-bornBoth parents foreign-born 106 62.2% Native64 37.8% Foreign-bornOne native, one foreign-born parent 42 100.0% NativeChildren 6 to 17 years - Living with one parent Native parent 512 100.0% NativeForeign-born parent 76 49.9% Native76 50.1% Foreign-born
Grandparents responsible for own grandchildren in Poteau
Grandparents (30 to 59 years) White / Caucasian 81 47.1% Responsible for grandchildren91 52.9% Not responsible for grandchildrenAmerican Indian / Alaska Native 4 100.0% Not responsible for grandchildrenTwo or more races 23 61.7% Responsible for grandchildren15 38.3% Not responsible for grandchildrenWhite alone, not Hispanic / Latino 84 57.3% Responsible for grandchildren63 42.7% Not responsible for grandchildrenHispanic or Latino 43 100.0% Not responsible for grandchildrenGrandparents (60 years and over) White / Caucasian 6 10.7% Responsible for grandchildren49 89.3% Not responsible for grandchildrenWhite alone, not Hispanic / Latino 6 10.2% Responsible for grandchildren51 89.8% Not responsible for grandchildrenHispanic or Latino 30 100.0% Not responsible for grandchildren