Races in Prescott Valley, Arizona (AZ) Detailed Stats
Data:
Races - White alone (%)
Races - White alone (% change since 2000)
Races - Black alone (%)
Races - Black alone (% change since 2000)
Races - American Indian alone (%)
Races - American Indian alone (% change since 2000)
Races - Asian alone (%)
Races - Asian alone (% change since 2000)
Races - Hispanic (%)
Races - Hispanic (% change since 2000)
Races - Native Hawaiian and Other Pacific Islander alone (%)
Races - Native Hawaiian and Other Pacific Islander alone (% change since 2000)
Races - Two or more races(%)
Races - Two or more races(% change since 2000)
Races - Other race alone (%)
Races - Other race alone (% change since 2000)
Racial diversity
Place of birth - Born in state of residence (%)
Place of birth - Born in state of residence (%) - White
Place of birth - Born in state of residence (%) - Black or African American
Place of birth - Born in state of residence (%) - Asian
Place of birth - Born in state of residence (%) - Hispanic or Latino
Place of birth - Born in state of residence (%) - American Indian and Alaska Native
Place of birth - Born in state of residence (%) - Multirace
Place of birth - Born in state of residence (%) - Other Race
Place of birth - Born in other state (%)
Place of birth - Born in other state (%) - White
Place of birth - Born in other state (%) - Black or African American
Place of birth - Born in other state (%) - Asian
Place of birth - Born in other state (%) - Hispanic or Latino
Place of birth - Born in other state (%) - American Indian and Alaska Native
Place of birth - Born in other state (%) - Multirace
Place of birth - Born in other state (%) - Other Race
Place of birth - Native, outside of US (%)
Place of birth - Native, outside of US (%) - White
Place of birth - Native, outside of US (%) - Black or African American
Place of birth - Native, outside of US (%) - Asian
Place of birth - Native, outside of US (%) - Hispanic or Latino
Place of birth - Native, outside of US (%) - American Indian and Alaska Native
Place of birth - Native, outside of US (%) - Multirace
Place of birth - Native, outside of US (%) - Other Race
Place of birth - Foreign born (%)
Place of birth - Foreign born (%) - White
Place of birth - Foreign born (%) - Black or African American
Place of birth - Foreign born (%) - Asian
Place of birth - Foreign born (%) - Hispanic or Latino
Place of birth - Foreign born (%) - American Indian and Alaska Native
Place of birth - Foreign born (%) - Multirace
Place of birth - Foreign born (%) - Other Race
Residents speaking English at home (%)
Residents speaking English at home - Born in the United States (%)
Residents speaking English at home - Native, born elsewhere (%)
Residents speaking English at home - Foreign born (%)
Residents speaking Spanish at home (%)
Residents speaking Spanish at home - Born in the United States (%)
Residents speaking Spanish at home - Native, born elsewhere (%)
Residents speaking Spanish at home - Foreign born (%)
Residents speaking other language at home (%)
Residents speaking other language at home - Born in the United States (%)
Residents speaking other language at home - Native, born elsewhere (%)
Residents speaking other language at home - Foreign born (%)
Marital status - Never married (%)
Marital status - Now married (%)
Marital status - Separated (%)
Marital status - Widowed (%)
Marital status - Divorced (%)
Ancestries Reported - Arab (%)
Ancestries Reported - Czech (%)
Ancestries Reported - Danish (%)
Ancestries Reported - Dutch (%)
Ancestries Reported - English (%)
Ancestries Reported - French (%)
Ancestries Reported - French Canadian (%)
Ancestries Reported - German (%)
Ancestries Reported - Greek (%)
Ancestries Reported - Hungarian (%)
Ancestries Reported - Irish (%)
Ancestries Reported - Italian (%)
Ancestries Reported - Lithuanian (%)
Ancestries Reported - Norwegian (%)
Ancestries Reported - Polish (%)
Ancestries Reported - Portuguese (%)
Ancestries Reported - Russian (%)
Ancestries Reported - Scotch-Irish (%)
Ancestries Reported - Scottish (%)
Ancestries Reported - Slovak (%)
Ancestries Reported - Subsaharan African (%)
Ancestries Reported - Swedish (%)
Ancestries Reported - Swiss (%)
Ancestries Reported - Ukrainian (%)
Ancestries Reported - United States (%)
Ancestries Reported - Welsh (%)
Ancestries Reported - West Indian (%)
Ancestries Reported - Other (%)
Geographical mobility - Same house 1 year ago (%)
Geographical mobility - Same house 1 year ago (%) - White
Geographical mobility - Same house 1 year ago (%) - Black or African American
Geographical mobility - Same house 1 year ago (%) - Asian
Geographical mobility - Same house 1 year ago (%) - Hispanic or Latino
Geographical mobility - Same house 1 year ago (%) - American Indian and Alaska Native
Geographical mobility - Same house 1 year ago (%) - Multirace
Geographical mobility - Same house 1 year ago (%) - Other Race
Geographical mobility - Moved within same county (%)
Geographical mobility - Moved within same county (%) - White
Geographical mobility - Moved within same county (%) - Black or African American
Geographical mobility - Moved within same county (%) - Asian
Geographical mobility - Moved within same county (%) - Hispanic or Latino
Geographical mobility - Moved within same county (%) - American Indian and Alaska Native
Geographical mobility - Moved within same county (%) - Multirace
Geographical mobility - Moved within same county (%) - Other Race
Geographical mobility - Moved from different county within same state (%)
Geographical mobility - Moved from different county within same state (%) - White
Geographical mobility - Moved from different county within same state (%) - Black or African American
Geographical mobility - Moved from different county within same state (%) - Asian
Geographical mobility - Moved from different county within same state (%) - Hispanic or Latino
Geographical mobility - Moved from different county within same state (%) - American Indian and Alaska Native
Geographical mobility - Moved from different county within same state (%) - Multirace
Geographical mobility - Moved from different county within same state (%) - Other Race
Geographical mobility - Moved from different state (%)
Geographical mobility - Moved from different state (%) - White
Geographical mobility - Moved from different state (%) - Black or African American
Geographical mobility - Moved from different state (%) - Asian
Geographical mobility - Moved from different state (%) - Hispanic or Latino
Geographical mobility - Moved from different state (%) - American Indian and Alaska Native
Geographical mobility - Moved from different state (%) - Multirace
Geographical mobility - Moved from different state (%) - Other Race
Geographical mobility - Moved from abroad (%)
Geographical mobility - Moved from abroad (%) - White
Geographical mobility - Moved from abroad (%) - Black or African American
Geographical mobility - Moved from abroad (%) - Asian
Geographical mobility - Moved from abroad (%) - Hispanic or Latino
Geographical mobility - Moved from abroad (%) - American Indian and Alaska Native
Geographical mobility - Moved from abroad (%) - Multirace
Geographical mobility - Moved from abroad (%) - Other Race
Place of birth for the foreign-born population - Ireland (%)
Place of birth for the foreign-born population - Denmark (%)
Place of birth for the foreign-born population - Norway (%)
Place of birth for the foreign-born population - Sweden (%)
Place of birth for the foreign-born population - United Kingdom (%)
Place of birth for the foreign-born population - England (%)
Place of birth for the foreign-born population - Scotland (%)
Place of birth for the foreign-born population - Other Northern Europe (%)
Place of birth for the foreign-born population - Austria (%)
Place of birth for the foreign-born population - Belgium (%)
Place of birth for the foreign-born population - France (%)
Place of birth for the foreign-born population - Germany (%)
Place of birth for the foreign-born population - Netherlands (%)
Place of birth for the foreign-born population - Switzerland (%)
Place of birth for the foreign-born population - Other Western Europe (%)
Place of birth for the foreign-born population - Greece (%)
Place of birth for the foreign-born population - Italy (%)
Place of birth for the foreign-born population - Portugal (%)
Place of birth for the foreign-born population - Spain (%)
Place of birth for the foreign-born population - Other Southern Europe (%)
Place of birth for the foreign-born population - Albania (%)
Place of birth for the foreign-born population - Belarus (%)
Place of birth for the foreign-born population - Bosnia and Herzegovina (%)
Place of birth for the foreign-born population - Bulgaria (%)
Place of birth for the foreign-born population - Croatia (%)
Place of birth for the foreign-born population - Czechoslovakia (%)
Place of birth for the foreign-born population - Hungary (%)
Place of birth for the foreign-born population - Latvia (%)
Place of birth for the foreign-born population - Lithuania (%)
Place of birth for the foreign-born population - North Macedonia (Macedonia) (%)
Place of birth for the foreign-born population - Moldova (%)
Place of birth for the foreign-born population - Poland (%)
Place of birth for the foreign-born population - Romania (%)
Place of birth for the foreign-born population - Russia (%)
Place of birth for the foreign-born population - Serbia (%)
Place of birth for the foreign-born population - Ukraine (%)
Place of birth for the foreign-born population - Other Eastern Europe (%)
Place of birth for the foreign-born population - China (%)
Place of birth for the foreign-born population - Hong Kong (%)
Place of birth for the foreign-born population - Taiwan (%)
Place of birth for the foreign-born population - Japan (%)
Place of birth for the foreign-born population - Korea (%)
Place of birth for the foreign-born population - Other Eastern Asia (%)
Place of birth for the foreign-born population - Afghanistan (%)
Place of birth for the foreign-born population - Bangladesh (%)
Place of birth for the foreign-born population - India (%)
Place of birth for the foreign-born population - Iran (%)
Place of birth for the foreign-born population - Kazakhstan (%)
Place of birth for the foreign-born population - Nepal (%)
Place of birth for the foreign-born population - Pakistan (%)
Place of birth for the foreign-born population - Sri Lanka (%)
Place of birth for the foreign-born population - Uzbekistan (%)
Place of birth for the foreign-born population - Other South Central Asia (%)
Place of birth for the foreign-born population - Burma (%)
Place of birth for the foreign-born population - Cambodia (%)
Place of birth for the foreign-born population - Indonesia (%)
Place of birth for the foreign-born population - Laos (%)
Place of birth for the foreign-born population - Malaysia (%)
Place of birth for the foreign-born population - Philippines (%)
Place of birth for the foreign-born population - Singapore (%)
Place of birth for the foreign-born population - Thailand (%)
Place of birth for the foreign-born population - Vietnam (%)
Place of birth for the foreign-born population - Other South Eastern Asia (%)
Place of birth for the foreign-born population - Armenia (%)
Place of birth for the foreign-born population - Iraq (%)
Place of birth for the foreign-born population - Israel (%)
Place of birth for the foreign-born population - Jordan (%)
Place of birth for the foreign-born population - Kuwait (%)
Place of birth for the foreign-born population - Lebanon (%)
Place of birth for the foreign-born population - Saudi Arabia (%)
Place of birth for the foreign-born population - Syria (%)
Place of birth for the foreign-born population - Turkey (%)
Place of birth for the foreign-born population - Yemen (%)
Place of birth for the foreign-born population - Other Western Asia (%)
Place of birth for the foreign-born population - Eritrea (%)
Place of birth for the foreign-born population - Ethiopia (%)
Place of birth for the foreign-born population - Kenya (%)
Place of birth for the foreign-born population - Somalia (%)
Place of birth for the foreign-born population - Uganda (%)
Place of birth for the foreign-born population - Zimbabwe (%)
Place of birth for the foreign-born population - Other Eastern Africa (%)
Place of birth for the foreign-born population - Cameroon (%)
Place of birth for the foreign-born population - Congo (%)
Place of birth for the foreign-born population - Democratic Republic of Congo (Zaire) (%)
Place of birth for the foreign-born population - Other Middle Africa (%)
Place of birth for the foreign-born population - Egypt (%)
Place of birth for the foreign-born population - Morocco (%)
Place of birth for the foreign-born population - Sudan (%)
Place of birth for the foreign-born population - Other Northern Africa (%)
Place of birth for the foreign-born population - South Africa (%)
Place of birth for the foreign-born population - Other Southern Africa (%)
Place of birth for the foreign-born population - Cabo Verde (%)
Place of birth for the foreign-born population - Ghana (%)
Place of birth for the foreign-born population - Liberia (%)
Place of birth for the foreign-born population - Nigeria (%)
Place of birth for the foreign-born population - Senegal (%)
Place of birth for the foreign-born population - Sierra Leone (%)
Place of birth for the foreign-born population - Other Western Africa (%)
Place of birth for the foreign-born population - Australia (%)
Place of birth for the foreign-born population - New Zealand (%)
Place of birth for the foreign-born population - Fiji (%)
Place of birth for the foreign-born population - Micronesia (%)
Place of birth for the foreign-born population - Bahamas (%)
Place of birth for the foreign-born population - Barbados (%)
Place of birth for the foreign-born population - Cuba (%)
Place of birth for the foreign-born population - Dominica (%)
Place of birth for the foreign-born population - Dominican Republic (%)
Place of birth for the foreign-born population - Grenada (%)
Place of birth for the foreign-born population - Haiti (%)
Place of birth for the foreign-born population - Jamaica (%)
Place of birth for the foreign-born population - St. Vincent and the Grenadines (%)
Place of birth for the foreign-born population - Trinidad and Tobago (%)
Place of birth for the foreign-born population - West Indies (%)
Place of birth for the foreign-born population - Other Caribbean (%)
Place of birth for the foreign-born population - Belize (%)
Place of birth for the foreign-born population - Costa Rica (%)
Place of birth for the foreign-born population - El Salvador (%)
Place of birth for the foreign-born population - Guatemala (%)
Place of birth for the foreign-born population - Honduras (%)
Place of birth for the foreign-born population - Mexico (%)
Place of birth for the foreign-born population - Nicaragua (%)
Place of birth for the foreign-born population - Panama (%)
Place of birth for the foreign-born population - Other Central America (%)
Place of birth for the foreign-born population - Argentina (%)
Place of birth for the foreign-born population - Bolivia (%)
Place of birth for the foreign-born population - Brazil (%)
Place of birth for the foreign-born population - Chile (%)
Place of birth for the foreign-born population - Colombia (%)
Place of birth for the foreign-born population - Ecuador (%)
Place of birth for the foreign-born population - Guyana (%)
Place of birth for the foreign-born population - Peru (%)
Place of birth for the foreign-born population - Uruguay (%)
Place of birth for the foreign-born population - Venezuela (%)
Place of birth for the foreign-born population - Other South America (%)
Place of birth for the foreign-born population - Canada (%)
Place of birth for the foreign-born population - Other Northern America (%)
Place of birth for the foreign-born population - Other (%)
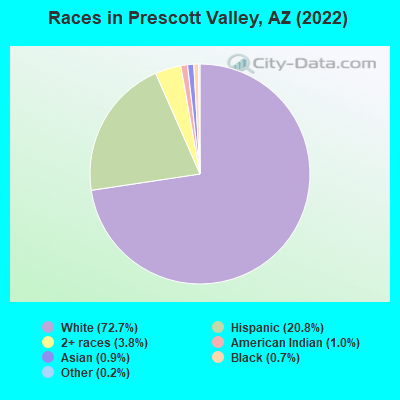
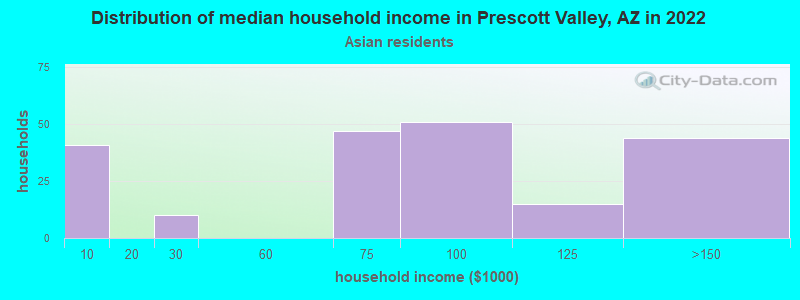
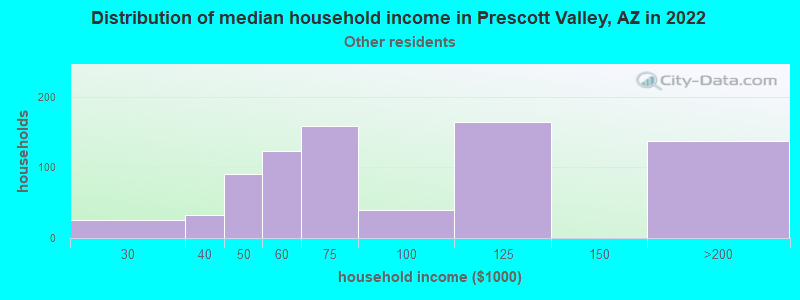
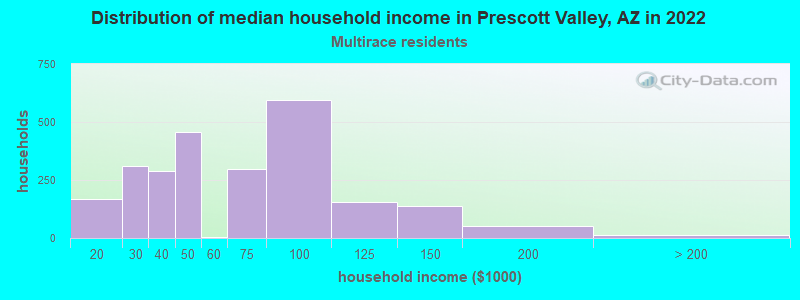
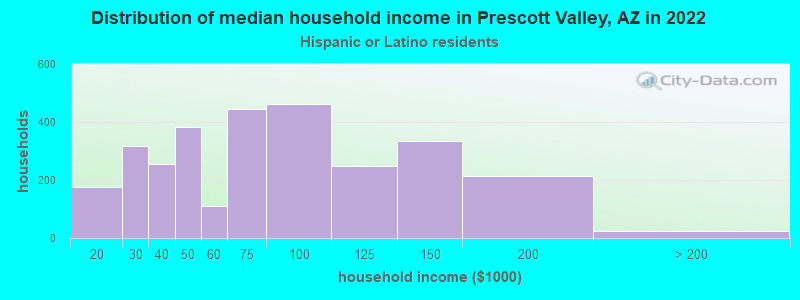
According to 2022 data, the most numerous races in Prescott Valley, AZ are White alone (32,986 residents), Hispanic (9,933 residents), and Black alone (333 residents). 84.5% of Prescott Valley residents speak English at home. 7.6% of Prescott Valley, AZ residents are foreign-born (4.5% born in Latin America, 1.4% born in Europe, 1.2% born in Asia), which is 70.4% less than the foreign-born rate of 13.0% across the entire state of Arizona.
Race distribution in Prescott Valley
2000 2022
3,274,258 63.8% White alone 1,295,617 25.3% Hispanic 233,370 4.5% American Indian alone 149,941 2.9% Black alone 89,315 1.7% Asian alone 76,372 1.5% Two or more races 6,120 0.1% Other race alone 5,639 0.1% Native Hawaiian and Other
3,814,587 51.8% White alone 2,388,520 32.5% Hispanic 322,459 4.4% Black alone 284,994 3.9% Two or more races 257,020 3.5% Asian alone 241,688 3.3% American Indian alone 36,042 0.5% Other race alone 13,887 0.2% Native Hawaiian and Other
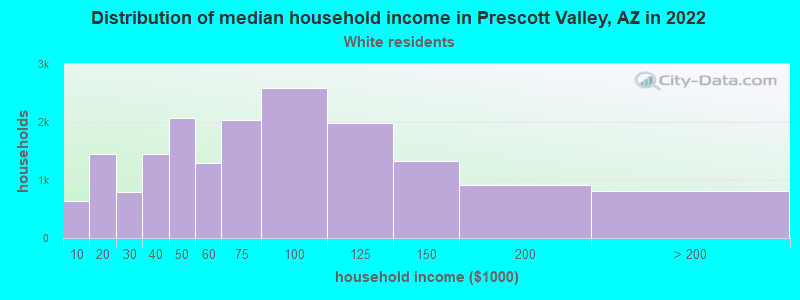
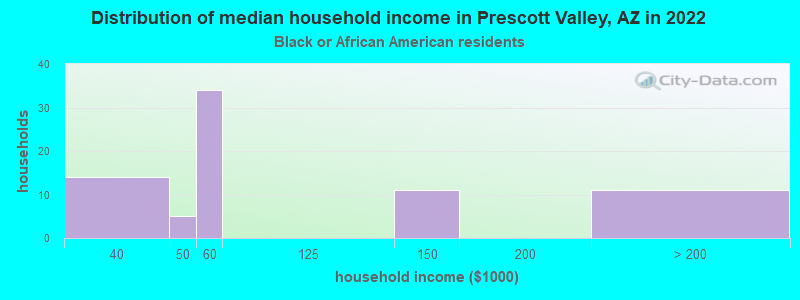
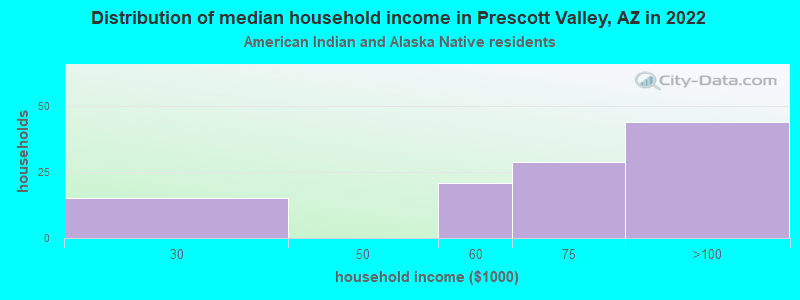
Income and house value in Prescott Valley Median household income in 2022 $65,747 White non-Hispanic householders$58,899 Black householders$121,170 American Indian and Alaska Native householders$80,068 Asian householders$68,450 Some other race householders$197,323 Two or more races householders$67,318 Hispanic or Latino race householdersMedian 2022 house value $399,486 White Non-Hispanic householders$276,142 Black or African American householders$325,111 American Indian or Alaska Native householders$359,353 Some other race householders$391,386 Two or more races householders$390,281 Hispanic or Latino householders
Median age by race in Prescott Valley
52.0 Median age for White residents49.9 53.6 65.9 Median age for Black or African American residents62.6 66.8 34.5 Median age for American Indian / Alaska Native residents28.4 75.9 56.3 Median age for Asian residents60.2 61.2 37.2 Median age for Other race residents38.3 31.2 28.8 Median age for Two or more races residents46.3 26.6 56.1 Median age for White alone residents53.8 58.0 29.4 Median age for Hispanic or Latino residents27.0 33.0
Owner/renter occupied households by race in Prescott Valley
House owners and renters - White residents 11,910 71.2% Owner occupied4,827 28.8% Renter occupiedHouse owners and renters - Black or African American residents 75 50.0% Owner occupied75 50.0% Renter occupiedHouse owners and renters - American Indian / Alaska Native residents 69 46.5% Owner occupied80 53.5% Renter occupiedHouse owners and renters - Asian residents 90 75.0% Owner occupied30 25.0% Renter occupiedHouse owners and renters - Other race residents 226 58.1% Owner occupied163 41.9% Renter occupiedHouse owners and renters - Two or more races residents 605 44.2% Owner occupied765 55.8% Renter occupiedHouse owners and renters - White alone residents 11,636 71.1% Owner occupied4,731 28.9% Renter occupiedHouse owners and renters - Hispanic or Latino residents 1,567 59.1% Owner occupied1,085 40.9% Renter occupied
Language usage in Prescott Valley
English speakers - Total 84.5% of residents of Prescott Valley speak English at home.
13.4% of residents speak Spanish at home 3,416 59.1% Speak English very well2,368 40.9% Speak English less than very well2.4% of residents speak other language at home 641 61.3% Speak English very well404 38.7% Speak English less than very well
English speakers - Born in the United States 94.4% of residents of Prescott Valley speak English at home.
4.5% of residents speak Spanish at home 981 80.7% Speak English very well234 19.3% Speak English less than very well1.1% of residents speak other language at home 236 79.5% Speak English very well61 20.5% Speak English less than very well
English speakers - Native, born elsewhere 77.4% of residents of Prescott Valley speak English at home.
20.9% of residents speak Spanish at home 23 30.7% Speak English very well52 69.3% Speak English less than very well2.2% of residents speak other language at home 8 100.0% Speak English very well
English speakers - Foreign-born 24.7% of residents of Prescott Valley speak English at home.
55.5% of residents speak Spanish at home 570 29.9% Speak English very well1,339 70.1% Speak English less than very well19.3% of residents speak other language at home 314 47.3% Speak English very well350 52.7% Speak English less than very well
White (Caucasian) - Speak only English Native:
95.1% (31,524)Foreign-born:
28.5% (529)
White (Caucasian) - Speak another language Native:
6.2% (2,038)Foreign-born:
74.7% (1,389)
Black or African American - Speak only English Native:
100.0% (285)Foreign-born:
100.0% (76)
American Indian / Alaska Native - Speak another language Native:
28.6% (126)Foreign-born:
100.0% (35)
Asian - Speak only English Native:
85.6% (188)Foreign-born:
36.6% (144)
Asian - Speak another language Native:
14.4% (32)Foreign-born:
66.0% (260)
Other race - Speak another language Native:
46.0% (263)Foreign-born:
95.2% (269)
Two or more races - Speak another language Native:
49.7% (1,985)Foreign-born:
100.0% (454)
White alone - Speak only English Native:
97.6% (30,569)Foreign-born:
54.1% (553)
White alone - Speak another language Native:
2.4% (760)Foreign-born:
46.5% (475)
Hispanic or Latino - Speak only English Native:
44.6% (2,830)Foreign-born:
0.6% (16)
Hispanic or Latino - Speak another language Native:
59.8% (3,797)Foreign-born:
99.0% (2,638)
Foreign-born residents in Prescott Valley 3,546 residents are foreign born (4.5% Latin America , 1.4% Europe , 1.2% Asia ).
This city:
7.6%Arizona:
100.0%
Marital status for residents in Prescott Valley Marital status - White (Caucasian) population 15 years and over
Males 27.6% Never married56.3% Now married1.5% Separated2.4% Widowed12.2% DivorcedFemales 20.2% Never married48.2% Now married1.9% Separated11.9% Widowed17.8% DivorcedWomen who gave birth in the past 12 months Now married:
67.9% (207)Unmarried:
32.1% (98)
Women who did not give birth in the past 12 months Now married:
44.7% (2,674)Unmarried:
55.3% (3,308)
Marital status - Black or African American population 15 years and over
Males 26.0% Never married19.3% Now married0.0% Separated6.0% Widowed48.7% DivorcedFemales 21.6% Never married56.1% Now married8.8% Separated4.7% Widowed8.8% DivorcedWomen who did not give birth in the past 12 months Now married:
75.0% (34)Unmarried:
25.0% (11)
Marital status - American Indian / Alaska Native population 15 years and over
Males 41.9% Never married57.6% Now married0.0% Separated0.0% Widowed0.5% DivorcedFemales 27.3% Never married72.7% Now married0.0% Separated0.0% Widowed0.0% DivorcedWomen who did not give birth in the past 12 months Now married:
70.5% (77)Unmarried:
29.5% (32)
Marital status - Asian population 15 years and over
Males 25.5% Never married74.5% Now married0.0% Separated0.0% Widowed0.0% DivorcedFemales 13.4% Never married77.1% Now married3.5% Separated2.2% Widowed3.8% DivorcedWomen who did not give birth in the past 12 months Now married:
72.0% (128)Unmarried:
28.0% (50)
Marital status - Other race population 15 years and over
Males 15.0% Never married63.6% Now married4.1% Separated3.9% Widowed13.3% DivorcedFemales 11.7% Never married78.4% Now married0.0% Separated4.5% Widowed5.3% DivorcedWomen who did not give birth in the past 12 months Now married:
81.2% (125)Unmarried:
18.8% (29)
Marital status - Two or more races population 15 years and over
Males 29.6% Never married63.9% Now married0.0% Separated0.0% Widowed6.5% DivorcedFemales 43.9% Never married33.1% Now married5.5% Separated0.0% Widowed17.6% DivorcedWomen who gave birth in the past 12 months Now married:
100.0% (140)Unmarried:
0.0% (0)
Women who did not give birth in the past 12 months Now married:
29.5% (393)Unmarried:
70.5% (938)
Marital status - White alone, not Hispanic / Latino population 15 years and over
Males 25.4% Never married58.6% Now married1.2% Separated2.8% Widowed12.0% DivorcedFemales 18.5% Never married48.5% Now married1.4% Separated13.8% Widowed17.7% DivorcedWomen who gave birth in the past 12 months Now married:
84.2% (237)Unmarried:
15.8% (44)
Women who did not give birth in the past 12 months Now married:
43.5% (2,284)Unmarried:
56.5% (2,972)
Marital status - Hispanic or Latino population 15 years and over
Males 35.5% Never married46.6% Now married3.4% Separated0.8% Widowed13.8% DivorcedFemales 28.6% Never married49.3% Now married4.0% Separated1.4% Widowed16.6% DivorcedWomen who gave birth in the past 12 months Now married:
31.2% (38)Unmarried:
68.8% (83)
Women who did not give birth in the past 12 months Now married:
49.7% (1,206)Unmarried:
50.3% (1,219)
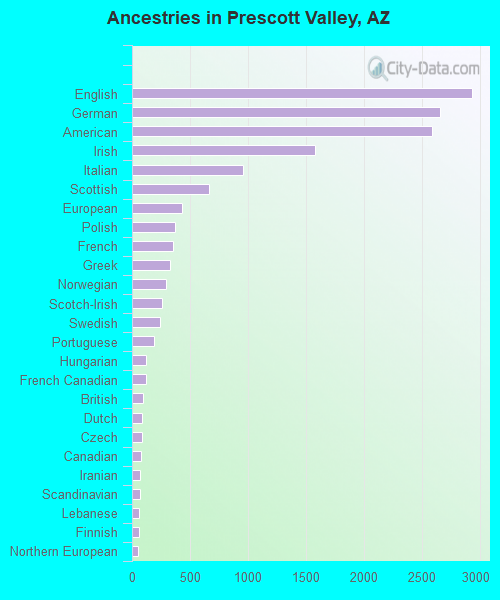
Ancestries in Prescott Valley
1,782 10.0% American1,663 9.3% German1,534 8.6% English1,229 6.9% Irish913 5.1% Italian696 3.9% European441 2.5% Norwegian316 1.8% British296 1.7% Polish265 1.5% Scottish240 1.3% Swedish215 1.2% French135 0.8% Dutch122 0.7% French Canadian120 0.7% Finnish113 0.6% Romanian101 0.6% Canadian101 0.6% Scotch-Irish86 0.5% Jamaican83 0.5% Iranian80 0.4% Hungarian76 0.4% Armenian76 0.4% Northern European75 0.4% Ukrainian71 0.4% Scandinavian69 0.4% Greek62 0.3% Russian29 0.2% Estonian29 0.2% Turkish27 0.2% Eastern European27 0.2% Serbian25 0.1% Portuguese21 0.1% Czechoslovakian19 0.1% Syrian18 0.1% Slovak18 0.1% Belgian18 0.1% Swiss17 0.10% Celtic17 0.10% Czech16 0.09% Yugoslavian15 0.08% Lebanese15 0.08% Croatian15 0.08% Lithuanian14 0.08% Maltese12 0.07% Welsh6 0.03% Arab5 0.03% Danish
Geographical mobility in Prescott Valley Same house 1 year ago 31,409 84.4% White (Caucasian)339 95.9% Black or African American304 62.2% American Indian / Alaska Native518 85.3% Asian902 96.7% Other race4,808 99.8% Two or more races26,844 83.3% White alone, not Hispanic / Latino8,009 84.9% Hispanic or LatinoMoved within same county 2,748 7.4% White / Caucasian9 2.4% Black or African American82 16.8% American Indian / Alaska Native11 1.8% Asian150 3.1% Two or more races2,617 8.1% White alone, not Hispanic / Latino622 6.6% Hispanic or LatinoMoved within same state 1,479 4.0% White / Caucasian1 0.2% Black or African American121 24.7% American Indian / Alaska Native93 15.4% Asian80 8.6% Other race110 2.3% Two or more races1,184 3.7% White alone, not Hispanic / Latino650 6.9% Hispanic or LatinoMoved from different state 1,585 4.3% White / Caucasian1 0.3% Black or African American3 0.6% Asian39 4.2% Other race15 0.3% Two or more races1,567 4.9% White alone, not Hispanic / Latino254 2.7% Hispanic or LatinoMoved from abroad 19 0.1% White15 4.2% Black or African American20 0.1% White alone, not Hispanic / Latino2 0.0% Hispanic or Latino
Children Nativity (place of birth) in Prescott Valley
Children under 6 years - Living with two parents Both parents native 1,184 100.0% NativeBoth parents foreign-born 110 100.0% NativeOne native, one foreign-born parent 137 100.0% NativeChildren under 6 years - Living with one parent Native parent 822 100.0% NativeForeign-born parent 13 100.0% NativeChildren 6 to 17 years - Living with two parents Both parents native 2,940 100.0% NativeBoth parents foreign-born 304 92.6% Native24 7.4% Foreign-bornOne native, one foreign-born parent 926 100.0% NativeChildren 6 to 17 years - Living with one parent Native parent 1,531 100.0% NativeForeign-born parent 199 50.3% Native196 49.7% Foreign-born
Grandparents responsible for own grandchildren in Prescott Valley
Grandparents (30 to 59 years) White / Caucasian 165 33.1% Responsible for grandchildren332 66.9% Not responsible for grandchildrenBlack or African American 7 100.0% Not responsible for grandchildrenOther race 31 55.2% Responsible for grandchildren25 44.8% Not responsible for grandchildrenWhite alone, not Hispanic / Latino 54 22.1% Responsible for grandchildren190 77.9% Not responsible for grandchildrenHispanic or Latino 172 42.5% Responsible for grandchildren232 57.5% Not responsible for grandchildrenGrandparents (60 years and over) White / Caucasian 224 62.0% Responsible for grandchildren137 38.0% Not responsible for grandchildrenBlack or African American 10 100.0% Not responsible for grandchildrenWhite alone, not Hispanic / Latino 175 52.9% Responsible for grandchildren156 47.1% Not responsible for grandchildrenHispanic or Latino 96 89.2% Responsible for grandchildren12 10.8% Not responsible for grandchildren