Races in Price, Utah (UT) Detailed Stats
Data:
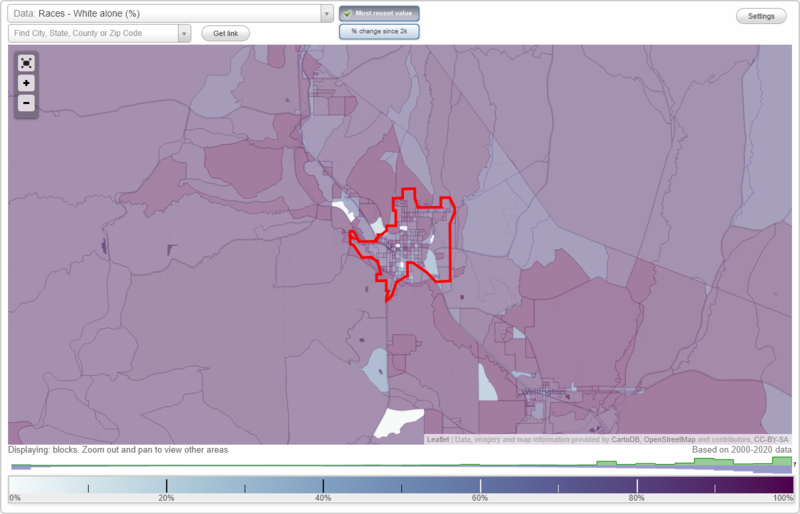
Races - White alone (%)
Races - White alone (% change since 2000)
Races - Black alone (%)
Races - Black alone (% change since 2000)
Races - American Indian alone (%)
Races - American Indian alone (% change since 2000)
Races - Asian alone (%)
Races - Asian alone (% change since 2000)
Races - Hispanic (%)
Races - Hispanic (% change since 2000)
Races - Native Hawaiian and Other Pacific Islander alone (%)
Races - Native Hawaiian and Other Pacific Islander alone (% change since 2000)
Races - Two or more races(%)
Races - Two or more races(% change since 2000)
Races - Other race alone (%)
Races - Other race alone (% change since 2000)
Racial diversity
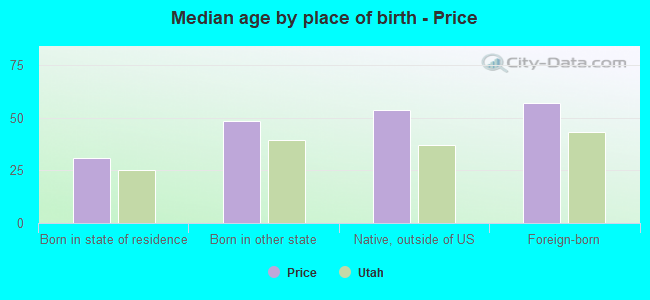
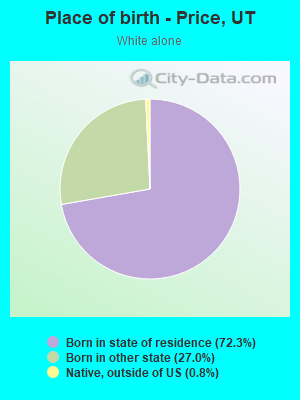
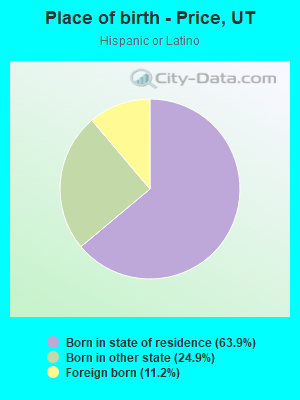
Place of birth - Born in state of residence (%)
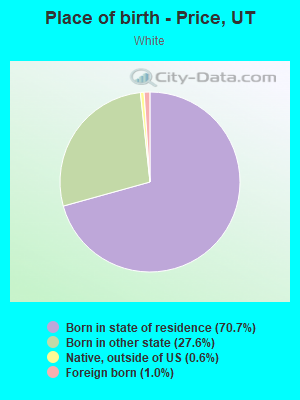
Place of birth - Born in state of residence (%) - White
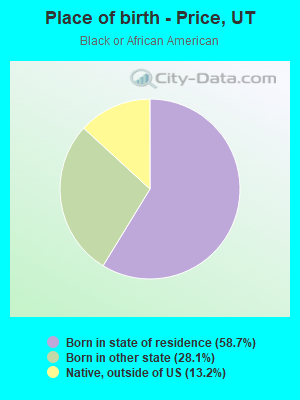
Place of birth - Born in state of residence (%) - Black or African American
Place of birth - Born in state of residence (%) - Asian
Place of birth - Born in state of residence (%) - Hispanic or Latino
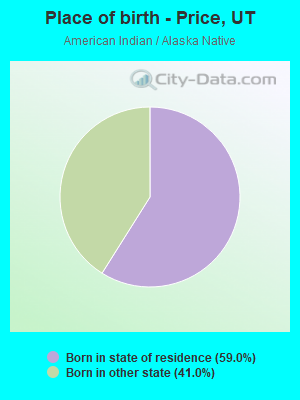
Place of birth - Born in state of residence (%) - American Indian and Alaska Native
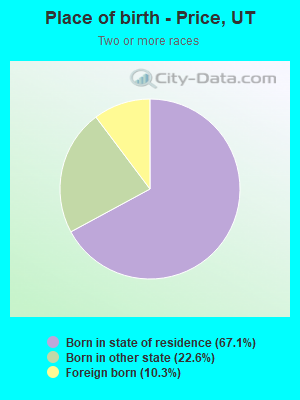
Place of birth - Born in state of residence (%) - Multirace
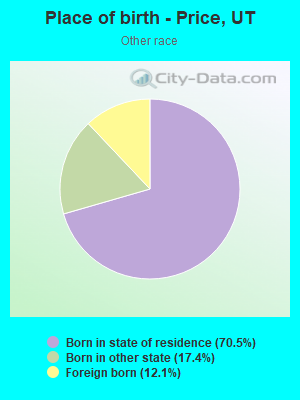
Place of birth - Born in state of residence (%) - Other Race
Place of birth - Born in other state (%)
Place of birth - Born in other state (%) - White
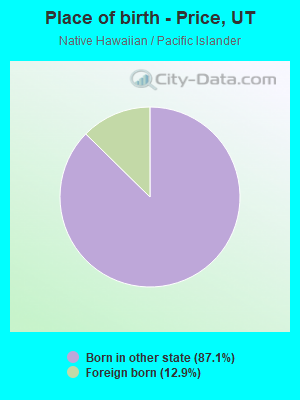
Place of birth - Born in other state (%) - Black or African American
Place of birth - Born in other state (%) - Asian
Place of birth - Born in other state (%) - Hispanic or Latino
Place of birth - Born in other state (%) - American Indian and Alaska Native
Place of birth - Born in other state (%) - Multirace
Place of birth - Born in other state (%) - Other Race
Place of birth - Native, outside of US (%)
Place of birth - Native, outside of US (%) - White
Place of birth - Native, outside of US (%) - Black or African American
Place of birth - Native, outside of US (%) - Asian
Place of birth - Native, outside of US (%) - Hispanic or Latino
Place of birth - Native, outside of US (%) - American Indian and Alaska Native
Place of birth - Native, outside of US (%) - Multirace
Place of birth - Native, outside of US (%) - Other Race
Place of birth - Foreign born (%)
Place of birth - Foreign born (%) - White
Place of birth - Foreign born (%) - Black or African American
Place of birth - Foreign born (%) - Asian
Place of birth - Foreign born (%) - Hispanic or Latino
Place of birth - Foreign born (%) - American Indian and Alaska Native
Place of birth - Foreign born (%) - Multirace
Place of birth - Foreign born (%) - Other Race
Residents speaking English at home (%)
Residents speaking English at home - Born in the United States (%)
Residents speaking English at home - Native, born elsewhere (%)
Residents speaking English at home - Foreign born (%)
Residents speaking Spanish at home (%)
Residents speaking Spanish at home - Born in the United States (%)
Residents speaking Spanish at home - Native, born elsewhere (%)
Residents speaking Spanish at home - Foreign born (%)
Residents speaking other language at home (%)
Residents speaking other language at home - Born in the United States (%)
Residents speaking other language at home - Native, born elsewhere (%)
Residents speaking other language at home - Foreign born (%)
Marital status - Never married (%)
Marital status - Now married (%)
Marital status - Separated (%)
Marital status - Widowed (%)
Marital status - Divorced (%)
Ancestries Reported - Arab (%)
Ancestries Reported - Czech (%)
Ancestries Reported - Danish (%)
Ancestries Reported - Dutch (%)
Ancestries Reported - English (%)
Ancestries Reported - French (%)
Ancestries Reported - French Canadian (%)
Ancestries Reported - German (%)
Ancestries Reported - Greek (%)
Ancestries Reported - Hungarian (%)
Ancestries Reported - Irish (%)
Ancestries Reported - Italian (%)
Ancestries Reported - Lithuanian (%)
Ancestries Reported - Norwegian (%)
Ancestries Reported - Polish (%)
Ancestries Reported - Portuguese (%)
Ancestries Reported - Russian (%)
Ancestries Reported - Scotch-Irish (%)
Ancestries Reported - Scottish (%)
Ancestries Reported - Slovak (%)
Ancestries Reported - Subsaharan African (%)
Ancestries Reported - Swedish (%)
Ancestries Reported - Swiss (%)
Ancestries Reported - Ukrainian (%)
Ancestries Reported - United States (%)
Ancestries Reported - Welsh (%)
Ancestries Reported - West Indian (%)
Ancestries Reported - Other (%)
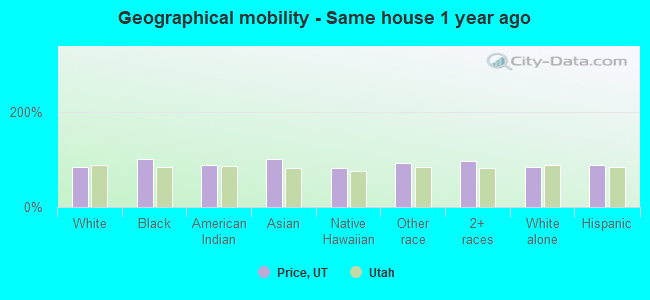
Geographical mobility - Same house 1 year ago (%)
Geographical mobility - Same house 1 year ago (%) - White
Geographical mobility - Same house 1 year ago (%) - Black or African American
Geographical mobility - Same house 1 year ago (%) - Asian
Geographical mobility - Same house 1 year ago (%) - Hispanic or Latino
Geographical mobility - Same house 1 year ago (%) - American Indian and Alaska Native
Geographical mobility - Same house 1 year ago (%) - Multirace
Geographical mobility - Same house 1 year ago (%) - Other Race
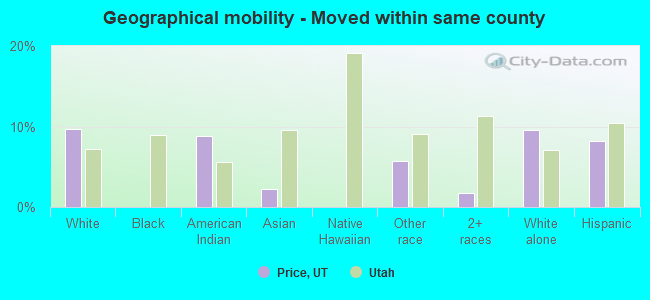
Geographical mobility - Moved within same county (%)
Geographical mobility - Moved within same county (%) - White
Geographical mobility - Moved within same county (%) - Black or African American
Geographical mobility - Moved within same county (%) - Asian
Geographical mobility - Moved within same county (%) - Hispanic or Latino
Geographical mobility - Moved within same county (%) - American Indian and Alaska Native
Geographical mobility - Moved within same county (%) - Multirace
Geographical mobility - Moved within same county (%) - Other Race
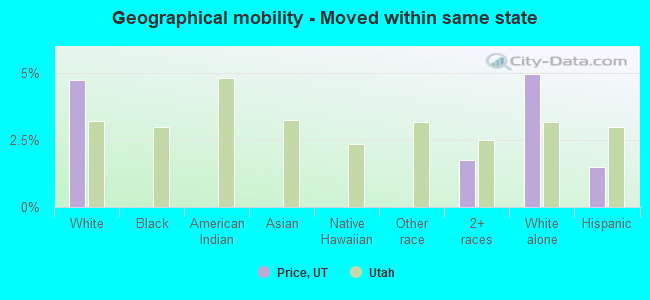
Geographical mobility - Moved from different county within same state (%)
Geographical mobility - Moved from different county within same state (%) - White
Geographical mobility - Moved from different county within same state (%) - Black or African American
Geographical mobility - Moved from different county within same state (%) - Asian
Geographical mobility - Moved from different county within same state (%) - Hispanic or Latino
Geographical mobility - Moved from different county within same state (%) - American Indian and Alaska Native
Geographical mobility - Moved from different county within same state (%) - Multirace
Geographical mobility - Moved from different county within same state (%) - Other Race
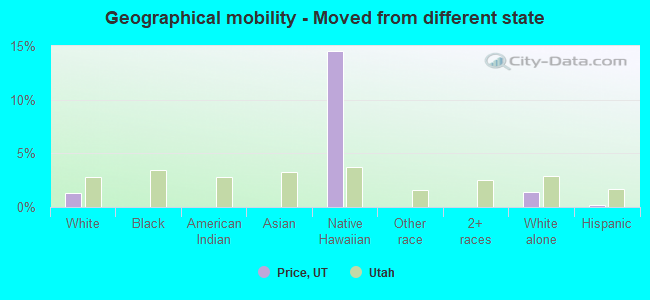
Geographical mobility - Moved from different state (%)
Geographical mobility - Moved from different state (%) - White
Geographical mobility - Moved from different state (%) - Black or African American
Geographical mobility - Moved from different state (%) - Asian
Geographical mobility - Moved from different state (%) - Hispanic or Latino
Geographical mobility - Moved from different state (%) - American Indian and Alaska Native
Geographical mobility - Moved from different state (%) - Multirace
Geographical mobility - Moved from different state (%) - Other Race
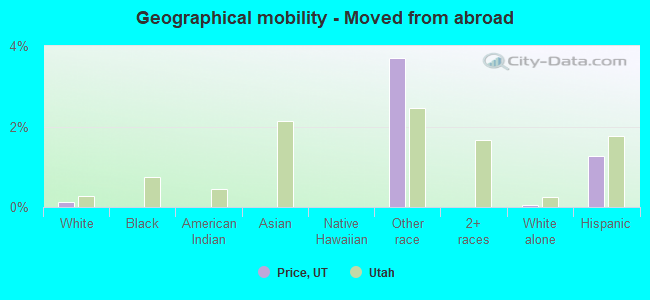
Geographical mobility - Moved from abroad (%)
Geographical mobility - Moved from abroad (%) - White
Geographical mobility - Moved from abroad (%) - Black or African American
Geographical mobility - Moved from abroad (%) - Asian
Geographical mobility - Moved from abroad (%) - Hispanic or Latino
Geographical mobility - Moved from abroad (%) - American Indian and Alaska Native
Geographical mobility - Moved from abroad (%) - Multirace
Geographical mobility - Moved from abroad (%) - Other Race
Place of birth for the foreign-born population - Ireland (%)
Place of birth for the foreign-born population - Denmark (%)
Place of birth for the foreign-born population - Norway (%)
Place of birth for the foreign-born population - Sweden (%)
Place of birth for the foreign-born population - United Kingdom (%)
Place of birth for the foreign-born population - England (%)
Place of birth for the foreign-born population - Scotland (%)
Place of birth for the foreign-born population - Other Northern Europe (%)
Place of birth for the foreign-born population - Austria (%)
Place of birth for the foreign-born population - Belgium (%)
Place of birth for the foreign-born population - France (%)
Place of birth for the foreign-born population - Germany (%)
Place of birth for the foreign-born population - Netherlands (%)
Place of birth for the foreign-born population - Switzerland (%)
Place of birth for the foreign-born population - Other Western Europe (%)
Place of birth for the foreign-born population - Greece (%)
Place of birth for the foreign-born population - Italy (%)
Place of birth for the foreign-born population - Portugal (%)
Place of birth for the foreign-born population - Spain (%)
Place of birth for the foreign-born population - Other Southern Europe (%)
Place of birth for the foreign-born population - Albania (%)
Place of birth for the foreign-born population - Belarus (%)
Place of birth for the foreign-born population - Bosnia and Herzegovina (%)
Place of birth for the foreign-born population - Bulgaria (%)
Place of birth for the foreign-born population - Croatia (%)
Place of birth for the foreign-born population - Czechoslovakia (%)
Place of birth for the foreign-born population - Hungary (%)
Place of birth for the foreign-born population - Latvia (%)
Place of birth for the foreign-born population - Lithuania (%)
Place of birth for the foreign-born population - North Macedonia (Macedonia) (%)
Place of birth for the foreign-born population - Moldova (%)
Place of birth for the foreign-born population - Poland (%)
Place of birth for the foreign-born population - Romania (%)
Place of birth for the foreign-born population - Russia (%)
Place of birth for the foreign-born population - Serbia (%)
Place of birth for the foreign-born population - Ukraine (%)
Place of birth for the foreign-born population - Other Eastern Europe (%)
Place of birth for the foreign-born population - China (%)
Place of birth for the foreign-born population - Hong Kong (%)
Place of birth for the foreign-born population - Taiwan (%)
Place of birth for the foreign-born population - Japan (%)
Place of birth for the foreign-born population - Korea (%)
Place of birth for the foreign-born population - Other Eastern Asia (%)
Place of birth for the foreign-born population - Afghanistan (%)
Place of birth for the foreign-born population - Bangladesh (%)
Place of birth for the foreign-born population - India (%)
Place of birth for the foreign-born population - Iran (%)
Place of birth for the foreign-born population - Kazakhstan (%)
Place of birth for the foreign-born population - Nepal (%)
Place of birth for the foreign-born population - Pakistan (%)
Place of birth for the foreign-born population - Sri Lanka (%)
Place of birth for the foreign-born population - Uzbekistan (%)
Place of birth for the foreign-born population - Other South Central Asia (%)
Place of birth for the foreign-born population - Burma (%)
Place of birth for the foreign-born population - Cambodia (%)
Place of birth for the foreign-born population - Indonesia (%)
Place of birth for the foreign-born population - Laos (%)
Place of birth for the foreign-born population - Malaysia (%)
Place of birth for the foreign-born population - Philippines (%)
Place of birth for the foreign-born population - Singapore (%)
Place of birth for the foreign-born population - Thailand (%)
Place of birth for the foreign-born population - Vietnam (%)
Place of birth for the foreign-born population - Other South Eastern Asia (%)
Place of birth for the foreign-born population - Armenia (%)
Place of birth for the foreign-born population - Iraq (%)
Place of birth for the foreign-born population - Israel (%)
Place of birth for the foreign-born population - Jordan (%)
Place of birth for the foreign-born population - Kuwait (%)
Place of birth for the foreign-born population - Lebanon (%)
Place of birth for the foreign-born population - Saudi Arabia (%)
Place of birth for the foreign-born population - Syria (%)
Place of birth for the foreign-born population - Turkey (%)
Place of birth for the foreign-born population - Yemen (%)
Place of birth for the foreign-born population - Other Western Asia (%)
Place of birth for the foreign-born population - Eritrea (%)
Place of birth for the foreign-born population - Ethiopia (%)
Place of birth for the foreign-born population - Kenya (%)
Place of birth for the foreign-born population - Somalia (%)
Place of birth for the foreign-born population - Uganda (%)
Place of birth for the foreign-born population - Zimbabwe (%)
Place of birth for the foreign-born population - Other Eastern Africa (%)
Place of birth for the foreign-born population - Cameroon (%)
Place of birth for the foreign-born population - Congo (%)
Place of birth for the foreign-born population - Democratic Republic of Congo (Zaire) (%)
Place of birth for the foreign-born population - Other Middle Africa (%)
Place of birth for the foreign-born population - Egypt (%)
Place of birth for the foreign-born population - Morocco (%)
Place of birth for the foreign-born population - Sudan (%)
Place of birth for the foreign-born population - Other Northern Africa (%)
Place of birth for the foreign-born population - South Africa (%)
Place of birth for the foreign-born population - Other Southern Africa (%)
Place of birth for the foreign-born population - Cabo Verde (%)
Place of birth for the foreign-born population - Ghana (%)
Place of birth for the foreign-born population - Liberia (%)
Place of birth for the foreign-born population - Nigeria (%)
Place of birth for the foreign-born population - Senegal (%)
Place of birth for the foreign-born population - Sierra Leone (%)
Place of birth for the foreign-born population - Other Western Africa (%)
Place of birth for the foreign-born population - Australia (%)
Place of birth for the foreign-born population - New Zealand (%)
Place of birth for the foreign-born population - Fiji (%)
Place of birth for the foreign-born population - Micronesia (%)
Place of birth for the foreign-born population - Bahamas (%)
Place of birth for the foreign-born population - Barbados (%)
Place of birth for the foreign-born population - Cuba (%)
Place of birth for the foreign-born population - Dominica (%)
Place of birth for the foreign-born population - Dominican Republic (%)
Place of birth for the foreign-born population - Grenada (%)
Place of birth for the foreign-born population - Haiti (%)
Place of birth for the foreign-born population - Jamaica (%)
Place of birth for the foreign-born population - St. Vincent and the Grenadines (%)
Place of birth for the foreign-born population - Trinidad and Tobago (%)
Place of birth for the foreign-born population - West Indies (%)
Place of birth for the foreign-born population - Other Caribbean (%)
Place of birth for the foreign-born population - Belize (%)
Place of birth for the foreign-born population - Costa Rica (%)
Place of birth for the foreign-born population - El Salvador (%)
Place of birth for the foreign-born population - Guatemala (%)
Place of birth for the foreign-born population - Honduras (%)
Place of birth for the foreign-born population - Mexico (%)
Place of birth for the foreign-born population - Nicaragua (%)
Place of birth for the foreign-born population - Panama (%)
Place of birth for the foreign-born population - Other Central America (%)
Place of birth for the foreign-born population - Argentina (%)
Place of birth for the foreign-born population - Bolivia (%)
Place of birth for the foreign-born population - Brazil (%)
Place of birth for the foreign-born population - Chile (%)
Place of birth for the foreign-born population - Colombia (%)
Place of birth for the foreign-born population - Ecuador (%)
Place of birth for the foreign-born population - Guyana (%)
Place of birth for the foreign-born population - Peru (%)
Place of birth for the foreign-born population - Uruguay (%)
Place of birth for the foreign-born population - Venezuela (%)
Place of birth for the foreign-born population - Other South America (%)
Place of birth for the foreign-born population - Canada (%)
Place of birth for the foreign-born population - Other Northern America (%)
Place of birth for the foreign-born population - Other (%)
Latest news about races in Price, UT collected exclusively by city-data.com from local newspapers, TV, and radio stations
According to 2022 data, the most numerous races in Price, UT are White alone (6,204 residents), Hispanic (1,759 residents), and Two or more races (208 residents). 89.9% of Price residents speak English at home. 3.0% of Price, UT residents are foreign-born (2.3% born in Latin America, 0.5% born in Asia), which is 170.4% less than the foreign-born rate of 8.0% across the entire state of Utah.
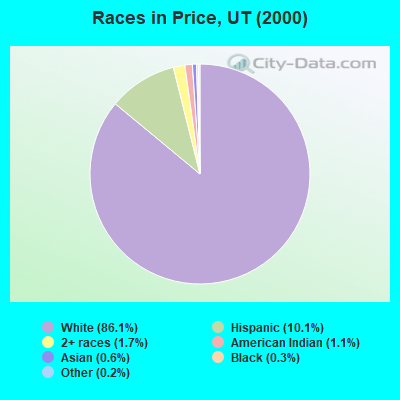
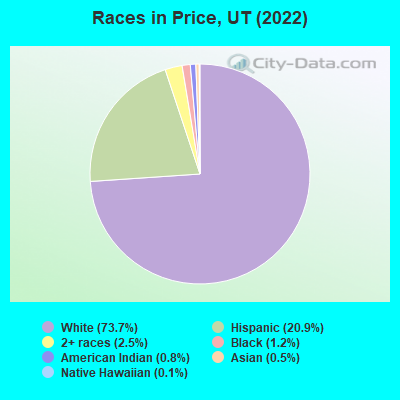
Race distribution in Price
2000 2022
1,904,265 85.3% White alone 201,559 9.0% Hispanic 36,483 1.6% Asian alone 31,308 1.4% Two or more races 26,663 1.2% American Indian alone 14,806 0.7% Native Hawaiian and Other 16,137 0.7% Black alone 1,948 0.09% Other race alone
2,557,466 75.6% White alone 512,086 15.1% Hispanic 119,308 3.5% Two or more races 82,388 2.4% Asian alone 36,978 1.1% Native Hawaiian and Other 34,873 1.0% Black alone 22,803 0.7% American Indian alone 14,898 0.4% Other race alone
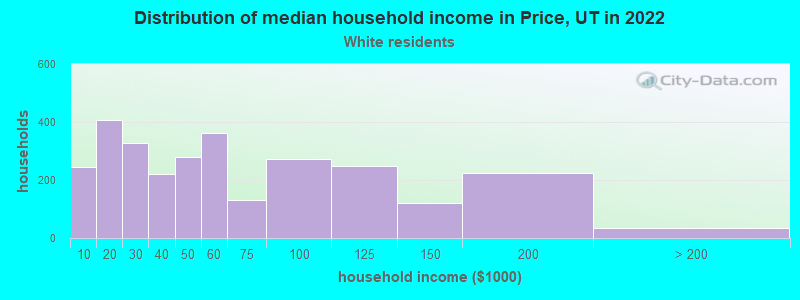
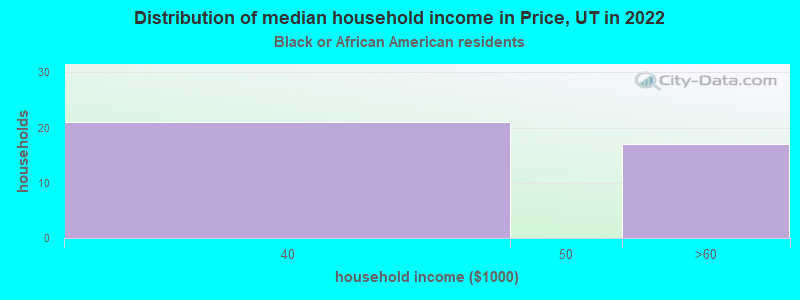
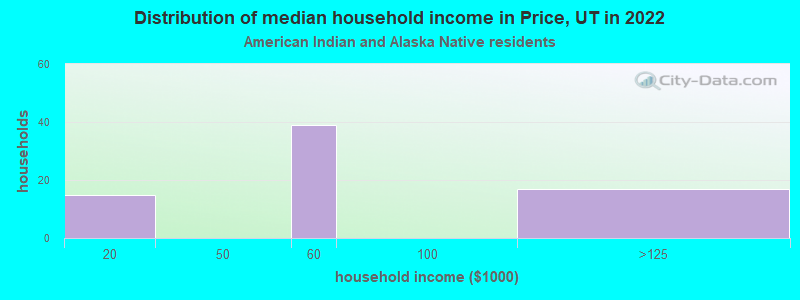
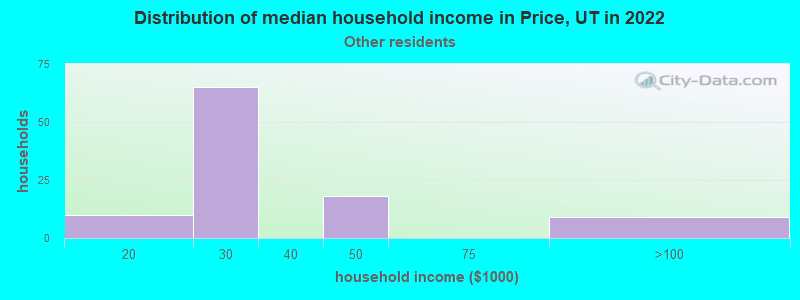
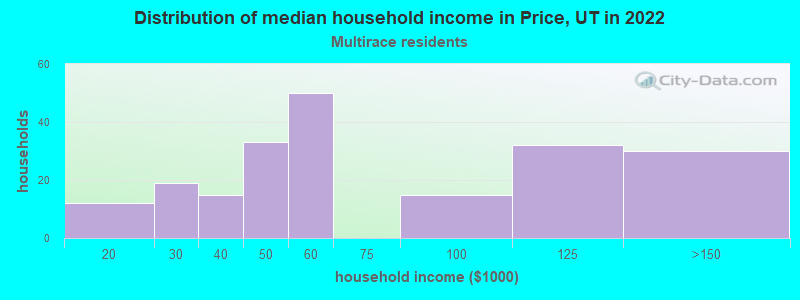
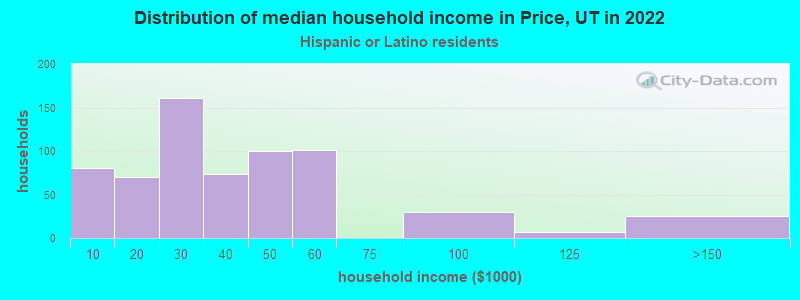
Income and house value in Price Median household income in 2022 $51,755 White non-Hispanic householders$56,756 American Indian and Alaska Native householders$27,222 Some other race householders$50,085 Two or more races householders$28,132 Hispanic or Latino race householdersMedian 2022 house value $214,466 White Non-Hispanic householders$126,835 American Indian or Alaska Native householders $317,087 Asian householders$191,867 Some other race householders$212,160 Two or more races householders$189,330 Hispanic or Latino householders
Median age by race in Price
37.8 Median age for White residents36.6 39.3 33.6 Median age for Black or African American residents48.8 -686,357,242.6 47.9 Median age for American Indian / Alaska Native residents48.0 50.7 -682,306,939.7 Median age for Asian residents-685,128,204.4 -679,775,280.2 -664,268,584.5 Median age for Native Hawaiian / Pacific Islander residents-659,420,289.2 -664,285,713.6 27.3 Median age for Other race residents26.0 65.4 25.6 Median age for Two or more races residents27.4 20.6 38.0 Median age for White alone residents36.5 39.7 29.1 Median age for Hispanic or Latino residents26.7 34.2
Owner/renter occupied households by race in Price
House owners and renters - White residents 1,800 61.0% Owner occupied1,153 39.0% Renter occupiedHouse owners and renters - Black or African American residents 74 100.0% Renter occupiedHouse owners and renters - American Indian / Alaska Native residents 29 51.2% Owner occupied27 48.8% Renter occupiedHouse owners and renters - Other race residents 90 75.0% Owner occupied30 25.0% Renter occupiedHouse owners and renters - Two or more races residents 183 92.3% Owner occupied15 7.7% Renter occupiedHouse owners and renters - White alone residents 1,668 64.0% Owner occupied938 36.0% Renter occupiedHouse owners and renters - Hispanic or Latino residents 352 49.3% Owner occupied362 50.7% Renter occupied
Language usage in Price
English speakers - Total 89.9% of residents of Price speak English at home.
7.3% of residents speak Spanish at home 486 83.8% Speak English very well94 16.2% Speak English less than very well2.3% of residents speak other language at home 94 51.6% Speak English very well88 48.4% Speak English less than very well
English speakers - Born in the United States 89.4% of residents of Price speak English at home.
9.9% of residents speak Spanish at home 207 95.0% Speak English very well11 5.0% Speak English less than very well0.4% of residents speak other language at home 8 100.0% Speak English very well
English speakers - Native, born elsewhere 96.2% of residents of Price speak English at home.
English speakers - Foreign-born 0.8% of residents of Price speak English at home.
74.7% of residents speak Spanish at home 106 57.0% Speak English very well80 43.0% Speak English less than very well21.3% of residents speak other language at home 53 100.0% Speak English less than very well
White (Caucasian) - Speak another language Native:
4.2% (272)Foreign-born:
86.9% (62)
Other race - Speak another language Native:
50.3% (129)Foreign-born:
97.1% (40)
Two or more races - Speak another language Native:
12.2% (93)Foreign-born:
100.0% (92)
Hispanic or Latino - Speak another language Native:
18.9% (286)Foreign-born:
99.4% (196)
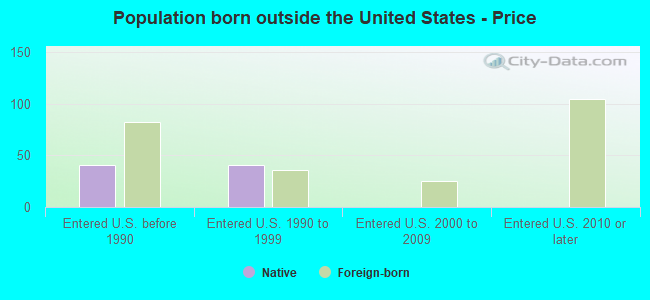
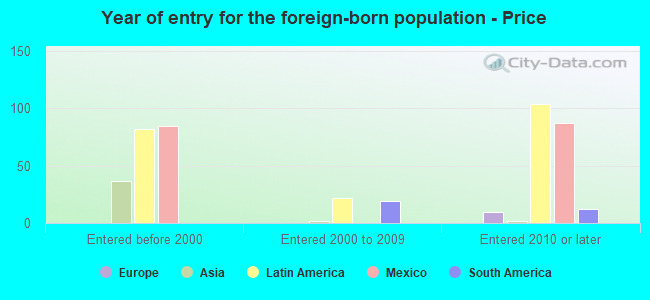
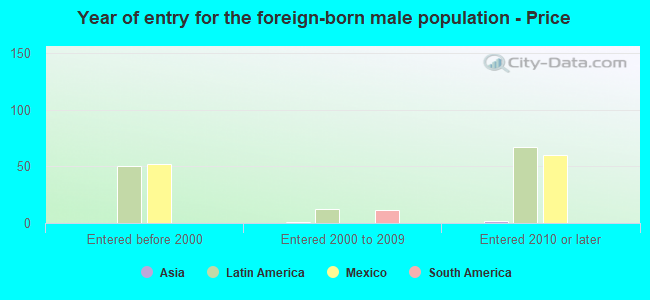
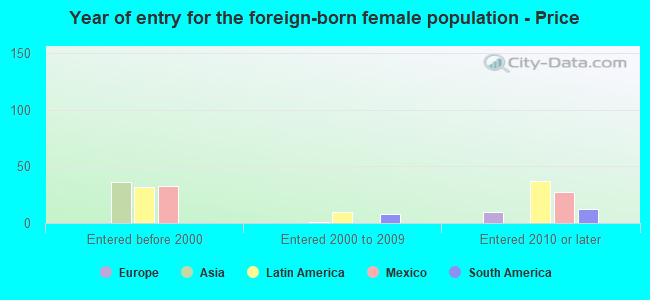
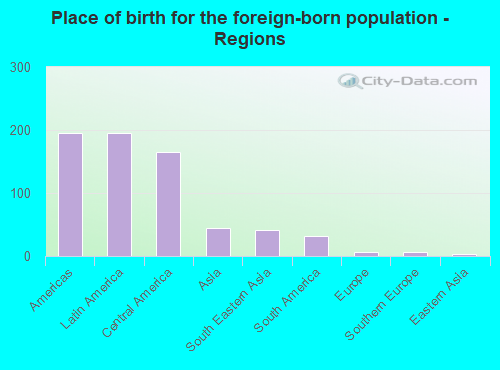
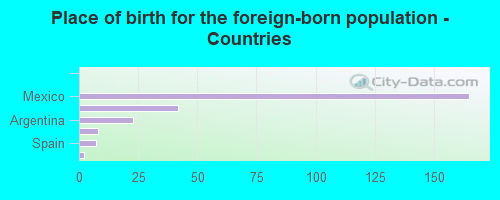
Foreign-born residents in Price 249 residents are foreign born (2.3% Latin America , 0.5% Asia ).
Marital status for residents in Price Marital status - White (Caucasian) population 15 years and over
Males 30.1% Never married49.8% Now married0.7% Separated5.6% Widowed13.7% DivorcedFemales 20.3% Never married49.9% Now married3.2% Separated9.4% Widowed17.2% DivorcedWomen who gave birth in the past 12 months Now married:
76.3% (135)Unmarried:
23.7% (42)
Women who did not give birth in the past 12 months Now married:
51.0% (760)Unmarried:
49.0% (730)
Marital status - Black or African American population 15 years and over
Males 5.3% Never married0.0% Now married0.0% Separated33.3% Widowed61.3% DivorcedFemales 0.0% Never married100.0% Now married0.0% Separated0.0% Widowed0.0% DivorcedWomen who did not give birth in the past 12 months Now married:
100.0% (55)Unmarried:
0.0% (0)
Marital status - American Indian / Alaska Native population 15 years and over
Males 32.3% Never married67.7% Now married0.0% Separated0.0% Widowed0.0% DivorcedFemales 37.1% Never married46.8% Now married0.0% Separated0.0% Widowed16.1% DivorcedWomen who did not give birth in the past 12 months Now married:
32.4% (12)Unmarried:
67.6% (25)
Marital status - Native Hawaiian / Pacific Islander population 15 years and over
Males 100.0% Never married0.0% Now married0.0% Separated0.0% Widowed0.0% DivorcedFemales 0.0% Never married100.0% Now married0.0% Separated0.0% Widowed0.0% DivorcedWomen who did not give birth in the past 12 months Now married:
100.0% (9)Unmarried:
0.0% (0)
Marital status - Other race population 15 years and over
Males 17.6% Never married50.0% Now married0.0% Separated2.8% Widowed29.6% DivorcedFemales 28.7% Never married34.3% Now married12.0% Separated21.3% Widowed3.7% DivorcedWomen who did not give birth in the past 12 months Now married:
16.7% (8)Unmarried:
83.3% (40)
Marital status - Two or more races population 15 years and over
Males 28.3% Never married58.0% Now married4.6% Separated0.0% Widowed9.2% DivorcedFemales 30.5% Never married45.5% Now married0.0% Separated5.5% Widowed18.5% DivorcedWomen who did not give birth in the past 12 months Now married:
50.0% (94)Unmarried:
50.0% (94)
Marital status - White alone, not Hispanic / Latino population 15 years and over
Males 28.1% Never married54.0% Now married0.9% Separated4.3% Widowed12.8% DivorcedFemales 17.8% Never married52.3% Now married3.6% Separated8.6% Widowed17.8% DivorcedWomen who gave birth in the past 12 months Now married:
76.3% (138)Unmarried:
23.7% (43)
Women who did not give birth in the past 12 months Now married:
55.0% (719)Unmarried:
45.0% (588)
Marital status - Hispanic or Latino population 15 years and over
Males 34.4% Never married39.3% Now married1.8% Separated7.7% Widowed16.8% DivorcedFemales 34.0% Never married37.2% Now married2.1% Separated13.5% Widowed13.2% DivorcedWomen who did not give birth in the past 12 months Now married:
38.6% (161)Unmarried:
61.4% (256)
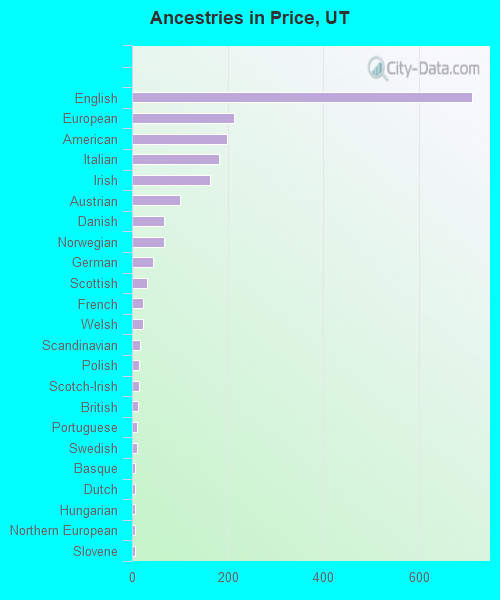
Ancestries in Price
712 21.1% English213 6.3% European198 5.9% American183 5.4% Italian164 4.9% Irish100 3.0% Austrian66 2.0% Danish66 2.0% Norwegian43 1.3% German31 0.9% Scottish24 0.7% French23 0.7% Welsh16 0.5% Scandinavian15 0.4% Polish15 0.4% Scotch-Irish12 0.4% British11 0.3% Portuguese10 0.3% Swedish7 0.2% Basque7 0.2% Dutch7 0.2% Hungarian7 0.2% Northern European7 0.2% Slovene6 0.2% Brazilian4 0.1% Icelander
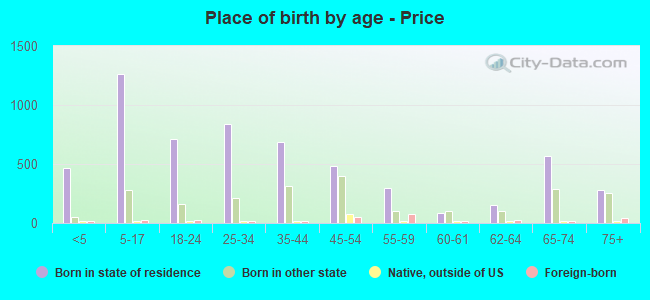
Children Nativity (place of birth) in Price
Children under 6 years - Living with two parents Both parents native 596 100.0% NativeChildren under 6 years - Living with one parent Native parent 104 100.0% NativeChildren 6 to 17 years - Living with two parents Both parents native 890 100.0% NativeBoth parents foreign-born 28 63.1% Native16 36.9% Foreign-bornChildren 6 to 17 years - Living with one parent Native parent 325 100.0% Native
Grandparents responsible for own grandchildren in Price
Grandparents (30 to 59 years) White / Caucasian 31 100.0% Not responsible for grandchildrenAmerican Indian / Alaska Native 8 100.0% Responsible for grandchildrenTwo or more races 47 100.0% Not responsible for grandchildrenWhite alone, not Hispanic / Latino 33 100.0% Not responsible for grandchildrenHispanic or Latino 6 31.3% Responsible for grandchildren14 68.7% Not responsible for grandchildrenGrandparents (60 years and over) White / Caucasian 22 46.1% Responsible for grandchildren26 53.9% Not responsible for grandchildrenAmerican Indian / Alaska Native 9 100.0% Responsible for grandchildrenTwo or more races 30 100.0% Not responsible for grandchildrenWhite alone, not Hispanic / Latino 16 37.3% Responsible for grandchildren27 62.7% Not responsible for grandchildrenHispanic or Latino 8 100.0% Responsible for grandchildren