Races in Pueblo West, Colorado (CO) Detailed Stats
Data:
Races - White alone (%)
Races - White alone (% change since 2000)
Races - Black alone (%)
Races - Black alone (% change since 2000)
Races - American Indian alone (%)
Races - American Indian alone (% change since 2000)
Races - Asian alone (%)
Races - Asian alone (% change since 2000)
Races - Hispanic (%)
Races - Hispanic (% change since 2000)
Races - Native Hawaiian and Other Pacific Islander alone (%)
Races - Native Hawaiian and Other Pacific Islander alone (% change since 2000)
Races - Two or more races(%)
Races - Two or more races(% change since 2000)
Races - Other race alone (%)
Races - Other race alone (% change since 2000)
Racial diversity
Place of birth - Born in state of residence (%)
Place of birth - Born in state of residence (%) - White
Place of birth - Born in state of residence (%) - Black or African American
Place of birth - Born in state of residence (%) - Asian
Place of birth - Born in state of residence (%) - Hispanic or Latino
Place of birth - Born in state of residence (%) - American Indian and Alaska Native
Place of birth - Born in state of residence (%) - Multirace
Place of birth - Born in state of residence (%) - Other Race
Place of birth - Born in other state (%)
Place of birth - Born in other state (%) - White
Place of birth - Born in other state (%) - Black or African American
Place of birth - Born in other state (%) - Asian
Place of birth - Born in other state (%) - Hispanic or Latino
Place of birth - Born in other state (%) - American Indian and Alaska Native
Place of birth - Born in other state (%) - Multirace
Place of birth - Born in other state (%) - Other Race
Place of birth - Native, outside of US (%)
Place of birth - Native, outside of US (%) - White
Place of birth - Native, outside of US (%) - Black or African American
Place of birth - Native, outside of US (%) - Asian
Place of birth - Native, outside of US (%) - Hispanic or Latino
Place of birth - Native, outside of US (%) - American Indian and Alaska Native
Place of birth - Native, outside of US (%) - Multirace
Place of birth - Native, outside of US (%) - Other Race
Place of birth - Foreign born (%)
Place of birth - Foreign born (%) - White
Place of birth - Foreign born (%) - Black or African American
Place of birth - Foreign born (%) - Asian
Place of birth - Foreign born (%) - Hispanic or Latino
Place of birth - Foreign born (%) - American Indian and Alaska Native
Place of birth - Foreign born (%) - Multirace
Place of birth - Foreign born (%) - Other Race
Residents speaking English at home (%)
Residents speaking English at home - Born in the United States (%)
Residents speaking English at home - Native, born elsewhere (%)
Residents speaking English at home - Foreign born (%)
Residents speaking Spanish at home (%)
Residents speaking Spanish at home - Born in the United States (%)
Residents speaking Spanish at home - Native, born elsewhere (%)
Residents speaking Spanish at home - Foreign born (%)
Residents speaking other language at home (%)
Residents speaking other language at home - Born in the United States (%)
Residents speaking other language at home - Native, born elsewhere (%)
Residents speaking other language at home - Foreign born (%)
Marital status - Never married (%)
Marital status - Now married (%)
Marital status - Separated (%)
Marital status - Widowed (%)
Marital status - Divorced (%)
Ancestries Reported - Arab (%)
Ancestries Reported - Czech (%)
Ancestries Reported - Danish (%)
Ancestries Reported - Dutch (%)
Ancestries Reported - English (%)
Ancestries Reported - French (%)
Ancestries Reported - French Canadian (%)
Ancestries Reported - German (%)
Ancestries Reported - Greek (%)
Ancestries Reported - Hungarian (%)
Ancestries Reported - Irish (%)
Ancestries Reported - Italian (%)
Ancestries Reported - Lithuanian (%)
Ancestries Reported - Norwegian (%)
Ancestries Reported - Polish (%)
Ancestries Reported - Portuguese (%)
Ancestries Reported - Russian (%)
Ancestries Reported - Scotch-Irish (%)
Ancestries Reported - Scottish (%)
Ancestries Reported - Slovak (%)
Ancestries Reported - Subsaharan African (%)
Ancestries Reported - Swedish (%)
Ancestries Reported - Swiss (%)
Ancestries Reported - Ukrainian (%)
Ancestries Reported - United States (%)
Ancestries Reported - Welsh (%)
Ancestries Reported - West Indian (%)
Ancestries Reported - Other (%)
Geographical mobility - Same house 1 year ago (%)
Geographical mobility - Same house 1 year ago (%) - White
Geographical mobility - Same house 1 year ago (%) - Black or African American
Geographical mobility - Same house 1 year ago (%) - Asian
Geographical mobility - Same house 1 year ago (%) - Hispanic or Latino
Geographical mobility - Same house 1 year ago (%) - American Indian and Alaska Native
Geographical mobility - Same house 1 year ago (%) - Multirace
Geographical mobility - Same house 1 year ago (%) - Other Race
Geographical mobility - Moved within same county (%)
Geographical mobility - Moved within same county (%) - White
Geographical mobility - Moved within same county (%) - Black or African American
Geographical mobility - Moved within same county (%) - Asian
Geographical mobility - Moved within same county (%) - Hispanic or Latino
Geographical mobility - Moved within same county (%) - American Indian and Alaska Native
Geographical mobility - Moved within same county (%) - Multirace
Geographical mobility - Moved within same county (%) - Other Race
Geographical mobility - Moved from different county within same state (%)
Geographical mobility - Moved from different county within same state (%) - White
Geographical mobility - Moved from different county within same state (%) - Black or African American
Geographical mobility - Moved from different county within same state (%) - Asian
Geographical mobility - Moved from different county within same state (%) - Hispanic or Latino
Geographical mobility - Moved from different county within same state (%) - American Indian and Alaska Native
Geographical mobility - Moved from different county within same state (%) - Multirace
Geographical mobility - Moved from different county within same state (%) - Other Race
Geographical mobility - Moved from different state (%)
Geographical mobility - Moved from different state (%) - White
Geographical mobility - Moved from different state (%) - Black or African American
Geographical mobility - Moved from different state (%) - Asian
Geographical mobility - Moved from different state (%) - Hispanic or Latino
Geographical mobility - Moved from different state (%) - American Indian and Alaska Native
Geographical mobility - Moved from different state (%) - Multirace
Geographical mobility - Moved from different state (%) - Other Race
Geographical mobility - Moved from abroad (%)
Geographical mobility - Moved from abroad (%) - White
Geographical mobility - Moved from abroad (%) - Black or African American
Geographical mobility - Moved from abroad (%) - Asian
Geographical mobility - Moved from abroad (%) - Hispanic or Latino
Geographical mobility - Moved from abroad (%) - American Indian and Alaska Native
Geographical mobility - Moved from abroad (%) - Multirace
Geographical mobility - Moved from abroad (%) - Other Race
Place of birth for the foreign-born population - Ireland (%)
Place of birth for the foreign-born population - Denmark (%)
Place of birth for the foreign-born population - Norway (%)
Place of birth for the foreign-born population - Sweden (%)
Place of birth for the foreign-born population - United Kingdom (%)
Place of birth for the foreign-born population - England (%)
Place of birth for the foreign-born population - Scotland (%)
Place of birth for the foreign-born population - Other Northern Europe (%)
Place of birth for the foreign-born population - Austria (%)
Place of birth for the foreign-born population - Belgium (%)
Place of birth for the foreign-born population - France (%)
Place of birth for the foreign-born population - Germany (%)
Place of birth for the foreign-born population - Netherlands (%)
Place of birth for the foreign-born population - Switzerland (%)
Place of birth for the foreign-born population - Other Western Europe (%)
Place of birth for the foreign-born population - Greece (%)
Place of birth for the foreign-born population - Italy (%)
Place of birth for the foreign-born population - Portugal (%)
Place of birth for the foreign-born population - Spain (%)
Place of birth for the foreign-born population - Other Southern Europe (%)
Place of birth for the foreign-born population - Albania (%)
Place of birth for the foreign-born population - Belarus (%)
Place of birth for the foreign-born population - Bosnia and Herzegovina (%)
Place of birth for the foreign-born population - Bulgaria (%)
Place of birth for the foreign-born population - Croatia (%)
Place of birth for the foreign-born population - Czechoslovakia (%)
Place of birth for the foreign-born population - Hungary (%)
Place of birth for the foreign-born population - Latvia (%)
Place of birth for the foreign-born population - Lithuania (%)
Place of birth for the foreign-born population - North Macedonia (Macedonia) (%)
Place of birth for the foreign-born population - Moldova (%)
Place of birth for the foreign-born population - Poland (%)
Place of birth for the foreign-born population - Romania (%)
Place of birth for the foreign-born population - Russia (%)
Place of birth for the foreign-born population - Serbia (%)
Place of birth for the foreign-born population - Ukraine (%)
Place of birth for the foreign-born population - Other Eastern Europe (%)
Place of birth for the foreign-born population - China (%)
Place of birth for the foreign-born population - Hong Kong (%)
Place of birth for the foreign-born population - Taiwan (%)
Place of birth for the foreign-born population - Japan (%)
Place of birth for the foreign-born population - Korea (%)
Place of birth for the foreign-born population - Other Eastern Asia (%)
Place of birth for the foreign-born population - Afghanistan (%)
Place of birth for the foreign-born population - Bangladesh (%)
Place of birth for the foreign-born population - India (%)
Place of birth for the foreign-born population - Iran (%)
Place of birth for the foreign-born population - Kazakhstan (%)
Place of birth for the foreign-born population - Nepal (%)
Place of birth for the foreign-born population - Pakistan (%)
Place of birth for the foreign-born population - Sri Lanka (%)
Place of birth for the foreign-born population - Uzbekistan (%)
Place of birth for the foreign-born population - Other South Central Asia (%)
Place of birth for the foreign-born population - Burma (%)
Place of birth for the foreign-born population - Cambodia (%)
Place of birth for the foreign-born population - Indonesia (%)
Place of birth for the foreign-born population - Laos (%)
Place of birth for the foreign-born population - Malaysia (%)
Place of birth for the foreign-born population - Philippines (%)
Place of birth for the foreign-born population - Singapore (%)
Place of birth for the foreign-born population - Thailand (%)
Place of birth for the foreign-born population - Vietnam (%)
Place of birth for the foreign-born population - Other South Eastern Asia (%)
Place of birth for the foreign-born population - Armenia (%)
Place of birth for the foreign-born population - Iraq (%)
Place of birth for the foreign-born population - Israel (%)
Place of birth for the foreign-born population - Jordan (%)
Place of birth for the foreign-born population - Kuwait (%)
Place of birth for the foreign-born population - Lebanon (%)
Place of birth for the foreign-born population - Saudi Arabia (%)
Place of birth for the foreign-born population - Syria (%)
Place of birth for the foreign-born population - Turkey (%)
Place of birth for the foreign-born population - Yemen (%)
Place of birth for the foreign-born population - Other Western Asia (%)
Place of birth for the foreign-born population - Eritrea (%)
Place of birth for the foreign-born population - Ethiopia (%)
Place of birth for the foreign-born population - Kenya (%)
Place of birth for the foreign-born population - Somalia (%)
Place of birth for the foreign-born population - Uganda (%)
Place of birth for the foreign-born population - Zimbabwe (%)
Place of birth for the foreign-born population - Other Eastern Africa (%)
Place of birth for the foreign-born population - Cameroon (%)
Place of birth for the foreign-born population - Congo (%)
Place of birth for the foreign-born population - Democratic Republic of Congo (Zaire) (%)
Place of birth for the foreign-born population - Other Middle Africa (%)
Place of birth for the foreign-born population - Egypt (%)
Place of birth for the foreign-born population - Morocco (%)
Place of birth for the foreign-born population - Sudan (%)
Place of birth for the foreign-born population - Other Northern Africa (%)
Place of birth for the foreign-born population - South Africa (%)
Place of birth for the foreign-born population - Other Southern Africa (%)
Place of birth for the foreign-born population - Cabo Verde (%)
Place of birth for the foreign-born population - Ghana (%)
Place of birth for the foreign-born population - Liberia (%)
Place of birth for the foreign-born population - Nigeria (%)
Place of birth for the foreign-born population - Senegal (%)
Place of birth for the foreign-born population - Sierra Leone (%)
Place of birth for the foreign-born population - Other Western Africa (%)
Place of birth for the foreign-born population - Australia (%)
Place of birth for the foreign-born population - New Zealand (%)
Place of birth for the foreign-born population - Fiji (%)
Place of birth for the foreign-born population - Micronesia (%)
Place of birth for the foreign-born population - Bahamas (%)
Place of birth for the foreign-born population - Barbados (%)
Place of birth for the foreign-born population - Cuba (%)
Place of birth for the foreign-born population - Dominica (%)
Place of birth for the foreign-born population - Dominican Republic (%)
Place of birth for the foreign-born population - Grenada (%)
Place of birth for the foreign-born population - Haiti (%)
Place of birth for the foreign-born population - Jamaica (%)
Place of birth for the foreign-born population - St. Vincent and the Grenadines (%)
Place of birth for the foreign-born population - Trinidad and Tobago (%)
Place of birth for the foreign-born population - West Indies (%)
Place of birth for the foreign-born population - Other Caribbean (%)
Place of birth for the foreign-born population - Belize (%)
Place of birth for the foreign-born population - Costa Rica (%)
Place of birth for the foreign-born population - El Salvador (%)
Place of birth for the foreign-born population - Guatemala (%)
Place of birth for the foreign-born population - Honduras (%)
Place of birth for the foreign-born population - Mexico (%)
Place of birth for the foreign-born population - Nicaragua (%)
Place of birth for the foreign-born population - Panama (%)
Place of birth for the foreign-born population - Other Central America (%)
Place of birth for the foreign-born population - Argentina (%)
Place of birth for the foreign-born population - Bolivia (%)
Place of birth for the foreign-born population - Brazil (%)
Place of birth for the foreign-born population - Chile (%)
Place of birth for the foreign-born population - Colombia (%)
Place of birth for the foreign-born population - Ecuador (%)
Place of birth for the foreign-born population - Guyana (%)
Place of birth for the foreign-born population - Peru (%)
Place of birth for the foreign-born population - Uruguay (%)
Place of birth for the foreign-born population - Venezuela (%)
Place of birth for the foreign-born population - Other South America (%)
Place of birth for the foreign-born population - Canada (%)
Place of birth for the foreign-born population - Other Northern America (%)
Place of birth for the foreign-born population - Other (%)
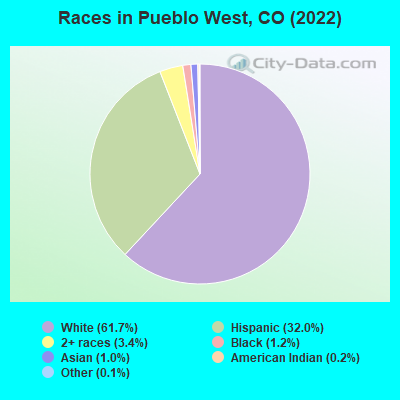
According to 2022 data, the most numerous races in Pueblo West, CO are White alone (22,329 residents), Hispanic (9,136 residents), and Two or more races (1,220 residents). 95.6% of Pueblo West residents speak English at home. 2.5% of Pueblo West, CO residents are foreign-born (0.8% born in Asia, 0.8% born in Latin America, 0.6% born in Europe), which is 254.5% less than the foreign-born rate of 9.0% across the entire state of Colorado.
Race distribution in Pueblo West
2000 2022
3,202,880 74.5% White alone 735,601 17.1% Hispanic 158,443 3.7% Black alone 93,277 2.2% Asian alone 72,721 1.7% Two or more races 28,982 0.7% American Indian alone 5,512 0.1% Other race alone 3,845 0.09% Native Hawaiian and Other
3,793,270 65.0% White alone 1,314,962 22.5% Hispanic 268,754 4.6% Two or more races 220,756 3.8% Black alone 182,658 3.1% Asian alone 29,798 0.5% Other race alone 23,389 0.4% American Indian alone 6,339 0.1% Native Hawaiian and Other
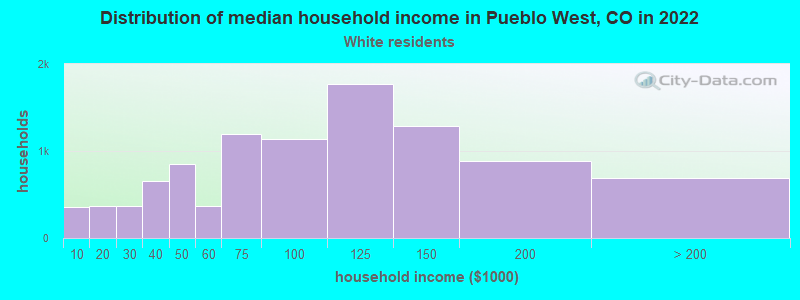
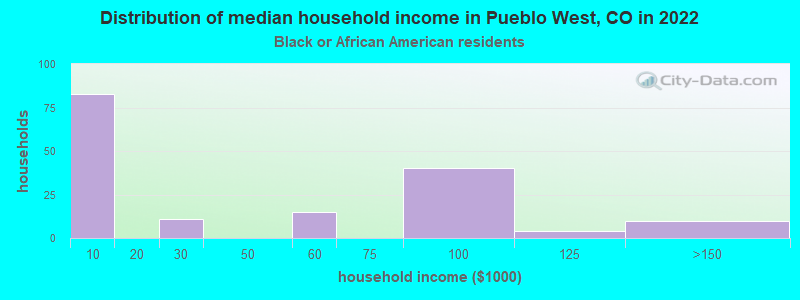
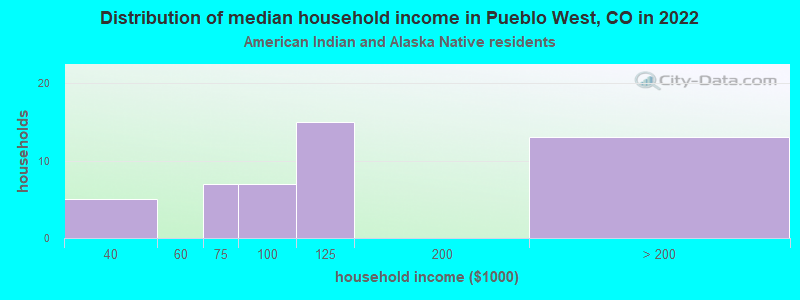
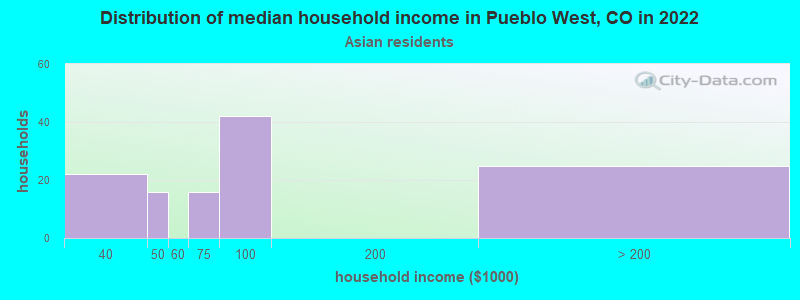
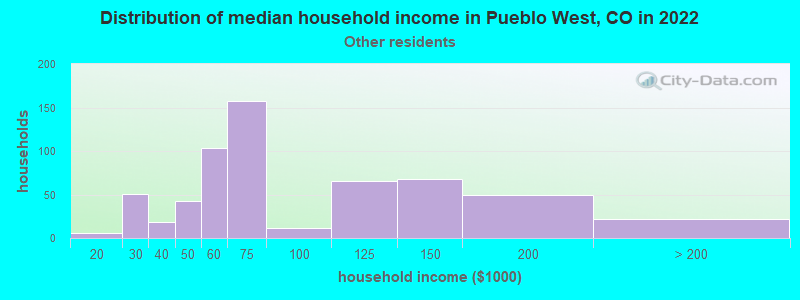
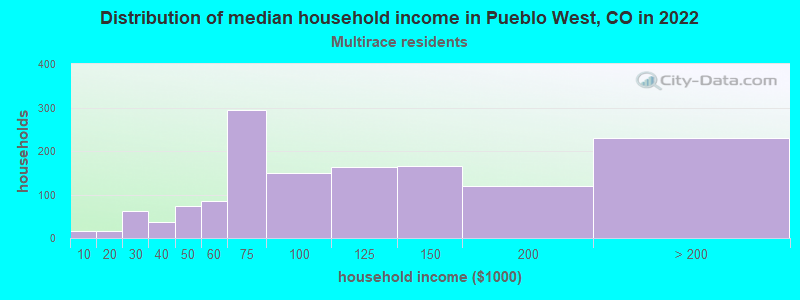
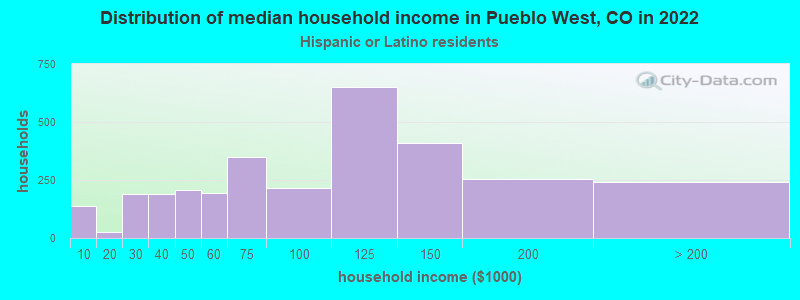
Income and house value in Pueblo West Median household income in 2022 $101,121 White non-Hispanic householders$79,865 Black householders$81,412 American Indian and Alaska Native householders$78,839 Asian householders$81,386 Native Hawaiian and other Pacific Islander householders$86,953 Some other race householders$118,888 Two or more races householders$91,169 Hispanic or Latino race householdersMedian 2022 house value $467,407 White Non-Hispanic householders$490,628 Black or African American householders$258,749 American Indian or Alaska Native householders $539,061 Asian householders$197,047 Native Hawaiian and other Pacific Islander householders$395,422 Some other race householders$518,494 Two or more races householders$412,008 Hispanic or Latino householders
Median age by race in Pueblo West
42.1 Median age for White residents43.1 41.6 42.5 Median age for Black or African American residents44.9 40.4 38.0 Median age for American Indian / Alaska Native residents42.8 29.5 56.1 Median age for Asian residents42.4 61.4 42.2 Median age for Other race residents51.6 37.2 23.0 Median age for Two or more races residents18.2 28.2 45.6 Median age for White alone residents46.6 45.3 31.9 Median age for Hispanic or Latino residents31.3 31.5
Owner/renter occupied households by race in Pueblo West
House owners and renters - White residents 9,305 84.2% Owner occupied1,746 15.8% Renter occupiedHouse owners and renters - Black or African American residents 312 88.9% Owner occupied39 11.1% Renter occupiedHouse owners and renters - American Indian / Alaska Native residents 127 69.0% Owner occupied57 31.0% Renter occupiedHouse owners and renters - Asian residents 58 42.4% Owner occupied78 57.6% Renter occupiedHouse owners and renters - Native Hawaiian / Pacific Islander residents 18 100.0% Owner occupiedHouse owners and renters - Other race residents 259 88.2% Owner occupied35 11.8% Renter occupiedHouse owners and renters - Two or more races residents 616 74.8% Owner occupied208 25.2% Renter occupiedHouse owners and renters - White alone residents 7,979 83.7% Owner occupied1,555 16.3% Renter occupiedHouse owners and renters - Hispanic or Latino residents 2,142 85.3% Owner occupied370 14.7% Renter occupied
Language usage in Pueblo West
English speakers - Total 95.6% of residents of Pueblo West speak English at home.
3.7% of residents speak Spanish at home 929 79.5% Speak English very well240 20.5% Speak English less than very well1.3% of residents speak other language at home 373 89.7% Speak English very well43 10.3% Speak English less than very well
English speakers - Born in the United States 96.2% of residents of Pueblo West speak English at home.
3.3% of residents speak Spanish at home 394 85.7% Speak English very well66 14.3% Speak English less than very well0.6% of residents speak other language at home 78 95.1% Speak English very well4 4.9% Speak English less than very well
English speakers - Native, born elsewhere 92.8% of residents of Pueblo West speak English at home.
6.7% of residents speak other language at home 39 100.0% Speak English very well
English speakers - Foreign-born 53.4% of residents of Pueblo West speak English at home.
27.5% of residents speak Spanish at home 118 51.1% Speak English very well113 48.9% Speak English less than very well22.4% of residents speak other language at home 168 89.4% Speak English very well20 10.6% Speak English less than very well
White (Caucasian) - Speak only English Native:
98.4% (26,291)Foreign-born:
48.8% (263)
White (Caucasian) - Speak another language Native:
2.7% (724)Foreign-born:
50.3% (271)
American Indian / Alaska Native - Speak another language Native:
12.5% (65)Foreign-born:
100.0% (15)
Asian - Speak only English Native:
100.0% (138)Foreign-born:
55.8% (59)
Other race - Speak another language Native:
10.3% (94)Foreign-born:
95.1% (20)
Two or more races - Speak only English Native:
82.7% (2,291)Foreign-born:
54.0% (352)
Two or more races - Speak another language Native:
9.8% (272)Foreign-born:
9.0% (59)
White alone - Speak only English Native:
97.8% (20,521)Foreign-born:
51.0% (248)
White alone - Speak another language Native:
2.2% (464)Foreign-born:
38.8% (188)
Hispanic or Latino - Speak only English Native:
94.6% (8,351)Foreign-born:
8.7% (21)
Hispanic or Latino - Speak another language Native:
8.5% (747)Foreign-born:
91.7% (222)
Foreign-born residents in Pueblo West 844 residents are foreign born (0.8% Asia , 0.8% Latin America , 0.6% Europe ).
This city:
2.5%Colorado:
100.0%
Marital status for residents in Pueblo West Marital status - White (Caucasian) population 15 years and over
Males 25.7% Never married61.3% Now married0.6% Separated2.7% Widowed9.7% DivorcedFemales 21.1% Never married60.5% Now married0.9% Separated5.9% Widowed11.6% DivorcedWomen who gave birth in the past 12 months Now married:
96.3% (199)Unmarried:
3.7% (8)
Women who did not give birth in the past 12 months Now married:
52.5% (3,216)Unmarried:
47.5% (2,906)
Marital status - Black or African American population 15 years and over
Males 31.4% Never married50.0% Now married0.0% Separated0.0% Widowed18.6% DivorcedFemales 56.8% Never married36.5% Now married0.0% Separated0.0% Widowed6.8% DivorcedWomen who did not give birth in the past 12 months Now married:
34.9% (47)Unmarried:
65.1% (87)
Marital status - American Indian / Alaska Native population 15 years and over
Males 32.1% Never married67.9% Now married0.0% Separated0.0% Widowed0.0% DivorcedFemales 44.0% Never married44.4% Now married0.0% Separated0.0% Widowed11.5% DivorcedWomen who did not give birth in the past 12 months Now married:
19.5% (32)Unmarried:
80.5% (130)
Marital status - Asian population 15 years and over
Males 62.7% Never married37.3% Now married0.0% Separated0.0% Widowed0.0% DivorcedFemales 0.0% Never married71.2% Now married8.5% Separated0.0% Widowed20.3% DivorcedWomen who gave birth in the past 12 months Now married:
100.0% (9)Unmarried:
0.0% (0)
Women who did not give birth in the past 12 months Now married:
65.6% (67)Unmarried:
34.4% (35)
Marital status - Other race population 15 years and over
Males 28.3% Never married53.5% Now married0.0% Separated2.7% Widowed15.5% DivorcedFemales 33.6% Never married61.5% Now married0.0% Separated5.0% Widowed0.0% DivorcedWomen who gave birth in the past 12 months Now married:
100.0% (6)Unmarried:
0.0% (0)
Women who did not give birth in the past 12 months Now married:
33.3% (54)Unmarried:
66.7% (108)
Marital status - Two or more races population 15 years and over
Males 45.5% Never married43.4% Now married3.6% Separated2.9% Widowed4.7% DivorcedFemales 28.7% Never married55.7% Now married0.0% Separated0.0% Widowed15.6% DivorcedWomen who did not give birth in the past 12 months Now married:
45.9% (362)Unmarried:
54.1% (426)
Marital status - White alone, not Hispanic / Latino population 15 years and over
Males 22.2% Never married63.9% Now married0.5% Separated3.1% Widowed10.2% DivorcedFemales 17.8% Never married62.9% Now married0.6% Separated6.8% Widowed11.9% DivorcedWomen who gave birth in the past 12 months Now married:
97.3% (143)Unmarried:
2.7% (4)
Women who did not give birth in the past 12 months Now married:
55.7% (2,508)Unmarried:
44.3% (1,994)
Marital status - Hispanic or Latino population 15 years and over
Males 36.8% Never married52.6% Now married1.0% Separated1.3% Widowed8.3% DivorcedFemales 34.0% Never married52.3% Now married1.3% Separated2.2% Widowed10.2% DivorcedWomen who gave birth in the past 12 months Now married:
94.7% (77)Unmarried:
5.3% (4)
Women who did not give birth in the past 12 months Now married:
42.6% (1,054)Unmarried:
57.4% (1,420)
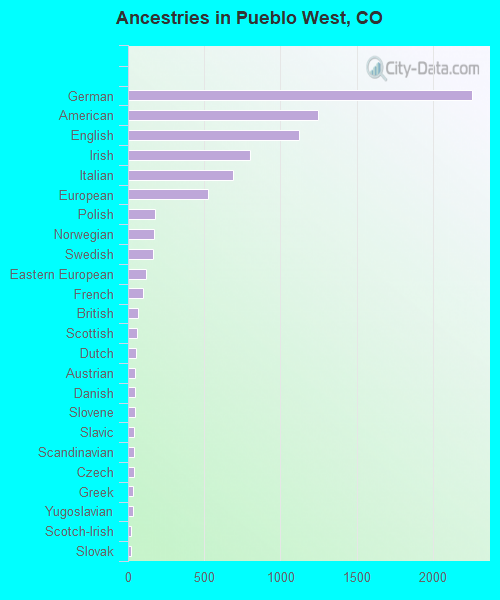
Ancestries in Pueblo West
2,004 15.4% German1,076 8.3% American1,031 7.9% English723 5.6% Irish554 4.3% Italian530 4.1% European212 1.6% Norwegian180 1.4% French170 1.3% Polish141 1.1% Scottish111 0.9% Swedish84 0.6% British68 0.5% Northern European63 0.5% Scandinavian62 0.5% Dutch52 0.4% Danish50 0.4% Greek44 0.3% Slovene44 0.3% Welsh43 0.3% Scotch-Irish30 0.2% Slavic22 0.2% Finnish22 0.2% French Canadian21 0.2% Austrian20 0.2% Canadian20 0.2% Israeli19 0.1% Lithuanian19 0.1% Slovak18 0.1% African16 0.1% Swiss15 0.1% Czech15 0.1% Trinidadian and Tobagonian14 0.1% Hungarian13 0.1% Eastern European12 0.09% German Russian12 0.09% Czechoslovakian12 0.09% Russian7 0.05% Ukrainian6 0.05% Yugoslavian
Geographical mobility in Pueblo West Same house 1 year ago 25,145 91.1% White (Caucasian)440 100.0% Black or African American509 91.1% American Indian / Alaska Native198 85.0% Asian20 94.1% Native Hawaiian / Pacific Islander729 79.3% Other race2,999 92.6% Two or more races19,738 90.5% White alone, not Hispanic / Latino8,064 91.9% Hispanic or LatinoMoved within same county 1,364 4.9% White / Caucasian48 8.6% American Indian / Alaska Native39 16.9% Asian80 8.7% Other race275 8.5% Two or more races1,090 5.0% White alone, not Hispanic / Latino532 6.1% Hispanic or LatinoMoved within same state 704 2.5% White / Caucasian94 10.2% Other race692 3.2% White alone, not Hispanic / Latino47 0.5% Hispanic or LatinoMoved from different state 464 1.7% White / Caucasian12 2.7% Black or African American7 2.9% Asian9 0.3% Two or more races325 1.5% White alone, not Hispanic / Latino108 1.2% Hispanic or LatinoMoved from abroad 38 0.1% White55 0.3% White alone, not Hispanic / Latino28 0.3% Hispanic or Latino
Children Nativity (place of birth) in Pueblo West
Children under 6 years - Living with two parents Both parents native 1,100 100.0% NativeBoth parents foreign-born 11 100.0% NativeOne native, one foreign-born parent 62 100.0% NativeChildren under 6 years - Living with one parent Native parent 348 100.0% NativeForeign-born parent 35 100.0% Native
Children 6 to 17 years - Living with two parents Both parents native 3,574 100.0% NativeBoth parents foreign-born 26 100.0% NativeOne native, one foreign-born parent 338 100.0% NativeChildren 6 to 17 years - Living with one parent Native parent 1,689 100.0% Native
Grandparents responsible for own grandchildren in Pueblo West
Grandparents (30 to 59 years) White / Caucasian 247 64.7% Responsible for grandchildren135 35.3% Not responsible for grandchildrenWhite alone, not Hispanic / Latino 204 54.9% Responsible for grandchildren168 45.1% Not responsible for grandchildrenHispanic or Latino 67 82.1% Responsible for grandchildren15 17.9% Not responsible for grandchildrenGrandparents (60 years and over) White / Caucasian 228 38.0% Responsible for grandchildren373 62.0% Not responsible for grandchildrenWhite alone, not Hispanic / Latino 147 41.3% Responsible for grandchildren209 58.7% Not responsible for grandchildrenHispanic or Latino 60 21.7% Responsible for grandchildren218 78.3% Not responsible for grandchildren