Races in Quincy, Massachusetts (MA) Detailed Stats
Data:
Races - White alone (%)
Races - White alone (% change since 2000)
Races - Black alone (%)
Races - Black alone (% change since 2000)
Races - American Indian alone (%)
Races - American Indian alone (% change since 2000)
Races - Asian alone (%)
Races - Asian alone (% change since 2000)
Races - Hispanic (%)
Races - Hispanic (% change since 2000)
Races - Native Hawaiian and Other Pacific Islander alone (%)
Races - Native Hawaiian and Other Pacific Islander alone (% change since 2000)
Races - Two or more races(%)
Races - Two or more races(% change since 2000)
Races - Other race alone (%)
Races - Other race alone (% change since 2000)
Racial diversity
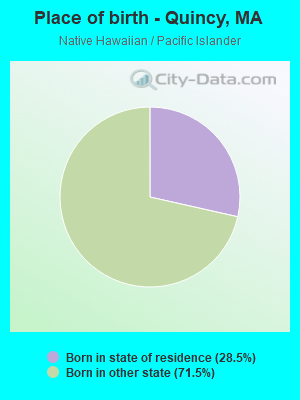
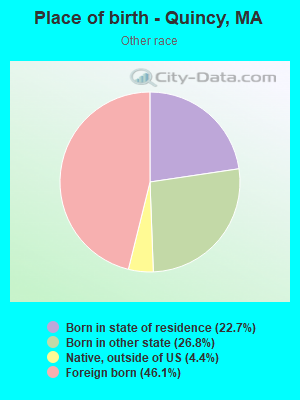
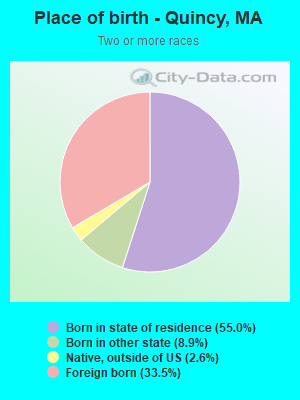
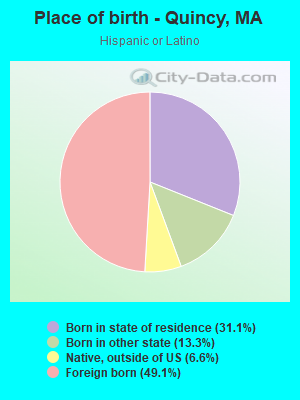
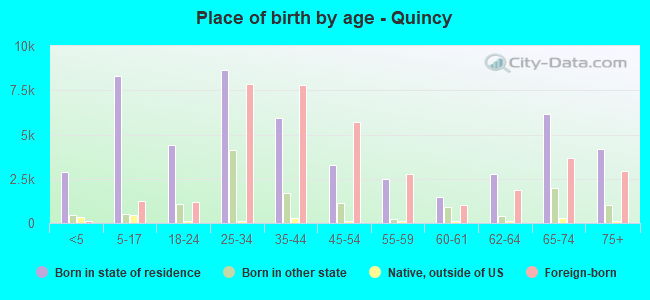
Place of birth - Born in state of residence (%)
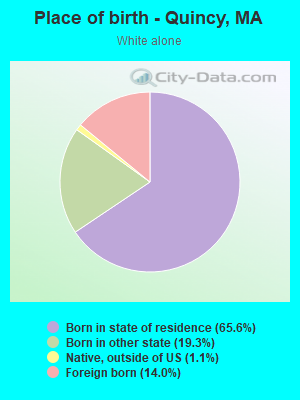
Place of birth - Born in state of residence (%) - White
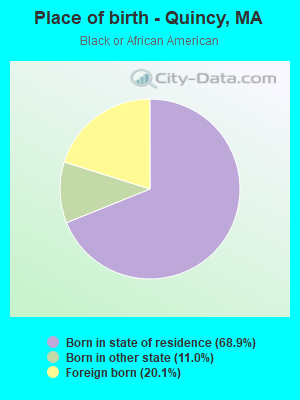
Place of birth - Born in state of residence (%) - Black or African American
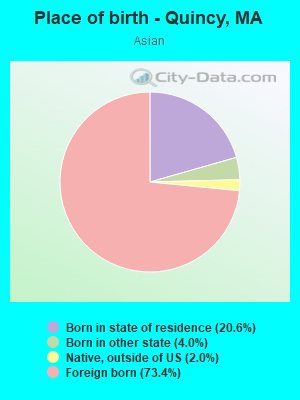
Place of birth - Born in state of residence (%) - Asian
Place of birth - Born in state of residence (%) - Hispanic or Latino
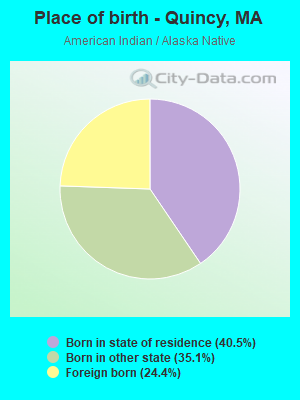
Place of birth - Born in state of residence (%) - American Indian and Alaska Native
Place of birth - Born in state of residence (%) - Multirace
Place of birth - Born in state of residence (%) - Other Race
Place of birth - Born in other state (%)
Place of birth - Born in other state (%) - White
Place of birth - Born in other state (%) - Black or African American
Place of birth - Born in other state (%) - Asian
Place of birth - Born in other state (%) - Hispanic or Latino
Place of birth - Born in other state (%) - American Indian and Alaska Native
Place of birth - Born in other state (%) - Multirace
Place of birth - Born in other state (%) - Other Race
Place of birth - Native, outside of US (%)
Place of birth - Native, outside of US (%) - White
Place of birth - Native, outside of US (%) - Black or African American
Place of birth - Native, outside of US (%) - Asian
Place of birth - Native, outside of US (%) - Hispanic or Latino
Place of birth - Native, outside of US (%) - American Indian and Alaska Native
Place of birth - Native, outside of US (%) - Multirace
Place of birth - Native, outside of US (%) - Other Race
Place of birth - Foreign born (%)
Place of birth - Foreign born (%) - White
Place of birth - Foreign born (%) - Black or African American
Place of birth - Foreign born (%) - Asian
Place of birth - Foreign born (%) - Hispanic or Latino
Place of birth - Foreign born (%) - American Indian and Alaska Native
Place of birth - Foreign born (%) - Multirace
Place of birth - Foreign born (%) - Other Race
Residents speaking English at home (%)
Residents speaking English at home - Born in the United States (%)
Residents speaking English at home - Native, born elsewhere (%)
Residents speaking English at home - Foreign born (%)
Residents speaking Spanish at home (%)
Residents speaking Spanish at home - Born in the United States (%)
Residents speaking Spanish at home - Native, born elsewhere (%)
Residents speaking Spanish at home - Foreign born (%)
Residents speaking other language at home (%)
Residents speaking other language at home - Born in the United States (%)
Residents speaking other language at home - Native, born elsewhere (%)
Residents speaking other language at home - Foreign born (%)
Marital status - Never married (%)
Marital status - Now married (%)
Marital status - Separated (%)
Marital status - Widowed (%)
Marital status - Divorced (%)
Ancestries Reported - Arab (%)
Ancestries Reported - Czech (%)
Ancestries Reported - Danish (%)
Ancestries Reported - Dutch (%)
Ancestries Reported - English (%)
Ancestries Reported - French (%)
Ancestries Reported - French Canadian (%)
Ancestries Reported - German (%)
Ancestries Reported - Greek (%)
Ancestries Reported - Hungarian (%)
Ancestries Reported - Irish (%)
Ancestries Reported - Italian (%)
Ancestries Reported - Lithuanian (%)
Ancestries Reported - Norwegian (%)
Ancestries Reported - Polish (%)
Ancestries Reported - Portuguese (%)
Ancestries Reported - Russian (%)
Ancestries Reported - Scotch-Irish (%)
Ancestries Reported - Scottish (%)
Ancestries Reported - Slovak (%)
Ancestries Reported - Subsaharan African (%)
Ancestries Reported - Swedish (%)
Ancestries Reported - Swiss (%)
Ancestries Reported - Ukrainian (%)
Ancestries Reported - United States (%)
Ancestries Reported - Welsh (%)
Ancestries Reported - West Indian (%)
Ancestries Reported - Other (%)
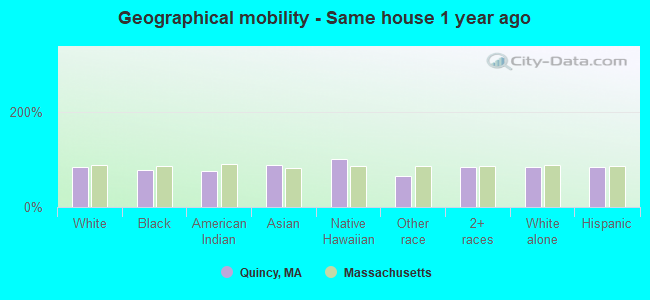
Geographical mobility - Same house 1 year ago (%)
Geographical mobility - Same house 1 year ago (%) - White
Geographical mobility - Same house 1 year ago (%) - Black or African American
Geographical mobility - Same house 1 year ago (%) - Asian
Geographical mobility - Same house 1 year ago (%) - Hispanic or Latino
Geographical mobility - Same house 1 year ago (%) - American Indian and Alaska Native
Geographical mobility - Same house 1 year ago (%) - Multirace
Geographical mobility - Same house 1 year ago (%) - Other Race
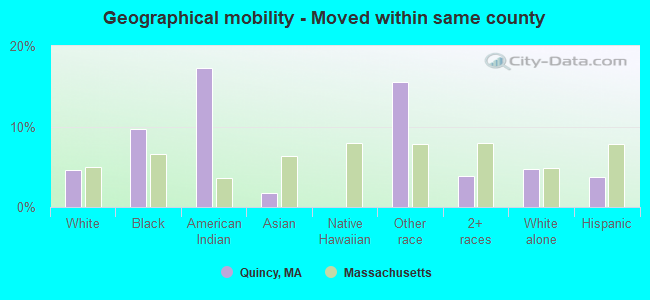
Geographical mobility - Moved within same county (%)
Geographical mobility - Moved within same county (%) - White
Geographical mobility - Moved within same county (%) - Black or African American
Geographical mobility - Moved within same county (%) - Asian
Geographical mobility - Moved within same county (%) - Hispanic or Latino
Geographical mobility - Moved within same county (%) - American Indian and Alaska Native
Geographical mobility - Moved within same county (%) - Multirace
Geographical mobility - Moved within same county (%) - Other Race
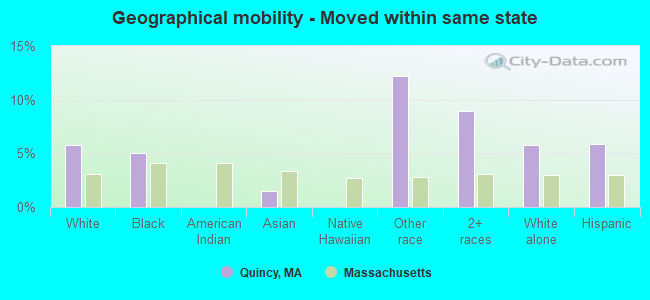
Geographical mobility - Moved from different county within same state (%)
Geographical mobility - Moved from different county within same state (%) - White
Geographical mobility - Moved from different county within same state (%) - Black or African American
Geographical mobility - Moved from different county within same state (%) - Asian
Geographical mobility - Moved from different county within same state (%) - Hispanic or Latino
Geographical mobility - Moved from different county within same state (%) - American Indian and Alaska Native
Geographical mobility - Moved from different county within same state (%) - Multirace
Geographical mobility - Moved from different county within same state (%) - Other Race
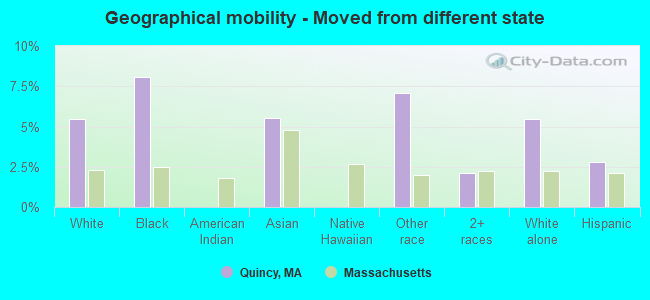
Geographical mobility - Moved from different state (%)
Geographical mobility - Moved from different state (%) - White
Geographical mobility - Moved from different state (%) - Black or African American
Geographical mobility - Moved from different state (%) - Asian
Geographical mobility - Moved from different state (%) - Hispanic or Latino
Geographical mobility - Moved from different state (%) - American Indian and Alaska Native
Geographical mobility - Moved from different state (%) - Multirace
Geographical mobility - Moved from different state (%) - Other Race
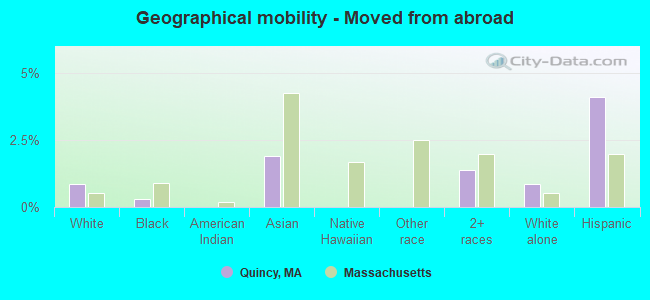
Geographical mobility - Moved from abroad (%)
Geographical mobility - Moved from abroad (%) - White
Geographical mobility - Moved from abroad (%) - Black or African American
Geographical mobility - Moved from abroad (%) - Asian
Geographical mobility - Moved from abroad (%) - Hispanic or Latino
Geographical mobility - Moved from abroad (%) - American Indian and Alaska Native
Geographical mobility - Moved from abroad (%) - Multirace
Geographical mobility - Moved from abroad (%) - Other Race
Place of birth for the foreign-born population - Ireland (%)
Place of birth for the foreign-born population - Denmark (%)
Place of birth for the foreign-born population - Norway (%)
Place of birth for the foreign-born population - Sweden (%)
Place of birth for the foreign-born population - United Kingdom (%)
Place of birth for the foreign-born population - England (%)
Place of birth for the foreign-born population - Scotland (%)
Place of birth for the foreign-born population - Other Northern Europe (%)
Place of birth for the foreign-born population - Austria (%)
Place of birth for the foreign-born population - Belgium (%)
Place of birth for the foreign-born population - France (%)
Place of birth for the foreign-born population - Germany (%)
Place of birth for the foreign-born population - Netherlands (%)
Place of birth for the foreign-born population - Switzerland (%)
Place of birth for the foreign-born population - Other Western Europe (%)
Place of birth for the foreign-born population - Greece (%)
Place of birth for the foreign-born population - Italy (%)
Place of birth for the foreign-born population - Portugal (%)
Place of birth for the foreign-born population - Spain (%)
Place of birth for the foreign-born population - Other Southern Europe (%)
Place of birth for the foreign-born population - Albania (%)
Place of birth for the foreign-born population - Belarus (%)
Place of birth for the foreign-born population - Bosnia and Herzegovina (%)
Place of birth for the foreign-born population - Bulgaria (%)
Place of birth for the foreign-born population - Croatia (%)
Place of birth for the foreign-born population - Czechoslovakia (%)
Place of birth for the foreign-born population - Hungary (%)
Place of birth for the foreign-born population - Latvia (%)
Place of birth for the foreign-born population - Lithuania (%)
Place of birth for the foreign-born population - North Macedonia (Macedonia) (%)
Place of birth for the foreign-born population - Moldova (%)
Place of birth for the foreign-born population - Poland (%)
Place of birth for the foreign-born population - Romania (%)
Place of birth for the foreign-born population - Russia (%)
Place of birth for the foreign-born population - Serbia (%)
Place of birth for the foreign-born population - Ukraine (%)
Place of birth for the foreign-born population - Other Eastern Europe (%)
Place of birth for the foreign-born population - China (%)
Place of birth for the foreign-born population - Hong Kong (%)
Place of birth for the foreign-born population - Taiwan (%)
Place of birth for the foreign-born population - Japan (%)
Place of birth for the foreign-born population - Korea (%)
Place of birth for the foreign-born population - Other Eastern Asia (%)
Place of birth for the foreign-born population - Afghanistan (%)
Place of birth for the foreign-born population - Bangladesh (%)
Place of birth for the foreign-born population - India (%)
Place of birth for the foreign-born population - Iran (%)
Place of birth for the foreign-born population - Kazakhstan (%)
Place of birth for the foreign-born population - Nepal (%)
Place of birth for the foreign-born population - Pakistan (%)
Place of birth for the foreign-born population - Sri Lanka (%)
Place of birth for the foreign-born population - Uzbekistan (%)
Place of birth for the foreign-born population - Other South Central Asia (%)
Place of birth for the foreign-born population - Burma (%)
Place of birth for the foreign-born population - Cambodia (%)
Place of birth for the foreign-born population - Indonesia (%)
Place of birth for the foreign-born population - Laos (%)
Place of birth for the foreign-born population - Malaysia (%)
Place of birth for the foreign-born population - Philippines (%)
Place of birth for the foreign-born population - Singapore (%)
Place of birth for the foreign-born population - Thailand (%)
Place of birth for the foreign-born population - Vietnam (%)
Place of birth for the foreign-born population - Other South Eastern Asia (%)
Place of birth for the foreign-born population - Armenia (%)
Place of birth for the foreign-born population - Iraq (%)
Place of birth for the foreign-born population - Israel (%)
Place of birth for the foreign-born population - Jordan (%)
Place of birth for the foreign-born population - Kuwait (%)
Place of birth for the foreign-born population - Lebanon (%)
Place of birth for the foreign-born population - Saudi Arabia (%)
Place of birth for the foreign-born population - Syria (%)
Place of birth for the foreign-born population - Turkey (%)
Place of birth for the foreign-born population - Yemen (%)
Place of birth for the foreign-born population - Other Western Asia (%)
Place of birth for the foreign-born population - Eritrea (%)
Place of birth for the foreign-born population - Ethiopia (%)
Place of birth for the foreign-born population - Kenya (%)
Place of birth for the foreign-born population - Somalia (%)
Place of birth for the foreign-born population - Uganda (%)
Place of birth for the foreign-born population - Zimbabwe (%)
Place of birth for the foreign-born population - Other Eastern Africa (%)
Place of birth for the foreign-born population - Cameroon (%)
Place of birth for the foreign-born population - Congo (%)
Place of birth for the foreign-born population - Democratic Republic of Congo (Zaire) (%)
Place of birth for the foreign-born population - Other Middle Africa (%)
Place of birth for the foreign-born population - Egypt (%)
Place of birth for the foreign-born population - Morocco (%)
Place of birth for the foreign-born population - Sudan (%)
Place of birth for the foreign-born population - Other Northern Africa (%)
Place of birth for the foreign-born population - South Africa (%)
Place of birth for the foreign-born population - Other Southern Africa (%)
Place of birth for the foreign-born population - Cabo Verde (%)
Place of birth for the foreign-born population - Ghana (%)
Place of birth for the foreign-born population - Liberia (%)
Place of birth for the foreign-born population - Nigeria (%)
Place of birth for the foreign-born population - Senegal (%)
Place of birth for the foreign-born population - Sierra Leone (%)
Place of birth for the foreign-born population - Other Western Africa (%)
Place of birth for the foreign-born population - Australia (%)
Place of birth for the foreign-born population - New Zealand (%)
Place of birth for the foreign-born population - Fiji (%)
Place of birth for the foreign-born population - Micronesia (%)
Place of birth for the foreign-born population - Bahamas (%)
Place of birth for the foreign-born population - Barbados (%)
Place of birth for the foreign-born population - Cuba (%)
Place of birth for the foreign-born population - Dominica (%)
Place of birth for the foreign-born population - Dominican Republic (%)
Place of birth for the foreign-born population - Grenada (%)
Place of birth for the foreign-born population - Haiti (%)
Place of birth for the foreign-born population - Jamaica (%)
Place of birth for the foreign-born population - St. Vincent and the Grenadines (%)
Place of birth for the foreign-born population - Trinidad and Tobago (%)
Place of birth for the foreign-born population - West Indies (%)
Place of birth for the foreign-born population - Other Caribbean (%)
Place of birth for the foreign-born population - Belize (%)
Place of birth for the foreign-born population - Costa Rica (%)
Place of birth for the foreign-born population - El Salvador (%)
Place of birth for the foreign-born population - Guatemala (%)
Place of birth for the foreign-born population - Honduras (%)
Place of birth for the foreign-born population - Mexico (%)
Place of birth for the foreign-born population - Nicaragua (%)
Place of birth for the foreign-born population - Panama (%)
Place of birth for the foreign-born population - Other Central America (%)
Place of birth for the foreign-born population - Argentina (%)
Place of birth for the foreign-born population - Bolivia (%)
Place of birth for the foreign-born population - Brazil (%)
Place of birth for the foreign-born population - Chile (%)
Place of birth for the foreign-born population - Colombia (%)
Place of birth for the foreign-born population - Ecuador (%)
Place of birth for the foreign-born population - Guyana (%)
Place of birth for the foreign-born population - Peru (%)
Place of birth for the foreign-born population - Uruguay (%)
Place of birth for the foreign-born population - Venezuela (%)
Place of birth for the foreign-born population - Other South America (%)
Place of birth for the foreign-born population - Canada (%)
Place of birth for the foreign-born population - Other Northern America (%)
Place of birth for the foreign-born population - Other (%)
Latest news about races in Quincy, MA collected exclusively by city-data.com from local newspapers, TV, and radio stations
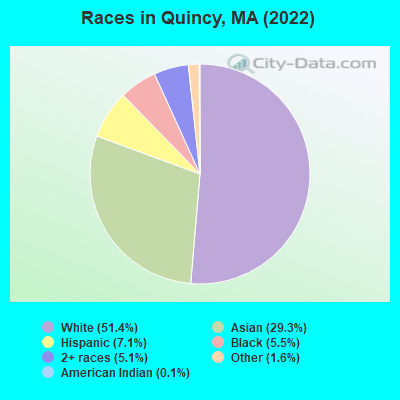
According to 2022 data, the most numerous races in Quincy, MA are White alone (52,258 residents), Hispanic (7,175 residents), and Asian alone (29,816 residents). 58.1% of Quincy residents speak English at home. 33.7% of Quincy, MA residents are foreign-born (21.8% born in Asia, 4.6% born in Europe, 3.4% born in Latin America), which is 46.6% greater than the foreign-born rate of 18.0% across the entire state of Massachusetts.
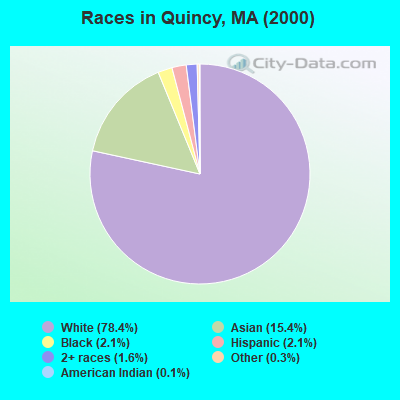
Race distribution in Quincy
2000 2022
68,980 78.4% White alone 13,519 15.4% Asian alone 1,835 2.1% Hispanic 1,846 2.1% Black alone 1,407 1.6% Two or more races 290 0.3% Other race alone 129 0.1% American Indian alone 19 0.02% Native Hawaiian and Other
52,258 51.4% White alone 29,816 29.3% Asian alone 7,175 7.1% Hispanic 5,584 5.5% Black alone 5,169 5.1% Two or more races 1,606 1.6% Other race alone 108 0.1% American Indian alone
2000 2022
5,198,359 81.9% White alone 428,729 6.8% Hispanic 318,329 5.0% Black alone 236,786 3.7% Asian alone 110,338 1.7% Two or more races 43,586 0.7% Other race alone 11,264 0.2% American Indian alone 1,706 0.03% Native Hawaiian and Other
4,676,627 67.0% White alone 911,038 13.0% Hispanic 501,463 7.2% Asian alone 459,740 6.6% Black alone 341,889 4.9% Two or more races 84,403 1.2% Other race alone 5,838 0.08% American Indian alone 976 0.01% Native Hawaiian and Other
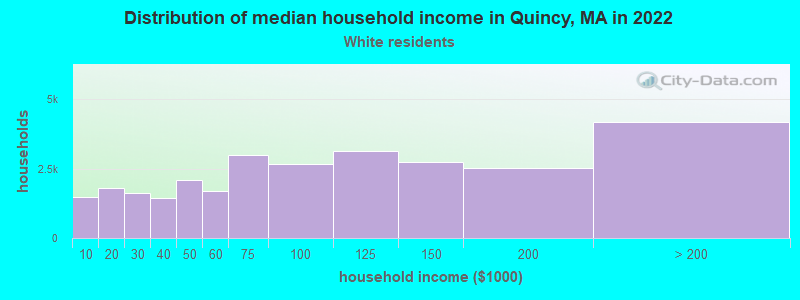
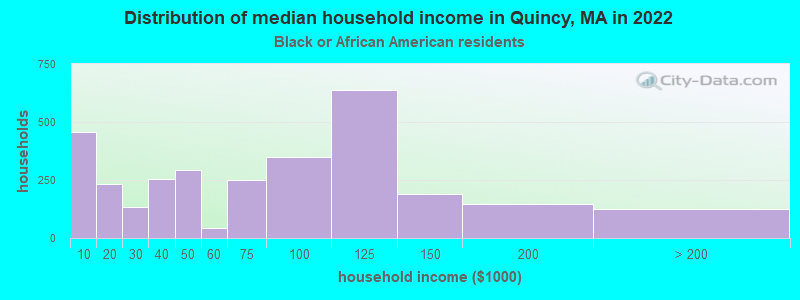
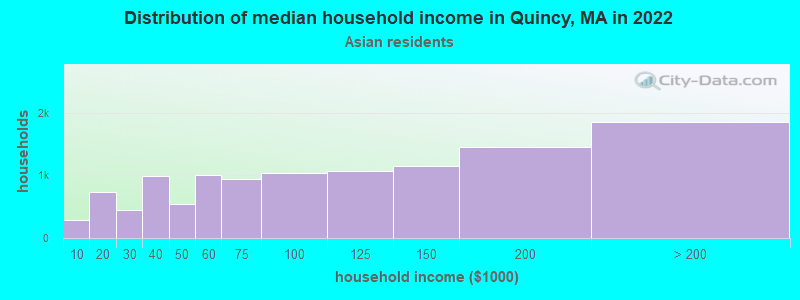
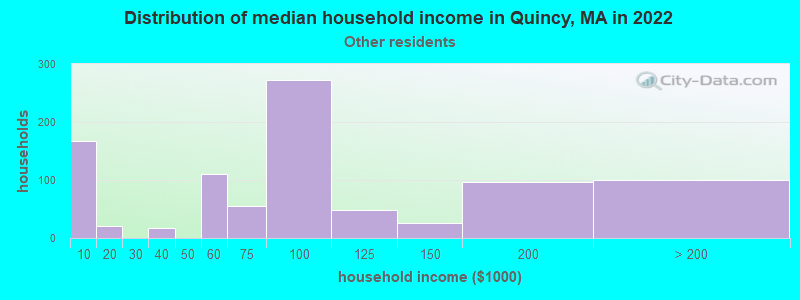
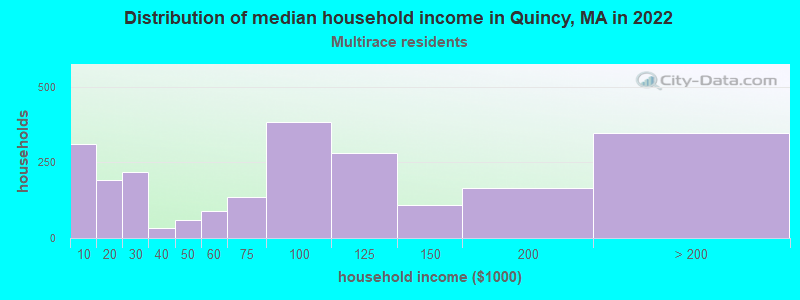
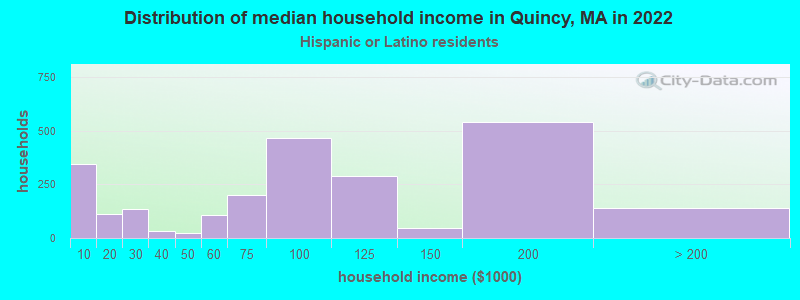
Income and house value in Quincy Median household income in 2022 $81,402 White non-Hispanic householders$80,403 Black householders$97,704 Asian householders$103,536 Some other race householders$92,249 Two or more races householders$91,867 Hispanic or Latino race householdersMedian 2022 house value $611,370 White Non-Hispanic householders$712,662 Black or African American householders$452,196 American Indian or Alaska Native householders $599,202 Asian householders$616,632 Some other race householders$578,154 Two or more races householders$712,662 Hispanic or Latino householders
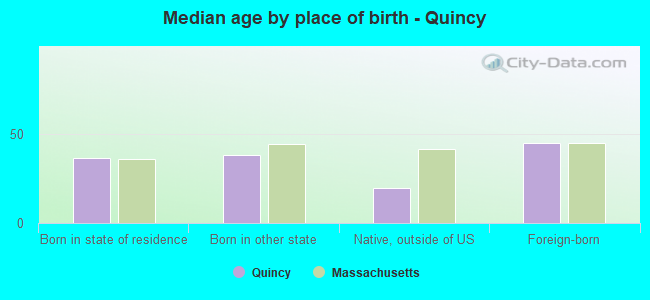
Median age by race in Quincy
47.9 Median age for White residents41.4 54.0 30.1 Median age for Black or African American residents29.7 31.0 -666,666,666.0 Median age for American Indian / Alaska Native residents-666,666,666.0 -666,666,666.0 40.9 Median age for Asian residents40.6 41.4 -666,666,666.0 Median age for Native Hawaiian / Pacific Islander residents-666,666,666.0 -666,666,666.0 30.7 Median age for Other race residents32.7 25.9 31.5 Median age for Two or more races residents32.6 26.7 48.3 Median age for White alone residents41.5 54.2 35.7 Median age for Hispanic or Latino residents32.4 38.4
Owner/renter occupied households by race in Quincy
House owners and renters - White residents 13,591 48.0% Owner occupied14,749 52.0% Renter occupiedHouse owners and renters - Black or African American residents 269 9.6% Owner occupied2,520 90.4% Renter occupiedHouse owners and renters - American Indian / Alaska Native residents 8 19.9% Owner occupied34 80.1% Renter occupiedHouse owners and renters - Asian residents 7,220 62.6% Owner occupied4,311 37.4% Renter occupiedHouse owners and renters - Native Hawaiian / Pacific Islander residents 49 100.0% Owner occupiedHouse owners and renters - Other race residents 221 16.6% Owner occupied1,107 83.4% Renter occupiedHouse owners and renters - Two or more races residents 1,234 44.9% Owner occupied1,514 55.1% Renter occupiedHouse owners and renters - White alone residents 13,591 48.0% Owner occupied14,700 52.0% Renter occupiedHouse owners and renters - Hispanic or Latino residents 748 31.3% Owner occupied1,638 68.7% Renter occupied
Language usage in Quincy
English speakers - Total 58.1% of residents of Quincy speak English at home.
4.8% of residents speak Spanish at home 3,616 76.8% Speak English very well1,091 23.2% Speak English less than very well37.1% of residents speak other language at home 16,588 45.6% Speak English very well19,824 54.4% Speak English less than very well
English speakers - Born in the United States 84.3% of residents of Quincy speak English at home.
3.8% of residents speak Spanish at home 491 100.0% Speak English very well12.0% of residents speak other language at home 1,279 81.7% Speak English very well286 18.3% Speak English less than very well
English speakers - Native, born elsewhere 33.1% of residents of Quincy speak English at home.
36.4% of residents speak Spanish at home 426 90.4% Speak English very well45 9.6% Speak English less than very well30.5% of residents speak other language at home 333 84.3% Speak English very well62 15.7% Speak English less than very well
English speakers - Foreign-born 12.5% of residents of Quincy speak English at home.
6.6% of residents speak Spanish at home 1,632 69.0% Speak English very well732 31.0% Speak English less than very well81.0% of residents speak other language at home 10,661 36.6% Speak English very well18,492 63.4% Speak English less than very well
White (Caucasian) - Speak only English Native:
94.3% (41,641)Foreign-born:
26.5% (1,932)
White (Caucasian) - Speak another language Native:
5.7% (2,518)Foreign-born:
73.5% (5,358)
Black or African American - Speak only English Native:
83.5% (3,119)Foreign-born:
16.9% (350)
Black or African American - Speak another language Native:
16.4% (612)Foreign-born:
85.4% (1,768)
American Indian / Alaska Native - Speak another language Native:
19.4% (21)Foreign-born:
100.0% (41)
Asian - Speak only English Native:
30.6% (2,214)Foreign-born:
8.2% (1,812)
Asian - Speak another language Native:
69.4% (5,019)Foreign-born:
91.8% (20,329)
Other race - Speak only English Native:
45.1% (558)Foreign-born:
16.8% (195)
Other race - Speak another language Native:
52.2% (645)Foreign-born:
84.6% (986)
Two or more races - Speak only English Native:
79.8% (2,891)Foreign-born:
12.5% (367)
Two or more races - Speak another language Native:
20.3% (735)Foreign-born:
88.6% (2,604)
White alone - Speak only English Native:
94.3% (41,358)Foreign-born:
26.5% (1,932)
White alone - Speak another language Native:
5.7% (2,497)Foreign-born:
73.5% (5,358)
Hispanic or Latino - Speak only English Native:
48.9% (1,445)Foreign-born:
6.8% (239)
Hispanic or Latino - Speak another language Native:
51.1% (1,511)Foreign-born:
93.2% (3,282)
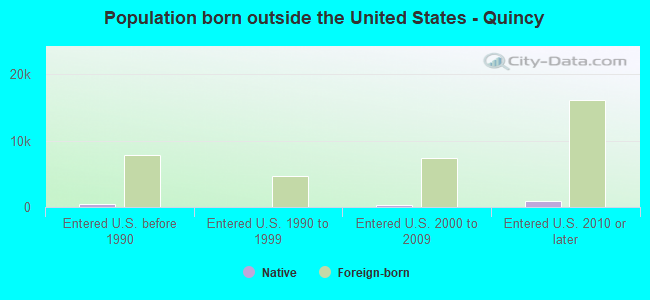
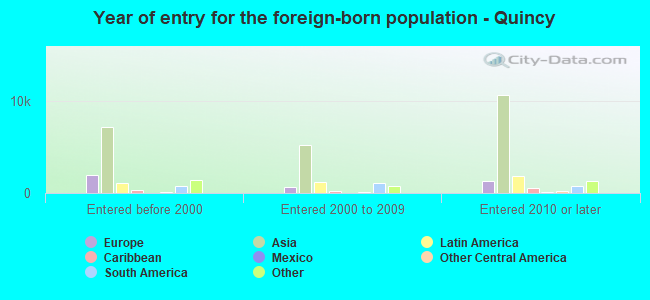
Foreign-born residents in Quincy 34,229 residents are foreign born (21.8% Asia , 4.6% Europe , 3.4% Latin America ).
This city:
33.7%Massachusetts:
17.6%
Marital status for residents in Quincy Marital status - White (Caucasian) population 15 years and over
Males 45.6% Never married44.9% Now married0.9% Separated3.6% Widowed5.0% DivorcedFemales 32.5% Never married42.4% Now married0.4% Separated12.2% Widowed12.5% DivorcedWomen who gave birth in the past 12 months Now married:
100.0% (241)Unmarried:
0.0% (0)
Women who did not give birth in the past 12 months Now married:
40.4% (4,263)Unmarried:
59.6% (6,302)
Marital status - Black or African American population 15 years and over
Males 59.8% Never married22.2% Now married9.5% Separated2.8% Widowed5.7% DivorcedFemales 55.9% Never married24.3% Now married3.5% Separated2.9% Widowed13.3% DivorcedWomen who gave birth in the past 12 months Now married:
28.7% (36)Unmarried:
71.3% (89)
Women who did not give birth in the past 12 months Now married:
29.8% (553)Unmarried:
70.2% (1,302)
Marital status - American Indian / Alaska Native population 15 years and over
Males 0.0% Never married0.0% Now married0.0% Separated0.0% Widowed100.0% DivorcedFemales 46.2% Never married27.7% Now married0.0% Separated6.2% Widowed20.0% DivorcedWomen who did not give birth in the past 12 months Now married:
47.4% (21)Unmarried:
52.6% (24)
Marital status - Asian population 15 years and over
Males 30.2% Never married60.5% Now married2.3% Separated0.2% Widowed6.8% DivorcedFemales 31.6% Never married51.9% Now married3.1% Separated7.7% Widowed5.7% DivorcedWomen who gave birth in the past 12 months Now married:
100.0% (130)Unmarried:
0.0% (0)
Women who did not give birth in the past 12 months Now married:
52.6% (4,263)Unmarried:
47.4% (3,848)
Marital status - Other race population 15 years and over
Males 45.1% Never married31.5% Now married0.4% Separated0.8% Widowed22.2% DivorcedFemales 69.3% Never married24.6% Now married1.7% Separated0.0% Widowed4.4% DivorcedWomen who gave birth in the past 12 months Now married:
74.5% (55)Unmarried:
25.5% (19)
Women who did not give birth in the past 12 months Now married:
15.9% (133)Unmarried:
84.1% (703)
Marital status - Two or more races population 15 years and over
Males 48.4% Never married36.2% Now married3.3% Separated0.9% Widowed11.1% DivorcedFemales 44.4% Never married42.0% Now married4.0% Separated3.1% Widowed6.5% DivorcedWomen who gave birth in the past 12 months Now married:
100.0% (112)Unmarried:
0.0% (0)
Women who did not give birth in the past 12 months Now married:
39.1% (694)Unmarried:
60.9% (1,080)
Marital status - White alone, not Hispanic / Latino population 15 years and over
Males 45.8% Never married44.6% Now married0.9% Separated3.6% Widowed5.0% DivorcedFemales 32.1% Never married42.6% Now married0.4% Separated12.3% Widowed12.6% DivorcedWomen who gave birth in the past 12 months Now married:
100.0% (241)Unmarried:
0.0% (0)
Women who did not give birth in the past 12 months Now married:
40.9% (4,242)Unmarried:
59.1% (6,138)
Marital status - Hispanic or Latino population 15 years and over
Males 40.8% Never married43.3% Now married4.2% Separated0.4% Widowed11.3% DivorcedFemales 47.7% Never married38.3% Now married2.7% Separated2.7% Widowed8.7% DivorcedWomen who gave birth in the past 12 months Now married:
90.9% (132)Unmarried:
9.1% (13)
Women who did not give birth in the past 12 months Now married:
30.3% (501)Unmarried:
69.7% (1,153)
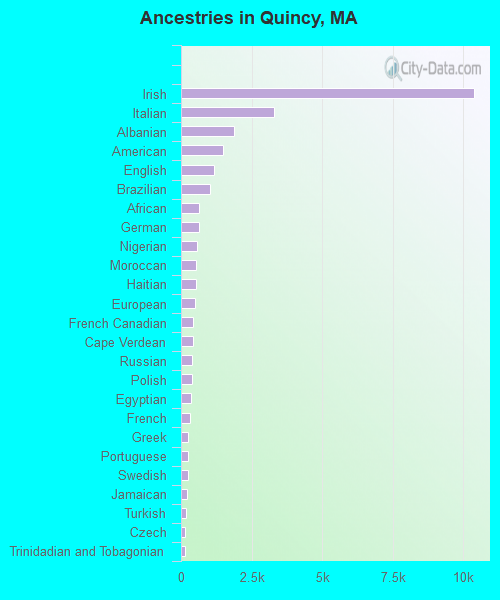
Ancestries in Quincy
10,401 18.4% Irish3,284 5.8% Italian1,892 3.3% Albanian1,505 2.7% American1,183 2.1% English1,041 1.8% Brazilian651 1.1% African627 1.1% German580 1.0% Nigerian538 1.0% Moroccan534 0.9% Haitian506 0.9% European413 0.7% French Canadian411 0.7% Cape Verdean383 0.7% Russian374 0.7% Polish362 0.6% Egyptian317 0.6% French251 0.4% Greek234 0.4% Portuguese233 0.4% Swedish201 0.4% Jamaican180 0.3% Turkish150 0.3% Czech141 0.2% Trinidadian and Tobagonian134 0.2% Kenyan118 0.2% Lebanese116 0.2% West Indian115 0.2% Macedonian113 0.2% Iranian112 0.2% Norwegian99 0.2% Lithuanian92 0.2% Finnish89 0.2% Eastern European88 0.2% Scottish83 0.1% Canadian81 0.1% Armenian73 0.1% Ethiopian67 0.1% Scotch-Irish57 0.1% British51 0.09% Dutch51 0.09% Ugandan49 0.09% Arab45 0.08% Ukrainian40 0.07% Bulgarian40 0.07% Guyanese39 0.07% Ghanaian37 0.07% Romanian36 0.06% Austrian30 0.05% Danish30 0.05% Hungarian29 0.05% Latvian28 0.05% Serbian26 0.05% Swiss25 0.04% British West Indian25 0.04% Barbadian19 0.03% Northern European18 0.03% Palestinian16 0.03% Iraqi12 0.02% Jordanian8 0.01% Sudanese5 0.01% Pennsylvania German5 0.01% Croatian5 0.01% Czechoslovakian3 0.01% Welsh
Geographical mobility in Quincy Same house 1 year ago 43,699 83.3% White (Caucasian)5,044 78.0% Black or African American121 75.9% American Indian / Alaska Native26,744 89.4% Asian68 100.0% Native Hawaiian / Pacific Islander1,315 65.7% Other race5,733 82.5% Two or more races43,416 83.2% White alone, not Hispanic / Latino4,801 82.9% Hispanic or LatinoMoved within same county 2,438 4.6% White / Caucasian630 9.7% Black or African American27 17.3% American Indian / Alaska Native503 1.7% Asian312 15.6% Other race264 3.8% Two or more races2,438 4.7% White alone, not Hispanic / Latino215 3.7% Hispanic or LatinoMoved within same state 3,044 5.8% White / Caucasian323 5.0% Black or African American445 1.5% Asian244 12.2% Other race623 9.0% Two or more races3,023 5.8% White alone, not Hispanic / Latino340 5.9% Hispanic or LatinoMoved from different state 2,858 5.4% White / Caucasian523 8.1% Black or African American1,661 5.6% Asian141 7.0% Other race145 2.1% Two or more races2,858 5.5% White alone, not Hispanic / Latino163 2.8% Hispanic or LatinoMoved from abroad 445 0.8% White20 0.3% Black or African American570 1.9% Asian95 1.4% Two or more races445 0.9% White alone, not Hispanic / Latino238 4.1% Hispanic or Latino
Children Nativity (place of birth) in Quincy
Children under 6 years - Living with two parents Both parents native 1,848 100.0% NativeBoth parents foreign-born 1,031 76.9% Native309 23.1% Foreign-bornOne native, one foreign-born parent 918 100.0% NativeChildren under 6 years - Living with one parent Native parent 519 100.0% NativeForeign-born parent 390 100.0% NativeChildren 6 to 17 years - Living with two parents Both parents native 2,698 100.0% NativeBoth parents foreign-born 2,806 74.6% Native953 25.4% Foreign-bornOne native, one foreign-born parent 1,010 100.0% NativeChildren 6 to 17 years - Living with one parent Native parent 563 100.0% NativeForeign-born parent 1,065 50.0% Native1,065 50.0% Foreign-born
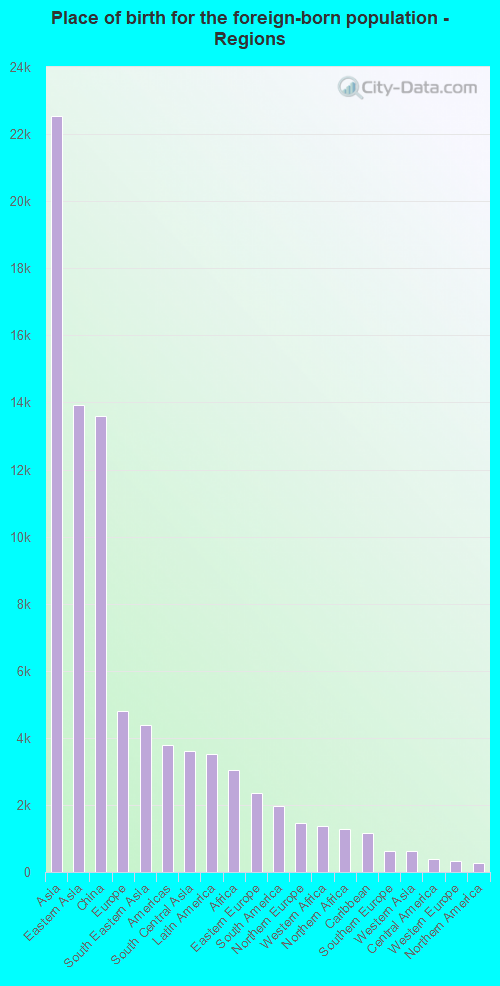
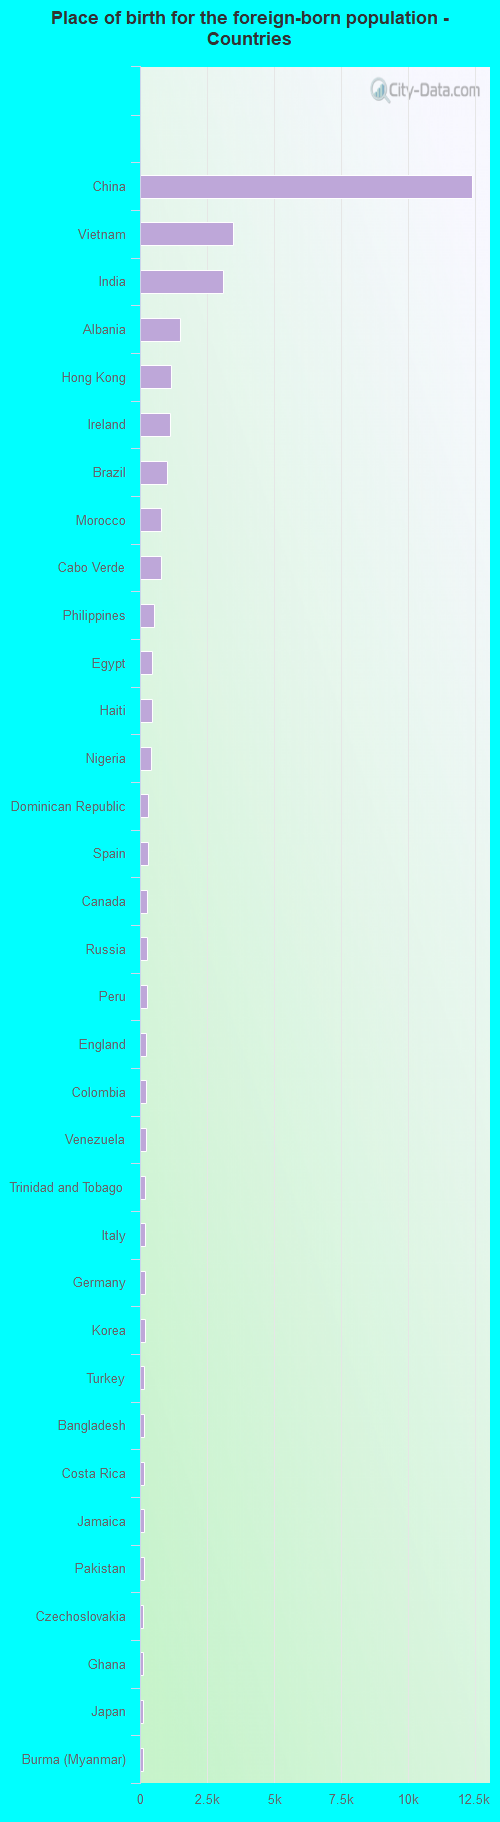
Place of birth for residents in Quincy 22,537 Asia13,932 Eastern Asia13,604 China4,802 Europe4,391 South Eastern Asia3,788 Americas3,597 South Central Asia3,519 Latin America3,051 Africa2,369 Eastern Europe1,974 South America1,462 Northern Europe1,375 Western Africa1,269 Northern Africa1,170 Caribbean637 Southern Europe616 Western Asia374 Central America333 Western Europe268 Northern America123 Eastern Africa91 Southern Africa49 Oceania41 Middle Africa12,399 China3,455 Vietnam3,102 India1,478 Albania1,141 Hong Kong1,118 Ireland1,014 Brazil800 Morocco797 Cabo Verde531 Philippines442 Egypt441 Haiti426 Nigeria299 Dominican Republic281 Spain268 Canada264 Russia250 Peru230 England228 Colombia219 Venezuela181 Trinidad and Tobago180 Italy171 Germany168 Korea164 Turkey162 Bangladesh156 Costa Rica155 Jamaica139 Pakistan129 Czechoslovakia124 Ghana121 Japan121 Burma (Myanmar)112 Iraq112 Ecuador111 Nepal110 Poland109 Greece109 Kuwait108 Thailand93 Chile91 Lebanon91 South Africa85 Mexico80 France73 United Kingdom72 Iran70 Switzerland67 Guatemala66 Indonesia66 Kenya65 Portugal64 Taiwan64 Ukraine56 Cuba54 Jordan49 Malaysia44 Ethiopia41 Honduras34 Argentina32 Azerbaijan30 Romania29 Moldova28 Cambodia28 Bosnia and Herzegovina27 Senegal25 Scotland25 Latvia23 El Salvador23 Barbados23 Singapore21 Serbia20 Bulgaria17 Armenia15 Sudan15 Israel13 Sweden12 Dominica12 Uganda12 Uruguay11 Algeria10 North Macedonia (Macedonia)9 Lithuania8 Uzbekistan6 Laos
Grandparents responsible for own grandchildren in Quincy
Grandparents (30 to 59 years) White / Caucasian 61 42.4% Responsible for grandchildren83 57.6% Not responsible for grandchildrenAsian 66 14.7% Responsible for grandchildren381 85.3% Not responsible for grandchildrenTwo or more races 80 51.3% Responsible for grandchildren76 48.7% Not responsible for grandchildrenWhite alone, not Hispanic / Latino 69 42.8% Responsible for grandchildren92 57.2% Not responsible for grandchildrenHispanic or Latino 60 45.9% Responsible for grandchildren71 54.1% Not responsible for grandchildrenGrandparents (60 years and over) White / Caucasian 73 15.6% Responsible for grandchildren394 84.4% Not responsible for grandchildrenAsian 132 12.8% Responsible for grandchildren899 87.2% Not responsible for grandchildrenTwo or more races 16 100.0% Not responsible for grandchildrenWhite alone, not Hispanic / Latino 73 15.6% Responsible for grandchildren395 84.4% Not responsible for grandchildrenHispanic or Latino 25 69.7% Responsible for grandchildren11 30.3% Not responsible for grandchildren