Races in Reading, Pennsylvania (PA) Detailed Stats
Data:
Races - White alone (%)
Races - White alone (% change since 2000)
Races - Black alone (%)
Races - Black alone (% change since 2000)
Races - American Indian alone (%)
Races - American Indian alone (% change since 2000)
Races - Asian alone (%)
Races - Asian alone (% change since 2000)
Races - Hispanic (%)
Races - Hispanic (% change since 2000)
Races - Native Hawaiian and Other Pacific Islander alone (%)
Races - Native Hawaiian and Other Pacific Islander alone (% change since 2000)
Races - Two or more races(%)
Races - Two or more races(% change since 2000)
Races - Other race alone (%)
Races - Other race alone (% change since 2000)
Racial diversity
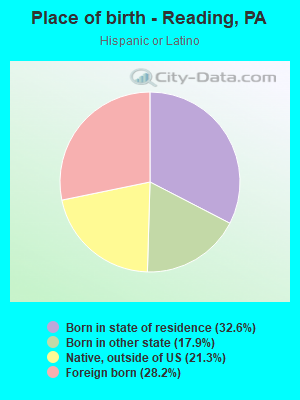
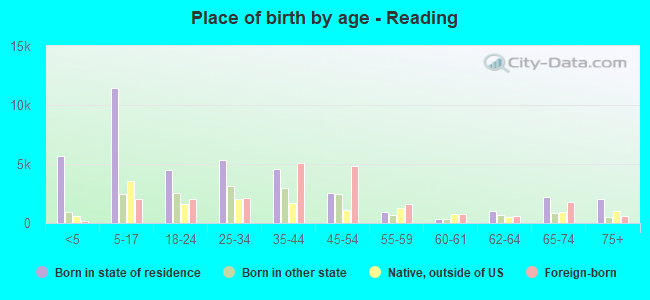
Place of birth - Born in state of residence (%)
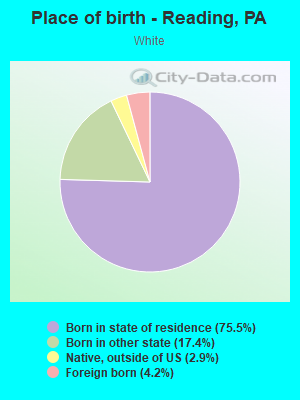
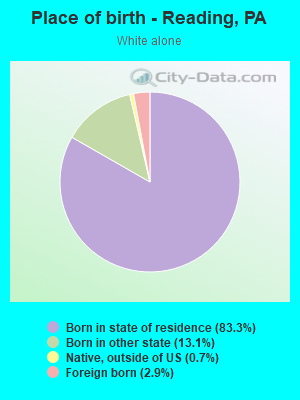
Place of birth - Born in state of residence (%) - White
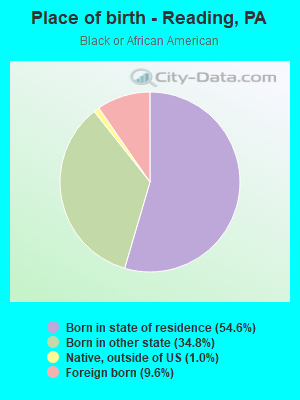
Place of birth - Born in state of residence (%) - Black or African American
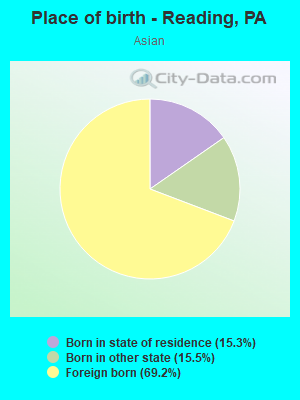
Place of birth - Born in state of residence (%) - Asian
Place of birth - Born in state of residence (%) - Hispanic or Latino
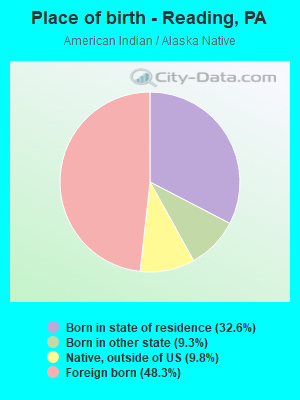
Place of birth - Born in state of residence (%) - American Indian and Alaska Native
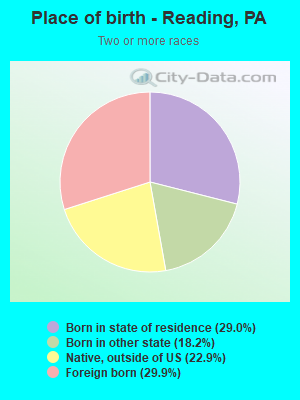
Place of birth - Born in state of residence (%) - Multirace
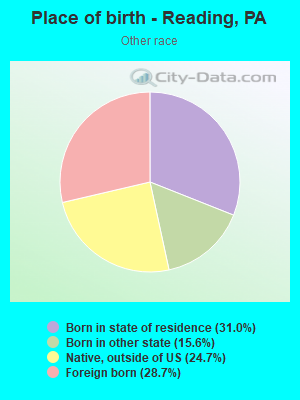
Place of birth - Born in state of residence (%) - Other Race
Place of birth - Born in other state (%)
Place of birth - Born in other state (%) - White
Place of birth - Born in other state (%) - Black or African American
Place of birth - Born in other state (%) - Asian
Place of birth - Born in other state (%) - Hispanic or Latino
Place of birth - Born in other state (%) - American Indian and Alaska Native
Place of birth - Born in other state (%) - Multirace
Place of birth - Born in other state (%) - Other Race
Place of birth - Native, outside of US (%)
Place of birth - Native, outside of US (%) - White
Place of birth - Native, outside of US (%) - Black or African American
Place of birth - Native, outside of US (%) - Asian
Place of birth - Native, outside of US (%) - Hispanic or Latino
Place of birth - Native, outside of US (%) - American Indian and Alaska Native
Place of birth - Native, outside of US (%) - Multirace
Place of birth - Native, outside of US (%) - Other Race
Place of birth - Foreign born (%)
Place of birth - Foreign born (%) - White
Place of birth - Foreign born (%) - Black or African American
Place of birth - Foreign born (%) - Asian
Place of birth - Foreign born (%) - Hispanic or Latino
Place of birth - Foreign born (%) - American Indian and Alaska Native
Place of birth - Foreign born (%) - Multirace
Place of birth - Foreign born (%) - Other Race
Residents speaking English at home (%)
Residents speaking English at home - Born in the United States (%)
Residents speaking English at home - Native, born elsewhere (%)
Residents speaking English at home - Foreign born (%)
Residents speaking Spanish at home (%)
Residents speaking Spanish at home - Born in the United States (%)
Residents speaking Spanish at home - Native, born elsewhere (%)
Residents speaking Spanish at home - Foreign born (%)
Residents speaking other language at home (%)
Residents speaking other language at home - Born in the United States (%)
Residents speaking other language at home - Native, born elsewhere (%)
Residents speaking other language at home - Foreign born (%)
Marital status - Never married (%)
Marital status - Now married (%)
Marital status - Separated (%)
Marital status - Widowed (%)
Marital status - Divorced (%)
Ancestries Reported - Arab (%)
Ancestries Reported - Czech (%)
Ancestries Reported - Danish (%)
Ancestries Reported - Dutch (%)
Ancestries Reported - English (%)
Ancestries Reported - French (%)
Ancestries Reported - French Canadian (%)
Ancestries Reported - German (%)
Ancestries Reported - Greek (%)
Ancestries Reported - Hungarian (%)
Ancestries Reported - Irish (%)
Ancestries Reported - Italian (%)
Ancestries Reported - Lithuanian (%)
Ancestries Reported - Norwegian (%)
Ancestries Reported - Polish (%)
Ancestries Reported - Portuguese (%)
Ancestries Reported - Russian (%)
Ancestries Reported - Scotch-Irish (%)
Ancestries Reported - Scottish (%)
Ancestries Reported - Slovak (%)
Ancestries Reported - Subsaharan African (%)
Ancestries Reported - Swedish (%)
Ancestries Reported - Swiss (%)
Ancestries Reported - Ukrainian (%)
Ancestries Reported - United States (%)
Ancestries Reported - Welsh (%)
Ancestries Reported - West Indian (%)
Ancestries Reported - Other (%)
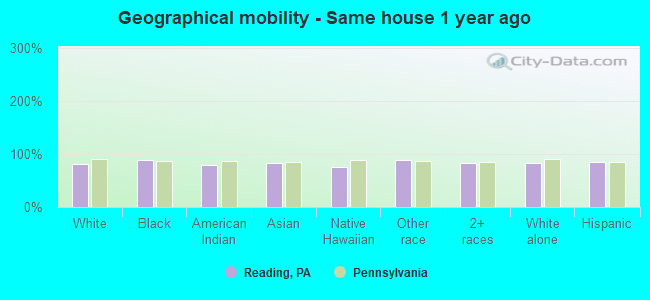
Geographical mobility - Same house 1 year ago (%)
Geographical mobility - Same house 1 year ago (%) - White
Geographical mobility - Same house 1 year ago (%) - Black or African American
Geographical mobility - Same house 1 year ago (%) - Asian
Geographical mobility - Same house 1 year ago (%) - Hispanic or Latino
Geographical mobility - Same house 1 year ago (%) - American Indian and Alaska Native
Geographical mobility - Same house 1 year ago (%) - Multirace
Geographical mobility - Same house 1 year ago (%) - Other Race
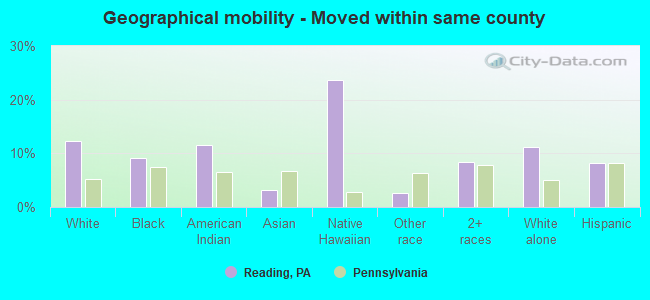
Geographical mobility - Moved within same county (%)
Geographical mobility - Moved within same county (%) - White
Geographical mobility - Moved within same county (%) - Black or African American
Geographical mobility - Moved within same county (%) - Asian
Geographical mobility - Moved within same county (%) - Hispanic or Latino
Geographical mobility - Moved within same county (%) - American Indian and Alaska Native
Geographical mobility - Moved within same county (%) - Multirace
Geographical mobility - Moved within same county (%) - Other Race
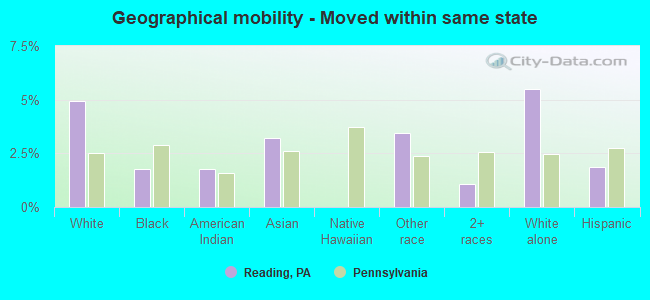
Geographical mobility - Moved from different county within same state (%)
Geographical mobility - Moved from different county within same state (%) - White
Geographical mobility - Moved from different county within same state (%) - Black or African American
Geographical mobility - Moved from different county within same state (%) - Asian
Geographical mobility - Moved from different county within same state (%) - Hispanic or Latino
Geographical mobility - Moved from different county within same state (%) - American Indian and Alaska Native
Geographical mobility - Moved from different county within same state (%) - Multirace
Geographical mobility - Moved from different county within same state (%) - Other Race
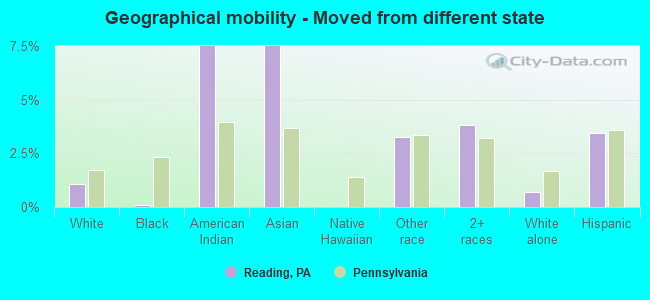
Geographical mobility - Moved from different state (%)
Geographical mobility - Moved from different state (%) - White
Geographical mobility - Moved from different state (%) - Black or African American
Geographical mobility - Moved from different state (%) - Asian
Geographical mobility - Moved from different state (%) - Hispanic or Latino
Geographical mobility - Moved from different state (%) - American Indian and Alaska Native
Geographical mobility - Moved from different state (%) - Multirace
Geographical mobility - Moved from different state (%) - Other Race
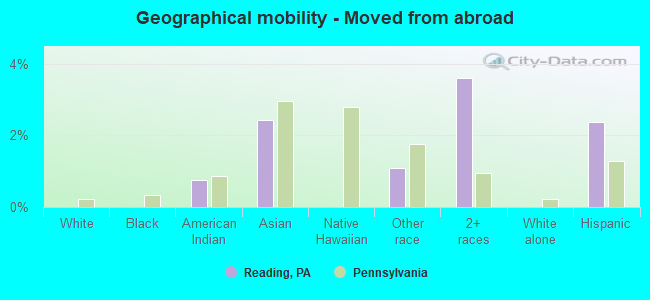
Geographical mobility - Moved from abroad (%)
Geographical mobility - Moved from abroad (%) - White
Geographical mobility - Moved from abroad (%) - Black or African American
Geographical mobility - Moved from abroad (%) - Asian
Geographical mobility - Moved from abroad (%) - Hispanic or Latino
Geographical mobility - Moved from abroad (%) - American Indian and Alaska Native
Geographical mobility - Moved from abroad (%) - Multirace
Geographical mobility - Moved from abroad (%) - Other Race
Place of birth for the foreign-born population - Ireland (%)
Place of birth for the foreign-born population - Denmark (%)
Place of birth for the foreign-born population - Norway (%)
Place of birth for the foreign-born population - Sweden (%)
Place of birth for the foreign-born population - United Kingdom (%)
Place of birth for the foreign-born population - England (%)
Place of birth for the foreign-born population - Scotland (%)
Place of birth for the foreign-born population - Other Northern Europe (%)
Place of birth for the foreign-born population - Austria (%)
Place of birth for the foreign-born population - Belgium (%)
Place of birth for the foreign-born population - France (%)
Place of birth for the foreign-born population - Germany (%)
Place of birth for the foreign-born population - Netherlands (%)
Place of birth for the foreign-born population - Switzerland (%)
Place of birth for the foreign-born population - Other Western Europe (%)
Place of birth for the foreign-born population - Greece (%)
Place of birth for the foreign-born population - Italy (%)
Place of birth for the foreign-born population - Portugal (%)
Place of birth for the foreign-born population - Spain (%)
Place of birth for the foreign-born population - Other Southern Europe (%)
Place of birth for the foreign-born population - Albania (%)
Place of birth for the foreign-born population - Belarus (%)
Place of birth for the foreign-born population - Bosnia and Herzegovina (%)
Place of birth for the foreign-born population - Bulgaria (%)
Place of birth for the foreign-born population - Croatia (%)
Place of birth for the foreign-born population - Czechoslovakia (%)
Place of birth for the foreign-born population - Hungary (%)
Place of birth for the foreign-born population - Latvia (%)
Place of birth for the foreign-born population - Lithuania (%)
Place of birth for the foreign-born population - North Macedonia (Macedonia) (%)
Place of birth for the foreign-born population - Moldova (%)
Place of birth for the foreign-born population - Poland (%)
Place of birth for the foreign-born population - Romania (%)
Place of birth for the foreign-born population - Russia (%)
Place of birth for the foreign-born population - Serbia (%)
Place of birth for the foreign-born population - Ukraine (%)
Place of birth for the foreign-born population - Other Eastern Europe (%)
Place of birth for the foreign-born population - China (%)
Place of birth for the foreign-born population - Hong Kong (%)
Place of birth for the foreign-born population - Taiwan (%)
Place of birth for the foreign-born population - Japan (%)
Place of birth for the foreign-born population - Korea (%)
Place of birth for the foreign-born population - Other Eastern Asia (%)
Place of birth for the foreign-born population - Afghanistan (%)
Place of birth for the foreign-born population - Bangladesh (%)
Place of birth for the foreign-born population - India (%)
Place of birth for the foreign-born population - Iran (%)
Place of birth for the foreign-born population - Kazakhstan (%)
Place of birth for the foreign-born population - Nepal (%)
Place of birth for the foreign-born population - Pakistan (%)
Place of birth for the foreign-born population - Sri Lanka (%)
Place of birth for the foreign-born population - Uzbekistan (%)
Place of birth for the foreign-born population - Other South Central Asia (%)
Place of birth for the foreign-born population - Burma (%)
Place of birth for the foreign-born population - Cambodia (%)
Place of birth for the foreign-born population - Indonesia (%)
Place of birth for the foreign-born population - Laos (%)
Place of birth for the foreign-born population - Malaysia (%)
Place of birth for the foreign-born population - Philippines (%)
Place of birth for the foreign-born population - Singapore (%)
Place of birth for the foreign-born population - Thailand (%)
Place of birth for the foreign-born population - Vietnam (%)
Place of birth for the foreign-born population - Other South Eastern Asia (%)
Place of birth for the foreign-born population - Armenia (%)
Place of birth for the foreign-born population - Iraq (%)
Place of birth for the foreign-born population - Israel (%)
Place of birth for the foreign-born population - Jordan (%)
Place of birth for the foreign-born population - Kuwait (%)
Place of birth for the foreign-born population - Lebanon (%)
Place of birth for the foreign-born population - Saudi Arabia (%)
Place of birth for the foreign-born population - Syria (%)
Place of birth for the foreign-born population - Turkey (%)
Place of birth for the foreign-born population - Yemen (%)
Place of birth for the foreign-born population - Other Western Asia (%)
Place of birth for the foreign-born population - Eritrea (%)
Place of birth for the foreign-born population - Ethiopia (%)
Place of birth for the foreign-born population - Kenya (%)
Place of birth for the foreign-born population - Somalia (%)
Place of birth for the foreign-born population - Uganda (%)
Place of birth for the foreign-born population - Zimbabwe (%)
Place of birth for the foreign-born population - Other Eastern Africa (%)
Place of birth for the foreign-born population - Cameroon (%)
Place of birth for the foreign-born population - Congo (%)
Place of birth for the foreign-born population - Democratic Republic of Congo (Zaire) (%)
Place of birth for the foreign-born population - Other Middle Africa (%)
Place of birth for the foreign-born population - Egypt (%)
Place of birth for the foreign-born population - Morocco (%)
Place of birth for the foreign-born population - Sudan (%)
Place of birth for the foreign-born population - Other Northern Africa (%)
Place of birth for the foreign-born population - South Africa (%)
Place of birth for the foreign-born population - Other Southern Africa (%)
Place of birth for the foreign-born population - Cabo Verde (%)
Place of birth for the foreign-born population - Ghana (%)
Place of birth for the foreign-born population - Liberia (%)
Place of birth for the foreign-born population - Nigeria (%)
Place of birth for the foreign-born population - Senegal (%)
Place of birth for the foreign-born population - Sierra Leone (%)
Place of birth for the foreign-born population - Other Western Africa (%)
Place of birth for the foreign-born population - Australia (%)
Place of birth for the foreign-born population - New Zealand (%)
Place of birth for the foreign-born population - Fiji (%)
Place of birth for the foreign-born population - Micronesia (%)
Place of birth for the foreign-born population - Bahamas (%)
Place of birth for the foreign-born population - Barbados (%)
Place of birth for the foreign-born population - Cuba (%)
Place of birth for the foreign-born population - Dominica (%)
Place of birth for the foreign-born population - Dominican Republic (%)
Place of birth for the foreign-born population - Grenada (%)
Place of birth for the foreign-born population - Haiti (%)
Place of birth for the foreign-born population - Jamaica (%)
Place of birth for the foreign-born population - St. Vincent and the Grenadines (%)
Place of birth for the foreign-born population - Trinidad and Tobago (%)
Place of birth for the foreign-born population - West Indies (%)
Place of birth for the foreign-born population - Other Caribbean (%)
Place of birth for the foreign-born population - Belize (%)
Place of birth for the foreign-born population - Costa Rica (%)
Place of birth for the foreign-born population - El Salvador (%)
Place of birth for the foreign-born population - Guatemala (%)
Place of birth for the foreign-born population - Honduras (%)
Place of birth for the foreign-born population - Mexico (%)
Place of birth for the foreign-born population - Nicaragua (%)
Place of birth for the foreign-born population - Panama (%)
Place of birth for the foreign-born population - Other Central America (%)
Place of birth for the foreign-born population - Argentina (%)
Place of birth for the foreign-born population - Bolivia (%)
Place of birth for the foreign-born population - Brazil (%)
Place of birth for the foreign-born population - Chile (%)
Place of birth for the foreign-born population - Colombia (%)
Place of birth for the foreign-born population - Ecuador (%)
Place of birth for the foreign-born population - Guyana (%)
Place of birth for the foreign-born population - Peru (%)
Place of birth for the foreign-born population - Uruguay (%)
Place of birth for the foreign-born population - Venezuela (%)
Place of birth for the foreign-born population - Other South America (%)
Place of birth for the foreign-born population - Canada (%)
Place of birth for the foreign-born population - Other Northern America (%)
Place of birth for the foreign-born population - Other (%)
Latest news about races in Reading, PA collected exclusively by city-data.com from local newspapers, TV, and radio stations
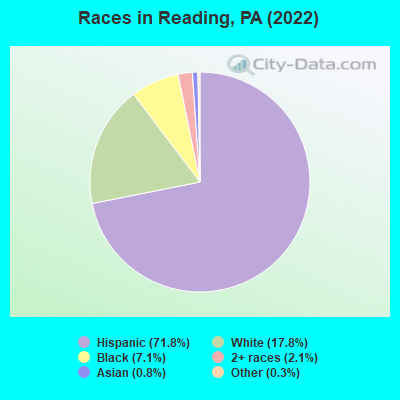
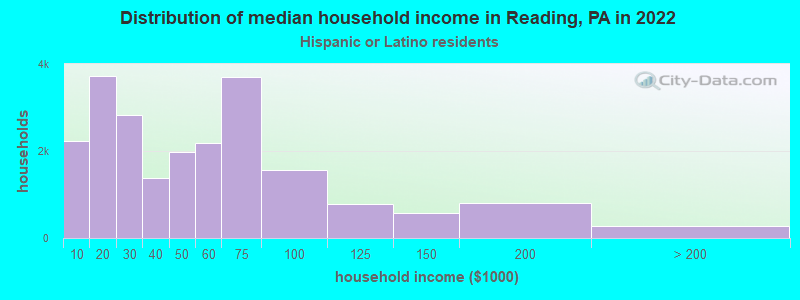
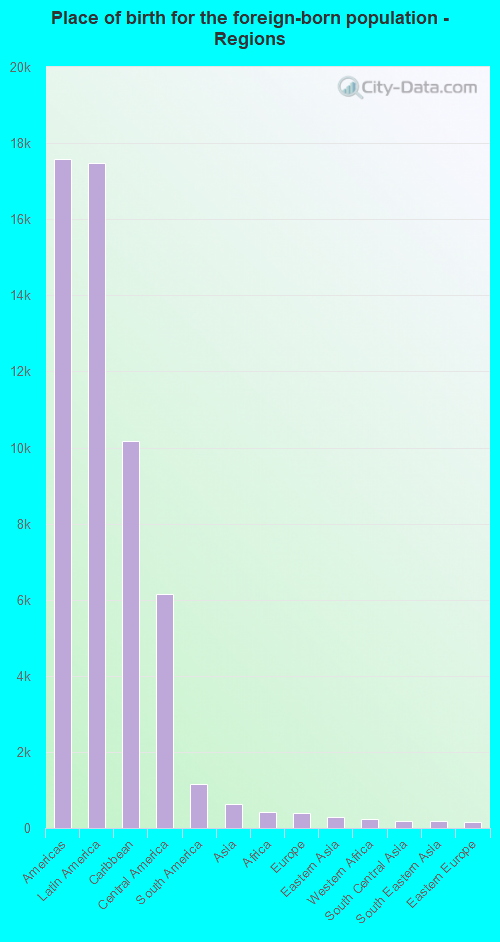
According to 2022 data, the most numerous races in Reading, PA are White alone (16,905 residents), Black alone (6,769 residents), and Hispanic (68,100 residents). 37.7% of Reading residents speak English at home. 20.0% of Reading, PA residents are foreign-born (17.8% born in Latin America), which is 65.1% greater than the foreign-born rate of 7.0% across the entire state of Pennsylvania.
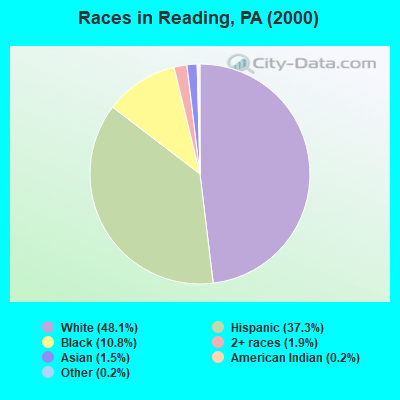
Race distribution in Reading
2000 2022
10,322,455 84.1% White alone 1,202,437 9.8% Black alone 394,088 3.2% Hispanic 218,296 1.8% Asian alone 113,097 0.9% Two or more races 13,086 0.1% Other race alone 14,904 0.1% American Indian alone 2,691 0.02% Native Hawaiian and Other
9,487,228 73.1% White alone 1,311,581 10.1% Black alone 1,115,997 8.6% Hispanic 493,942 3.8% Two or more races 487,124 3.8% Asian alone 63,582 0.5% Other race alone 10,130 0.08% American Indian alone 2,424 0.02% Native Hawaiian and Other
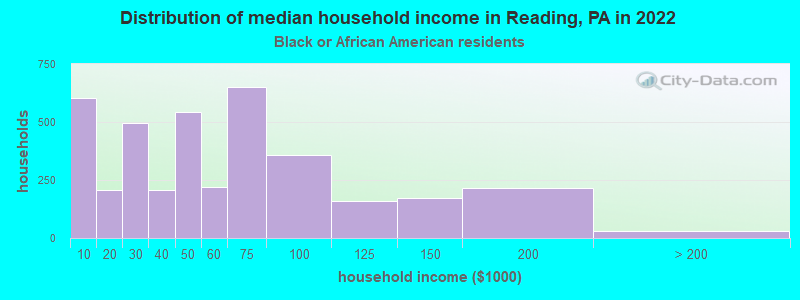
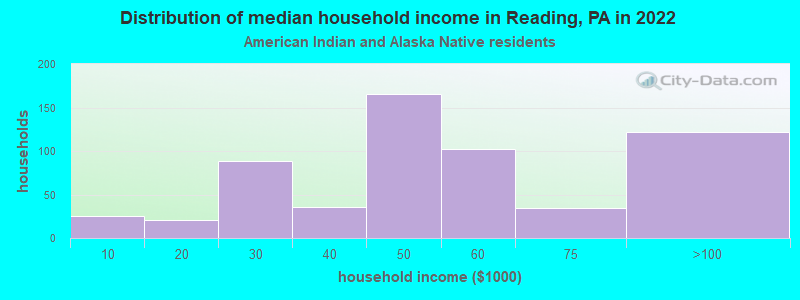
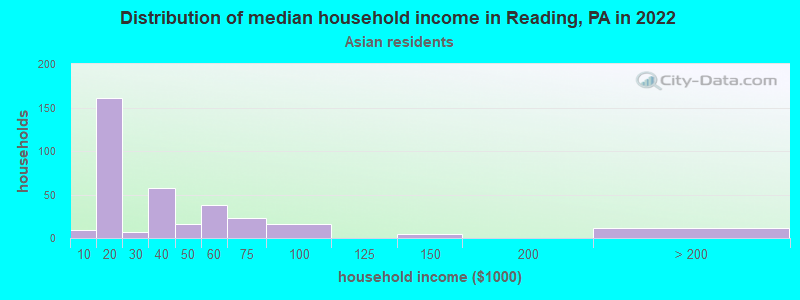
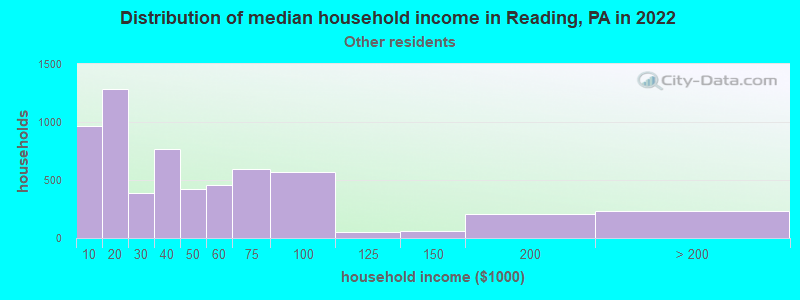
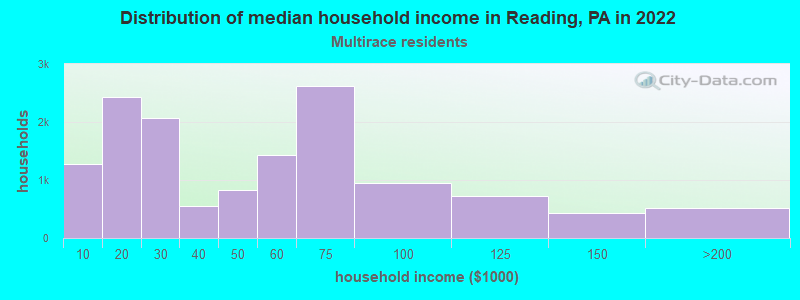
Income and house value in Reading Median household income in 2022 $46,371 White non-Hispanic householders$44,047 Black householders$44,781 American Indian and Alaska Native householders$36,527 Some other race householders$44,436 Two or more races householders$43,690 Hispanic or Latino race householdersMedian 2022 house value $112,397 White Non-Hispanic householders$109,413 Black or African American householders$117,122 American Indian or Alaska Native householders $120,603 Asian householders$31,083 Native Hawaiian and other Pacific Islander householders$101,953 Some other race householders$106,429 Two or more races householders$102,450 Hispanic or Latino householders
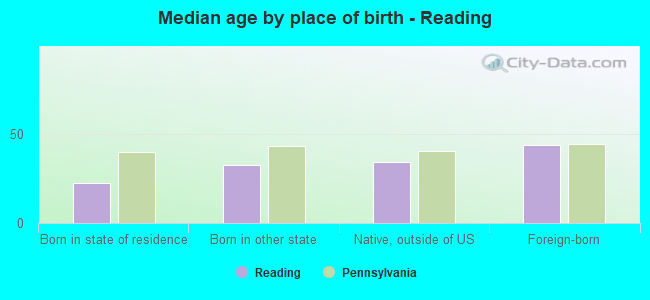
Median age by race in Reading
37.1 Median age for White residents33.1 38.0 40.3 Median age for Black or African American residents41.2 36.7 21.9 Median age for American Indian / Alaska Native residents42.0 18.5 36.8 Median age for Asian residents39.7 36.2 -666,666,666.0 Median age for Native Hawaiian / Pacific Islander residents-666,666,666.0 -666,666,666.0 30.4 Median age for Other race residents29.3 31.3 29.5 Median age for Two or more races residents30.8 28.4 44.0 Median age for White alone residents49.5 40.5 28.5 Median age for Hispanic or Latino residents29.3 28.1
Owner/renter occupied households by race in Reading
House owners and renters - White residents 4,321 53.6% Owner occupied3,735 46.4% Renter occupiedHouse owners and renters - Black or African American residents 1,553 45.2% Owner occupied1,884 54.8% Renter occupiedHouse owners and renters - American Indian / Alaska Native residents 618 54.3% Owner occupied520 45.7% Renter occupiedHouse owners and renters - Asian residents 226 58.2% Owner occupied162 41.8% Renter occupiedHouse owners and renters - Native Hawaiian / Pacific Islander residents 2 100.0% Renter occupiedHouse owners and renters - Other race residents 2,253 37.5% Owner occupied3,755 62.5% Renter occupiedHouse owners and renters - Two or more races residents 4,218 30.6% Owner occupied9,573 69.4% Renter occupiedHouse owners and renters - White alone residents 3,977 57.1% Owner occupied2,982 42.9% Renter occupiedHouse owners and renters - Hispanic or Latino residents 7,323 33.3% Owner occupied14,699 66.7% Renter occupied
Language usage in Reading
English speakers - Total 37.7% of residents of Reading speak English at home.
59.7% of residents speak Spanish at home 25,497 48.8% Speak English very well26,798 51.2% Speak English less than very well2.7% of residents speak other language at home 1,594 67.6% Speak English very well765 32.4% Speak English less than very well
English speakers - Born in the United States 38.2% of residents of Reading speak English at home.
59.6% of residents speak Spanish at home 7,518 75.9% Speak English very well2,389 24.1% Speak English less than very well2.2% of residents speak other language at home 363 100.0% Speak English very well
English speakers - Native, born elsewhere 8.4% of residents of Reading speak English at home.
91.3% of residents speak Spanish at home 5,089 38.4% Speak English very well8,156 61.6% Speak English less than very well0.3% of residents speak other language at home 46 100.0% Speak English very well
English speakers - Foreign-born 5.6% of residents of Reading speak English at home.
88.0% of residents speak Spanish at home 3,476 18.4% Speak English very well15,437 81.6% Speak English less than very well6.4% of residents speak other language at home 609 44.3% Speak English very well765 55.7% Speak English less than very well
White (Caucasian) - Speak only English Native:
81.8% (16,631)Foreign-born:
8.3% (81)
White (Caucasian) - Speak another language Native:
18.2% (3,705)Foreign-born:
91.7% (891)
Black or African American - Speak only English Native:
82.8% (6,703)Foreign-born:
30.5% (352)
Black or African American - Speak another language Native:
17.2% (1,390)Foreign-born:
66.7% (771)
American Indian / Alaska Native - Speak only English Native:
18.2% (161)Foreign-born:
0.1% (1)
American Indian / Alaska Native - Speak another language Native:
97.4% (863)Foreign-born:
100.0% (1,007)
Asian - Speak only English Native:
17.6% (77)Foreign-born:
15.0% (112)
Asian - Speak another language Native:
69.4% (304)Foreign-born:
82.1% (613)
Other race - Speak only English Native:
24.8% (2,998)Foreign-born:
1.9% (109)
Other race - Speak another language Native:
75.2% (9,094)Foreign-born:
98.1% (5,543)
Two or more races - Speak only English Native:
24.4% (6,159)Foreign-born:
5.0% (579)
Two or more races - Speak another language Native:
75.6% (19,096)Foreign-born:
95.0% (11,076)
White alone - Speak only English Native:
95.3% (17,510)Foreign-born:
46.0% (203)
White alone - Speak another language Native:
5.4% (994)Foreign-born:
50.2% (222)
Hispanic or Latino - Speak only English Native:
24.1% (10,332)Foreign-born:
1.5% (294)
Hispanic or Latino - Speak another language Native:
75.9% (32,577)Foreign-born:
98.5% (18,929)
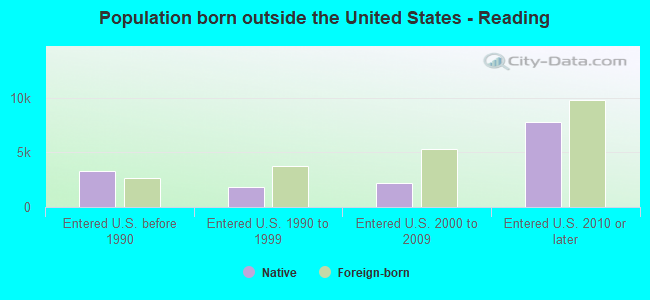
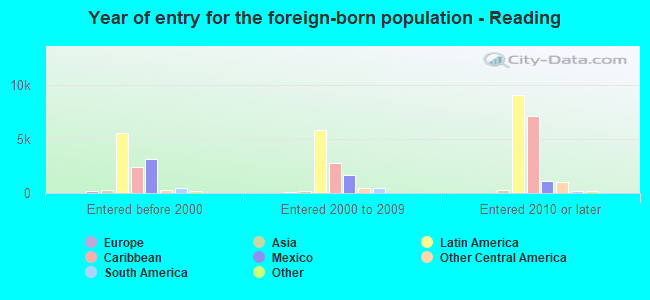
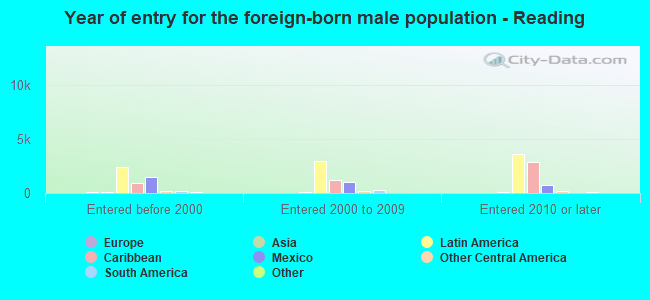
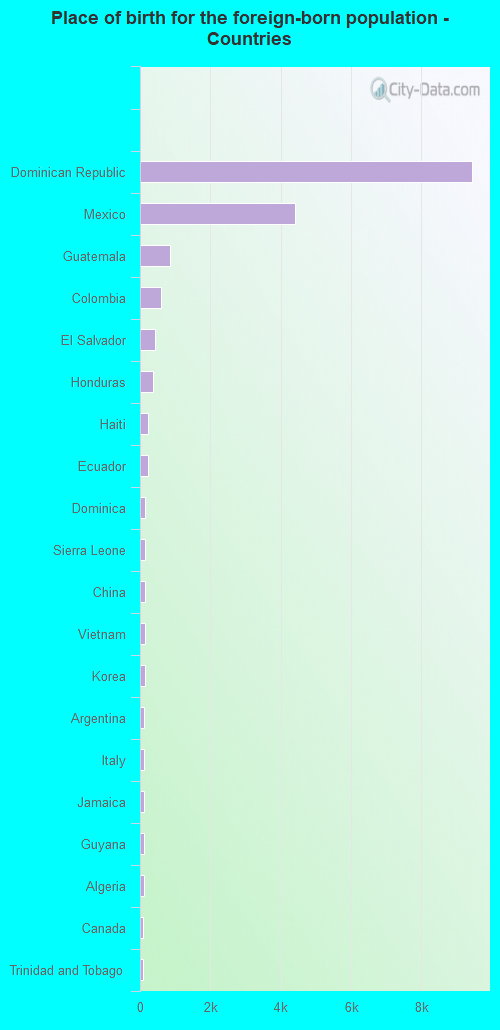
Foreign-born residents in Reading 19,037 residents are foreign born (17.8% Latin America ).
This city:
20.0%Pennsylvania:
7.3%
Marital status for residents in Reading Marital status - White (Caucasian) population 15 years and over
Males 50.6% Never married31.1% Now married1.9% Separated2.4% Widowed14.1% DivorcedFemales 50.0% Never married30.3% Now married2.0% Separated10.9% Widowed6.7% DivorcedWomen who gave birth in the past 12 months Now married:
35.7% (66)Unmarried:
64.3% (119)
Women who did not give birth in the past 12 months Now married:
25.3% (1,426)Unmarried:
74.7% (4,210)
Marital status - Black or African American population 15 years and over
Males 51.9% Never married33.3% Now married0.0% Separated0.0% Widowed14.9% DivorcedFemales 60.3% Never married12.8% Now married5.5% Separated9.0% Widowed12.4% DivorcedWomen who gave birth in the past 12 months Now married:
27.4% (86)Unmarried:
72.6% (229)
Women who did not give birth in the past 12 months Now married:
24.8% (663)Unmarried:
75.2% (2,012)
Marital status - American Indian / Alaska Native population 15 years and over
Males 46.1% Never married45.7% Now married1.6% Separated3.8% Widowed2.9% DivorcedFemales 67.7% Never married24.7% Now married0.0% Separated1.2% Widowed6.4% DivorcedWomen who gave birth in the past 12 months Now married:
0.0% (0)Unmarried:
100.0% (91)
Women who did not give birth in the past 12 months Now married:
21.8% (135)Unmarried:
78.2% (485)
Marital status - Asian population 15 years and over
Males 39.2% Never married45.4% Now married0.0% Separated1.2% Widowed14.2% DivorcedFemales 27.3% Never married38.3% Now married8.6% Separated4.4% Widowed21.4% DivorcedWomen who gave birth in the past 12 months Now married:
100.0% (76)Unmarried:
0.0% (0)
Women who did not give birth in the past 12 months Now married:
43.3% (95)Unmarried:
56.7% (125)
Marital status - Native Hawaiian / Pacific Islander population 15 years and over
Males 100.0% Never married0.0% Now married0.0% Separated0.0% Widowed0.0% DivorcedFemales 0.0% Never married0.0% Now married100.0% Separated0.0% Widowed0.0% DivorcedWomen who did not give birth in the past 12 months Now married:
100.0% (3)Unmarried:
0.0% (0)
Marital status - Other race population 15 years and over
Males 53.3% Never married22.9% Now married8.0% Separated0.9% Widowed15.0% DivorcedFemales 39.2% Never married33.0% Now married2.1% Separated6.0% Widowed19.7% DivorcedWomen who gave birth in the past 12 months Now married:
33.1% (148)Unmarried:
66.9% (298)
Women who did not give birth in the past 12 months Now married:
32.2% (1,925)Unmarried:
67.8% (4,060)
Marital status - Two or more races population 15 years and over
Males 50.7% Never married35.4% Now married5.1% Separated1.0% Widowed7.7% DivorcedFemales 50.8% Never married27.3% Now married5.2% Separated4.3% Widowed12.3% DivorcedWomen who gave birth in the past 12 months Now married:
8.1% (39)Unmarried:
91.9% (442)
Women who did not give birth in the past 12 months Now married:
31.4% (3,252)Unmarried:
68.6% (7,116)
Marital status - White alone, not Hispanic / Latino population 15 years and over
Males 50.4% Never married29.6% Now married0.4% Separated2.9% Widowed16.7% DivorcedFemales 49.9% Never married30.4% Now married2.4% Separated10.8% Widowed6.5% DivorcedWomen who gave birth in the past 12 months Now married:
35.7% (66)Unmarried:
64.3% (119)
Women who did not give birth in the past 12 months Now married:
25.2% (1,099)Unmarried:
74.8% (3,267)
Marital status - Hispanic or Latino population 15 years and over
Males 50.9% Never married32.8% Now married6.1% Separated0.9% Widowed9.3% DivorcedFemales 49.8% Never married28.8% Now married3.4% Separated5.1% Widowed12.8% DivorcedWomen who gave birth in the past 12 months Now married:
5.4% (39)Unmarried:
94.6% (678)
Women who did not give birth in the past 12 months Now married:
31.3% (5,332)Unmarried:
68.7% (11,684)
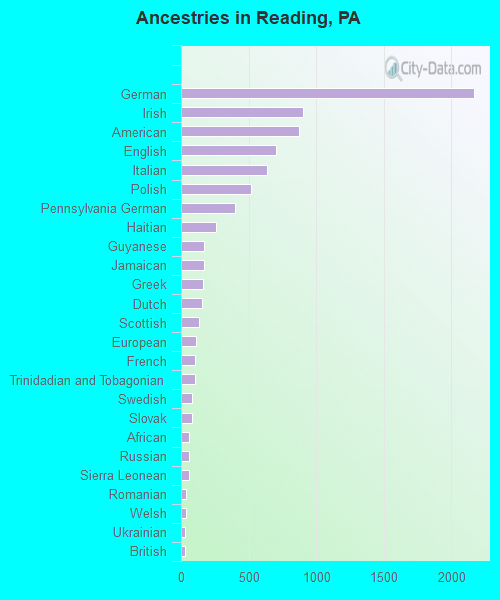
Ancestries in Reading
2,171 4.4% German901 1.8% Irish871 1.8% American702 1.4% English633 1.3% Italian516 1.0% Polish402 0.8% Pennsylvania German258 0.5% Haitian173 0.3% Guyanese170 0.3% Jamaican160 0.3% Greek154 0.3% Dutch134 0.3% Scottish108 0.2% European105 0.2% French104 0.2% Trinidadian and Tobagonian83 0.2% Swedish81 0.2% Slovak59 0.1% African57 0.1% Russian57 0.1% Sierra Leonean35 0.07% Romanian34 0.07% Welsh28 0.06% Ukrainian26 0.05% British25 0.05% Canadian20 0.04% German Russian19 0.04% French Canadian18 0.04% Swiss18 0.04% Yugoslavian17 0.03% Danish12 0.02% Slavic12 0.02% Eastern European12 0.02% Australian12 0.02% British West Indian10 0.02% Nigerian10 0.02% Brazilian10 0.02% Norwegian6 0.01% Czech5 0.01% Lithuanian5 0.01% U.S. Virgin Islander4 0.01% Israeli4 0.01% Hungarian3 0.01% Afghan
Geographical mobility in Reading Same house 1 year ago 18,733 81.7% White (Caucasian)7,216 89.1% Black or African American1,656 79.6% American Indian / Alaska Native991 82.9% Asian6 75.8% Native Hawaiian / Pacific Islander17,668 89.6% Other race31,908 83.1% Two or more races13,709 82.6% White alone, not Hispanic / Latino56,809 84.1% Hispanic or LatinoMoved within same county 2,818 12.3% White / Caucasian732 9.0% Black or African American239 11.5% American Indian / Alaska Native38 3.2% Asian2 23.6% Native Hawaiian / Pacific Islander519 2.6% Other race3,227 8.4% Two or more races1,862 11.2% White alone, not Hispanic / Latino5,588 8.3% Hispanic or LatinoMoved within same state 1,129 4.9% White / Caucasian144 1.8% Black or African American37 1.8% American Indian / Alaska Native38 3.2% Asian679 3.4% Other race412 1.1% Two or more races914 5.5% White alone, not Hispanic / Latino1,265 1.9% Hispanic or LatinoMoved from different state 243 1.1% White / Caucasian9 0.1% Black or African American156 7.5% American Indian / Alaska Native90 7.5% Asian646 3.3% Other race1,476 3.8% Two or more races113 0.7% White alone, not Hispanic / Latino2,321 3.4% Hispanic or LatinoMoved from abroad 15 0.7% American Indian / Alaska Native29 2.4% Asian215 1.1% Other race1,387 3.6% Two or more races1,602 2.4% Hispanic or Latino
Children Nativity (place of birth) in Reading
Children under 6 years - Living with two parents Both parents native 999 100.0% NativeBoth parents foreign-born 1,231 100.0% NativeOne native, one foreign-born parent 122 100.0% NativeChildren under 6 years - Living with one parent Native parent 3,179 100.0% NativeForeign-born parent 2,365 100.0% NativeChildren 6 to 17 years - Living with two parents Both parents native 1,541 100.0% NativeBoth parents foreign-born 2,017 68.9% Native910 31.1% Foreign-bornOne native, one foreign-born parent 56 100.0% NativeChildren 6 to 17 years - Living with one parent Native parent 6,364 100.0% NativeForeign-born parent 4,066 56.1% Native3,179 43.9% Foreign-born
Grandparents responsible for own grandchildren in Reading
Grandparents (30 to 59 years) White / Caucasian 150 36.2% Responsible for grandchildren265 63.8% Not responsible for grandchildrenBlack or African American 14 14.4% Responsible for grandchildren81 85.6% Not responsible for grandchildrenAmerican Indian / Alaska Native 17 17.4% Responsible for grandchildren80 82.6% Not responsible for grandchildrenAsian 31 100.0% Not responsible for grandchildrenOther race 165 30.3% Responsible for grandchildren379 69.7% Not responsible for grandchildrenTwo or more races 234 61.9% Responsible for grandchildren144 38.1% Not responsible for grandchildrenWhite alone, not Hispanic / Latino 96 40.1% Responsible for grandchildren143 59.9% Not responsible for grandchildrenHispanic or Latino 624 45.4% Responsible for grandchildren750 54.6% Not responsible for grandchildrenGrandparents (60 years and over) White / Caucasian 48 14.9% Responsible for grandchildren276 85.1% Not responsible for grandchildrenBlack or African American 17 9.5% Responsible for grandchildren166 90.5% Not responsible for grandchildrenAmerican Indian / Alaska Native 18 18.5% Responsible for grandchildren77 81.5% Not responsible for grandchildrenAsian 58 100.0% Not responsible for grandchildrenOther race 137 25.8% Responsible for grandchildren394 74.2% Not responsible for grandchildrenTwo or more races 102 21.8% Responsible for grandchildren366 78.2% Not responsible for grandchildrenWhite alone, not Hispanic / Latino 48 22.6% Responsible for grandchildren165 77.4% Not responsible for grandchildrenHispanic or Latino 185 14.8% Responsible for grandchildren1,068 85.2% Not responsible for grandchildren