Races in Redondo Beach, California (CA) Detailed Stats
Data:
Races - White alone (%)
Races - White alone (% change since 2000)
Races - Black alone (%)
Races - Black alone (% change since 2000)
Races - American Indian alone (%)
Races - American Indian alone (% change since 2000)
Races - Asian alone (%)
Races - Asian alone (% change since 2000)
Races - Hispanic (%)
Races - Hispanic (% change since 2000)
Races - Native Hawaiian and Other Pacific Islander alone (%)
Races - Native Hawaiian and Other Pacific Islander alone (% change since 2000)
Races - Two or more races(%)
Races - Two or more races(% change since 2000)
Races - Other race alone (%)
Races - Other race alone (% change since 2000)
Racial diversity
Place of birth - Born in state of residence (%)
Place of birth - Born in state of residence (%) - White
Place of birth - Born in state of residence (%) - Black or African American
Place of birth - Born in state of residence (%) - Asian
Place of birth - Born in state of residence (%) - Hispanic or Latino
Place of birth - Born in state of residence (%) - American Indian and Alaska Native
Place of birth - Born in state of residence (%) - Multirace
Place of birth - Born in state of residence (%) - Other Race
Place of birth - Born in other state (%)
Place of birth - Born in other state (%) - White
Place of birth - Born in other state (%) - Black or African American
Place of birth - Born in other state (%) - Asian
Place of birth - Born in other state (%) - Hispanic or Latino
Place of birth - Born in other state (%) - American Indian and Alaska Native
Place of birth - Born in other state (%) - Multirace
Place of birth - Born in other state (%) - Other Race
Place of birth - Native, outside of US (%)
Place of birth - Native, outside of US (%) - White
Place of birth - Native, outside of US (%) - Black or African American
Place of birth - Native, outside of US (%) - Asian
Place of birth - Native, outside of US (%) - Hispanic or Latino
Place of birth - Native, outside of US (%) - American Indian and Alaska Native
Place of birth - Native, outside of US (%) - Multirace
Place of birth - Native, outside of US (%) - Other Race
Place of birth - Foreign born (%)
Place of birth - Foreign born (%) - White
Place of birth - Foreign born (%) - Black or African American
Place of birth - Foreign born (%) - Asian
Place of birth - Foreign born (%) - Hispanic or Latino
Place of birth - Foreign born (%) - American Indian and Alaska Native
Place of birth - Foreign born (%) - Multirace
Place of birth - Foreign born (%) - Other Race
Residents speaking English at home (%)
Residents speaking English at home - Born in the United States (%)
Residents speaking English at home - Native, born elsewhere (%)
Residents speaking English at home - Foreign born (%)
Residents speaking Spanish at home (%)
Residents speaking Spanish at home - Born in the United States (%)
Residents speaking Spanish at home - Native, born elsewhere (%)
Residents speaking Spanish at home - Foreign born (%)
Residents speaking other language at home (%)
Residents speaking other language at home - Born in the United States (%)
Residents speaking other language at home - Native, born elsewhere (%)
Residents speaking other language at home - Foreign born (%)
Marital status - Never married (%)
Marital status - Now married (%)
Marital status - Separated (%)
Marital status - Widowed (%)
Marital status - Divorced (%)
Ancestries Reported - Arab (%)
Ancestries Reported - Czech (%)
Ancestries Reported - Danish (%)
Ancestries Reported - Dutch (%)
Ancestries Reported - English (%)
Ancestries Reported - French (%)
Ancestries Reported - French Canadian (%)
Ancestries Reported - German (%)
Ancestries Reported - Greek (%)
Ancestries Reported - Hungarian (%)
Ancestries Reported - Irish (%)
Ancestries Reported - Italian (%)
Ancestries Reported - Lithuanian (%)
Ancestries Reported - Norwegian (%)
Ancestries Reported - Polish (%)
Ancestries Reported - Portuguese (%)
Ancestries Reported - Russian (%)
Ancestries Reported - Scotch-Irish (%)
Ancestries Reported - Scottish (%)
Ancestries Reported - Slovak (%)
Ancestries Reported - Subsaharan African (%)
Ancestries Reported - Swedish (%)
Ancestries Reported - Swiss (%)
Ancestries Reported - Ukrainian (%)
Ancestries Reported - United States (%)
Ancestries Reported - Welsh (%)
Ancestries Reported - West Indian (%)
Ancestries Reported - Other (%)
Geographical mobility - Same house 1 year ago (%)
Geographical mobility - Same house 1 year ago (%) - White
Geographical mobility - Same house 1 year ago (%) - Black or African American
Geographical mobility - Same house 1 year ago (%) - Asian
Geographical mobility - Same house 1 year ago (%) - Hispanic or Latino
Geographical mobility - Same house 1 year ago (%) - American Indian and Alaska Native
Geographical mobility - Same house 1 year ago (%) - Multirace
Geographical mobility - Same house 1 year ago (%) - Other Race
Geographical mobility - Moved within same county (%)
Geographical mobility - Moved within same county (%) - White
Geographical mobility - Moved within same county (%) - Black or African American
Geographical mobility - Moved within same county (%) - Asian
Geographical mobility - Moved within same county (%) - Hispanic or Latino
Geographical mobility - Moved within same county (%) - American Indian and Alaska Native
Geographical mobility - Moved within same county (%) - Multirace
Geographical mobility - Moved within same county (%) - Other Race
Geographical mobility - Moved from different county within same state (%)
Geographical mobility - Moved from different county within same state (%) - White
Geographical mobility - Moved from different county within same state (%) - Black or African American
Geographical mobility - Moved from different county within same state (%) - Asian
Geographical mobility - Moved from different county within same state (%) - Hispanic or Latino
Geographical mobility - Moved from different county within same state (%) - American Indian and Alaska Native
Geographical mobility - Moved from different county within same state (%) - Multirace
Geographical mobility - Moved from different county within same state (%) - Other Race
Geographical mobility - Moved from different state (%)
Geographical mobility - Moved from different state (%) - White
Geographical mobility - Moved from different state (%) - Black or African American
Geographical mobility - Moved from different state (%) - Asian
Geographical mobility - Moved from different state (%) - Hispanic or Latino
Geographical mobility - Moved from different state (%) - American Indian and Alaska Native
Geographical mobility - Moved from different state (%) - Multirace
Geographical mobility - Moved from different state (%) - Other Race
Geographical mobility - Moved from abroad (%)
Geographical mobility - Moved from abroad (%) - White
Geographical mobility - Moved from abroad (%) - Black or African American
Geographical mobility - Moved from abroad (%) - Asian
Geographical mobility - Moved from abroad (%) - Hispanic or Latino
Geographical mobility - Moved from abroad (%) - American Indian and Alaska Native
Geographical mobility - Moved from abroad (%) - Multirace
Geographical mobility - Moved from abroad (%) - Other Race
Place of birth for the foreign-born population - Ireland (%)
Place of birth for the foreign-born population - Denmark (%)
Place of birth for the foreign-born population - Norway (%)
Place of birth for the foreign-born population - Sweden (%)
Place of birth for the foreign-born population - United Kingdom (%)
Place of birth for the foreign-born population - England (%)
Place of birth for the foreign-born population - Scotland (%)
Place of birth for the foreign-born population - Other Northern Europe (%)
Place of birth for the foreign-born population - Austria (%)
Place of birth for the foreign-born population - Belgium (%)
Place of birth for the foreign-born population - France (%)
Place of birth for the foreign-born population - Germany (%)
Place of birth for the foreign-born population - Netherlands (%)
Place of birth for the foreign-born population - Switzerland (%)
Place of birth for the foreign-born population - Other Western Europe (%)
Place of birth for the foreign-born population - Greece (%)
Place of birth for the foreign-born population - Italy (%)
Place of birth for the foreign-born population - Portugal (%)
Place of birth for the foreign-born population - Spain (%)
Place of birth for the foreign-born population - Other Southern Europe (%)
Place of birth for the foreign-born population - Albania (%)
Place of birth for the foreign-born population - Belarus (%)
Place of birth for the foreign-born population - Bosnia and Herzegovina (%)
Place of birth for the foreign-born population - Bulgaria (%)
Place of birth for the foreign-born population - Croatia (%)
Place of birth for the foreign-born population - Czechoslovakia (%)
Place of birth for the foreign-born population - Hungary (%)
Place of birth for the foreign-born population - Latvia (%)
Place of birth for the foreign-born population - Lithuania (%)
Place of birth for the foreign-born population - North Macedonia (Macedonia) (%)
Place of birth for the foreign-born population - Moldova (%)
Place of birth for the foreign-born population - Poland (%)
Place of birth for the foreign-born population - Romania (%)
Place of birth for the foreign-born population - Russia (%)
Place of birth for the foreign-born population - Serbia (%)
Place of birth for the foreign-born population - Ukraine (%)
Place of birth for the foreign-born population - Other Eastern Europe (%)
Place of birth for the foreign-born population - China (%)
Place of birth for the foreign-born population - Hong Kong (%)
Place of birth for the foreign-born population - Taiwan (%)
Place of birth for the foreign-born population - Japan (%)
Place of birth for the foreign-born population - Korea (%)
Place of birth for the foreign-born population - Other Eastern Asia (%)
Place of birth for the foreign-born population - Afghanistan (%)
Place of birth for the foreign-born population - Bangladesh (%)
Place of birth for the foreign-born population - India (%)
Place of birth for the foreign-born population - Iran (%)
Place of birth for the foreign-born population - Kazakhstan (%)
Place of birth for the foreign-born population - Nepal (%)
Place of birth for the foreign-born population - Pakistan (%)
Place of birth for the foreign-born population - Sri Lanka (%)
Place of birth for the foreign-born population - Uzbekistan (%)
Place of birth for the foreign-born population - Other South Central Asia (%)
Place of birth for the foreign-born population - Burma (%)
Place of birth for the foreign-born population - Cambodia (%)
Place of birth for the foreign-born population - Indonesia (%)
Place of birth for the foreign-born population - Laos (%)
Place of birth for the foreign-born population - Malaysia (%)
Place of birth for the foreign-born population - Philippines (%)
Place of birth for the foreign-born population - Singapore (%)
Place of birth for the foreign-born population - Thailand (%)
Place of birth for the foreign-born population - Vietnam (%)
Place of birth for the foreign-born population - Other South Eastern Asia (%)
Place of birth for the foreign-born population - Armenia (%)
Place of birth for the foreign-born population - Iraq (%)
Place of birth for the foreign-born population - Israel (%)
Place of birth for the foreign-born population - Jordan (%)
Place of birth for the foreign-born population - Kuwait (%)
Place of birth for the foreign-born population - Lebanon (%)
Place of birth for the foreign-born population - Saudi Arabia (%)
Place of birth for the foreign-born population - Syria (%)
Place of birth for the foreign-born population - Turkey (%)
Place of birth for the foreign-born population - Yemen (%)
Place of birth for the foreign-born population - Other Western Asia (%)
Place of birth for the foreign-born population - Eritrea (%)
Place of birth for the foreign-born population - Ethiopia (%)
Place of birth for the foreign-born population - Kenya (%)
Place of birth for the foreign-born population - Somalia (%)
Place of birth for the foreign-born population - Uganda (%)
Place of birth for the foreign-born population - Zimbabwe (%)
Place of birth for the foreign-born population - Other Eastern Africa (%)
Place of birth for the foreign-born population - Cameroon (%)
Place of birth for the foreign-born population - Congo (%)
Place of birth for the foreign-born population - Democratic Republic of Congo (Zaire) (%)
Place of birth for the foreign-born population - Other Middle Africa (%)
Place of birth for the foreign-born population - Egypt (%)
Place of birth for the foreign-born population - Morocco (%)
Place of birth for the foreign-born population - Sudan (%)
Place of birth for the foreign-born population - Other Northern Africa (%)
Place of birth for the foreign-born population - South Africa (%)
Place of birth for the foreign-born population - Other Southern Africa (%)
Place of birth for the foreign-born population - Cabo Verde (%)
Place of birth for the foreign-born population - Ghana (%)
Place of birth for the foreign-born population - Liberia (%)
Place of birth for the foreign-born population - Nigeria (%)
Place of birth for the foreign-born population - Senegal (%)
Place of birth for the foreign-born population - Sierra Leone (%)
Place of birth for the foreign-born population - Other Western Africa (%)
Place of birth for the foreign-born population - Australia (%)
Place of birth for the foreign-born population - New Zealand (%)
Place of birth for the foreign-born population - Fiji (%)
Place of birth for the foreign-born population - Micronesia (%)
Place of birth for the foreign-born population - Bahamas (%)
Place of birth for the foreign-born population - Barbados (%)
Place of birth for the foreign-born population - Cuba (%)
Place of birth for the foreign-born population - Dominica (%)
Place of birth for the foreign-born population - Dominican Republic (%)
Place of birth for the foreign-born population - Grenada (%)
Place of birth for the foreign-born population - Haiti (%)
Place of birth for the foreign-born population - Jamaica (%)
Place of birth for the foreign-born population - St. Vincent and the Grenadines (%)
Place of birth for the foreign-born population - Trinidad and Tobago (%)
Place of birth for the foreign-born population - West Indies (%)
Place of birth for the foreign-born population - Other Caribbean (%)
Place of birth for the foreign-born population - Belize (%)
Place of birth for the foreign-born population - Costa Rica (%)
Place of birth for the foreign-born population - El Salvador (%)
Place of birth for the foreign-born population - Guatemala (%)
Place of birth for the foreign-born population - Honduras (%)
Place of birth for the foreign-born population - Mexico (%)
Place of birth for the foreign-born population - Nicaragua (%)
Place of birth for the foreign-born population - Panama (%)
Place of birth for the foreign-born population - Other Central America (%)
Place of birth for the foreign-born population - Argentina (%)
Place of birth for the foreign-born population - Bolivia (%)
Place of birth for the foreign-born population - Brazil (%)
Place of birth for the foreign-born population - Chile (%)
Place of birth for the foreign-born population - Colombia (%)
Place of birth for the foreign-born population - Ecuador (%)
Place of birth for the foreign-born population - Guyana (%)
Place of birth for the foreign-born population - Peru (%)
Place of birth for the foreign-born population - Uruguay (%)
Place of birth for the foreign-born population - Venezuela (%)
Place of birth for the foreign-born population - Other South America (%)
Place of birth for the foreign-born population - Canada (%)
Place of birth for the foreign-born population - Other Northern America (%)
Place of birth for the foreign-born population - Other (%)
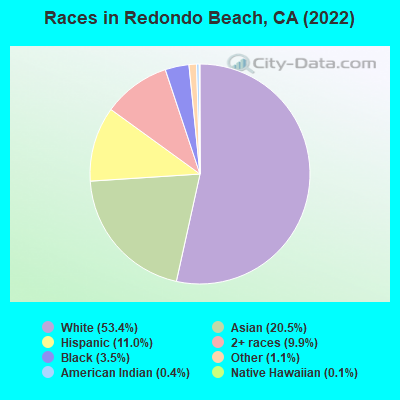
According to 2022 data, the most numerous races in Redondo Beach, CA are Hispanic (10,960 residents), White alone (37,916 residents), and Asian alone (9,521 residents). 76.3% of Redondo Beach residents speak English at home. 19.8% of Redondo Beach, CA residents are foreign-born (8.6% born in Asia, 4.8% born in Europe, 4.1% born in Latin America), which is 31.3% less than the foreign-born rate of 26.0% across the entire state of California.
Race distribution in Redondo Beach
2000 2022
44,819 70.8% White alone 8,524 13.5% Hispanic 5,677 9.0% Asian alone 2,115 3.3% Two or more races 1,531 2.4% Black alone 198 0.3% Other race alone 212 0.3% Native Hawaiian and Other 185 0.3% American Indian alone
37,916 56.4% White alone 10,960 16.3% Hispanic 9,521 14.2% Asian alone 5,399 8.0% Two or more races 2,012 3.0% Black alone 923 1.4% Other race alone 172 0.3% American Indian alone 55 0.08% Native Hawaiian and Other
2000 2022
15,816,790 46.7% White alone 10,966,556 32.4% Hispanic 3,648,860 10.8% Asian alone 2,181,926 6.4% Black alone 903,115 2.7% Two or more races 178,984 0.5% American Indian alone 103,736 0.3% Native Hawaiian and Other 71,681 0.2% Other race alone
15,732,184 40.3% Hispanic 13,160,426 33.7% White alone 5,957,867 15.3% Asian alone 2,025,218 5.2% Black alone 1,663,222 4.3% Two or more races 251,618 0.6% Other race alone 135,777 0.3% Native Hawaiian and Other 103,030 0.3% American Indian alone
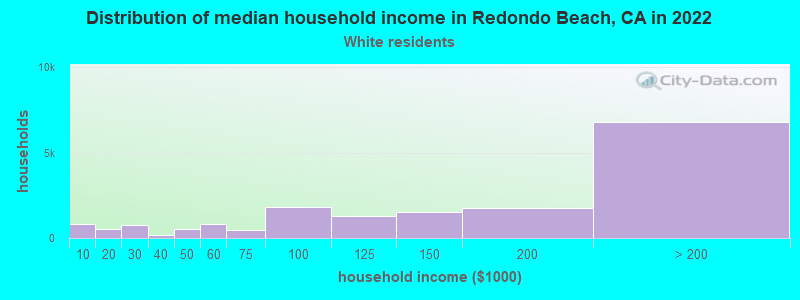
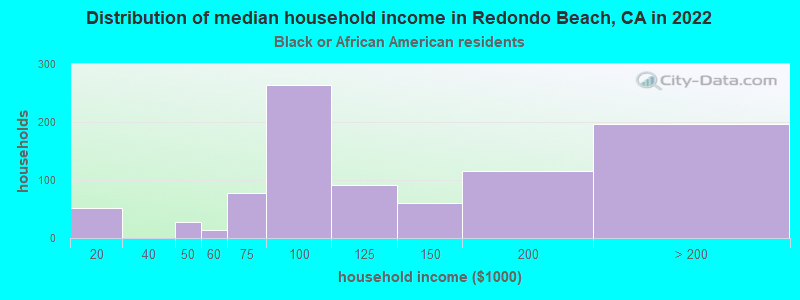
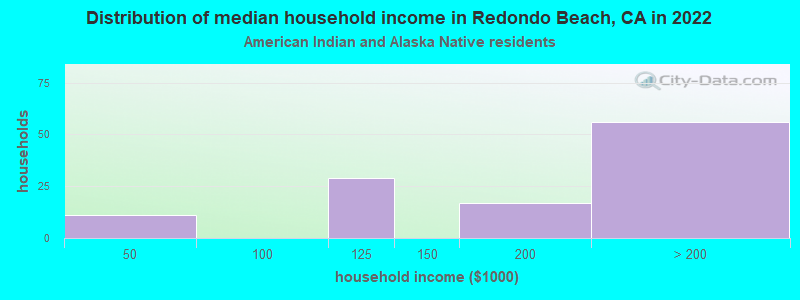
Income and house value in Redondo Beach Median household income in 2022 $131,781 White non-Hispanic householders$157,927 Black householders$105,598 American Indian and Alaska Native householders$148,985 Asian householders$189,956 Native Hawaiian and other Pacific Islander householdersover $200,000 Some other race householders$93,678 Two or more races householders$149,719 Hispanic or Latino race householdersMedian 2022 house value over $1,000,000 White Non-Hispanic householdersover $1,000,000 Black or African American householdersover $1,000,000 American Indian or Alaska Native householders over $1,000,000 Asian householders$732,816 Native Hawaiian and other Pacific Islander householdersover $1,000,000 Some other race householdersover $1,000,000 Two or more races householdersover $1,000,000 Hispanic or Latino householders
Median age by race in Redondo Beach
41.4 Median age for White residents44.0 40.3 44.8 Median age for Black or African American residents50.2 29.2 48.5 Median age for American Indian / Alaska Native residents49.9 36.8 47.1 Median age for Asian residents41.2 47.4 39.6 Median age for Native Hawaiian / Pacific Islander residents42.2 Median age for Other race residents40.0 42.8 18.6 Median age for Two or more races residents19.3 16.2 41.5 Median age for White alone residents44.0 39.1 30.9 Median age for Hispanic or Latino residents31.9 24.7
Owner/renter occupied households by race in Redondo Beach
House owners and renters - White residents 8,702 49.6% Owner occupied8,846 50.4% Renter occupiedHouse owners and renters - Black or African American residents 251 45.8% Owner occupied297 54.2% Renter occupiedHouse owners and renters - American Indian / Alaska Native residents 82 49.3% Owner occupied85 50.7% Renter occupiedHouse owners and renters - Asian residents 2,786 69.2% Owner occupied1,238 30.8% Renter occupiedHouse owners and renters - Native Hawaiian / Pacific Islander residents 47 71.2% Owner occupied19 28.8% Renter occupiedHouse owners and renters - Other race residents 296 33.7% Owner occupied583 66.3% Renter occupiedHouse owners and renters - Two or more races residents 2,161 60.4% Owner occupied1,417 39.6% Renter occupiedHouse owners and renters - White alone residents 8,729 49.0% Owner occupied9,075 51.0% Renter occupiedHouse owners and renters - Hispanic or Latino residents 1,117 42.2% Owner occupied1,533 57.8% Renter occupied
Language usage in Redondo Beach
English speakers - Total 76.3% of residents of Redondo Beach speak English at home.
8.9% of residents speak Spanish at home 4,380 77.3% Speak English very well1,289 22.7% Speak English less than very well15.4% of residents speak other language at home 7,056 72.5% Speak English very well2,681 27.5% Speak English less than very well
English speakers - Born in the United States 93.0% of residents of Redondo Beach speak English at home.
2.9% of residents speak Spanish at home 460 86.5% Speak English very well72 13.5% Speak English less than very well4.1% of residents speak other language at home 663 90.3% Speak English very well71 9.7% Speak English less than very well
English speakers - Native, born elsewhere 58.5% of residents of Redondo Beach speak English at home.
27.5% of residents speak Spanish at home 259 79.4% Speak English very well67 20.6% Speak English less than very well14.3% of residents speak other language at home 169 100.0% Speak English very well
English speakers - Foreign-born 31.7% of residents of Redondo Beach speak English at home.
15.8% of residents speak Spanish at home 1,160 56.9% Speak English very well877 43.1% Speak English less than very well56.4% of residents speak other language at home 4,745 65.0% Speak English very well2,554 35.0% Speak English less than very well
White (Caucasian) - Speak only English Native:
98.2% (30,059)Foreign-born:
40.3% (1,787)
White (Caucasian) - Speak another language Native:
5.8% (1,765)Foreign-born:
66.4% (2,946)
Black or African American - Speak only English Native:
93.1% (1,692)Foreign-born:
47.0% (199)
Black or African American - Speak another language Native:
7.3% (133)Foreign-born:
50.1% (212)
American Indian / Alaska Native - Speak another language Native:
8.6% (30)Foreign-born:
99.6% (46)
Asian - Speak only English Native:
79.2% (4,612)Foreign-born:
23.9% (1,139)
Asian - Speak another language Native:
22.2% (1,295)Foreign-born:
77.4% (3,699)
Other race - Speak only English Native:
65.7% (1,260)Foreign-born:
3.9% (31)
Other race - Speak another language Native:
39.5% (758)Foreign-born:
95.7% (772)
Two or more races - Speak only English Native:
66.3% (6,297)Foreign-born:
12.7% (338)
Two or more races - Speak another language Native:
29.4% (2,791)Foreign-born:
84.3% (2,249)
White alone - Speak only English Native:
95.3% (28,844)Foreign-born:
39.7% (1,910)
White alone - Speak another language Native:
4.7% (1,413)Foreign-born:
60.1% (2,888)
Hispanic or Latino - Speak only English Native:
67.3% (4,433)Foreign-born:
2.1% (48)
Hispanic or Latino - Speak another language Native:
34.8% (2,291)Foreign-born:
97.0% (2,205)
Foreign-born residents in Redondo Beach 13,323 residents are foreign born (8.6% Asia , 4.8% Europe , 4.1% Latin America ).
This city:
19.8%California:
100.0%
Marital status for residents in Redondo Beach Marital status - White (Caucasian) population 15 years and over
Males 29.0% Never married53.2% Now married1.1% Separated1.7% Widowed15.0% DivorcedFemales 33.8% Never married49.5% Now married0.3% Separated5.6% Widowed10.8% DivorcedWomen who gave birth in the past 12 months Now married:
93.6% (459)Unmarried:
6.4% (31)
Women who did not give birth in the past 12 months Now married:
48.1% (4,027)Unmarried:
51.9% (4,351)
Marital status - Black or African American population 15 years and over
Males 41.9% Never married45.4% Now married1.2% Separated0.7% Widowed10.8% DivorcedFemales 32.8% Never married36.8% Now married1.3% Separated10.9% Widowed18.2% DivorcedWomen who gave birth in the past 12 months Now married:
100.0% (18)Unmarried:
0.0% (0)
Women who did not give birth in the past 12 months Now married:
52.1% (206)Unmarried:
47.9% (189)
Marital status - American Indian / Alaska Native population 15 years and over
Males 53.0% Never married47.0% Now married0.0% Separated0.0% Widowed0.0% DivorcedFemales 55.3% Never married38.6% Now married0.0% Separated6.1% Widowed0.0% DivorcedWomen who did not give birth in the past 12 months Now married:
0.0% (0)Unmarried:
100.0% (118)
Marital status - Asian population 15 years and over
Males 31.5% Never married65.2% Now married0.0% Separated3.3% Widowed0.0% DivorcedFemales 19.2% Never married62.1% Now married5.5% Separated6.5% Widowed6.8% DivorcedWomen who gave birth in the past 12 months Now married:
100.0% (164)Unmarried:
0.0% (0)
Women who did not give birth in the past 12 months Now married:
66.8% (1,904)Unmarried:
33.2% (946)
Marital status - Native Hawaiian / Pacific Islander population 15 years and over
Males 100.0% Never married0.0% Now married0.0% Separated0.0% Widowed0.0% DivorcedFemales 56.9% Never married0.0% Now married43.1% Separated0.0% Widowed0.0% DivorcedWomen who did not give birth in the past 12 months Now married:
43.1% (21)Unmarried:
56.9% (28)
Marital status - Other race population 15 years and over
Males 28.5% Never married56.8% Now married1.0% Separated1.9% Widowed11.8% DivorcedFemales 27.9% Never married62.8% Now married0.5% Separated3.7% Widowed5.1% DivorcedWomen who gave birth in the past 12 months Now married:
100.0% (20)Unmarried:
0.0% (0)
Women who did not give birth in the past 12 months Now married:
62.6% (531)Unmarried:
37.4% (318)
Marital status - Two or more races population 15 years and over
Males 60.3% Never married28.7% Now married2.6% Separated0.7% Widowed7.7% DivorcedFemales 51.2% Never married37.7% Now married0.0% Separated1.7% Widowed9.4% DivorcedWomen who gave birth in the past 12 months Now married:
86.0% (126)Unmarried:
14.0% (21)
Women who did not give birth in the past 12 months Now married:
26.7% (903)Unmarried:
73.3% (2,477)
Marital status - White alone, not Hispanic / Latino population 15 years and over
Males 26.8% Never married54.5% Now married1.3% Separated1.5% Widowed15.9% DivorcedFemales 35.0% Never married47.0% Now married0.4% Separated6.1% Widowed11.5% DivorcedWomen who gave birth in the past 12 months Now married:
93.6% (547)Unmarried:
6.4% (37)
Women who did not give birth in the past 12 months Now married:
45.6% (4,092)Unmarried:
54.4% (4,872)
Marital status - Hispanic or Latino population 15 years and over
Males 37.2% Never married50.8% Now married1.8% Separated2.0% Widowed8.2% DivorcedFemales 33.0% Never married55.0% Now married2.4% Separated2.5% Widowed7.0% DivorcedWomen who gave birth in the past 12 months Now married:
83.3% (35)Unmarried:
16.7% (7)
Women who did not give birth in the past 12 months Now married:
52.4% (1,411)Unmarried:
47.6% (1,284)
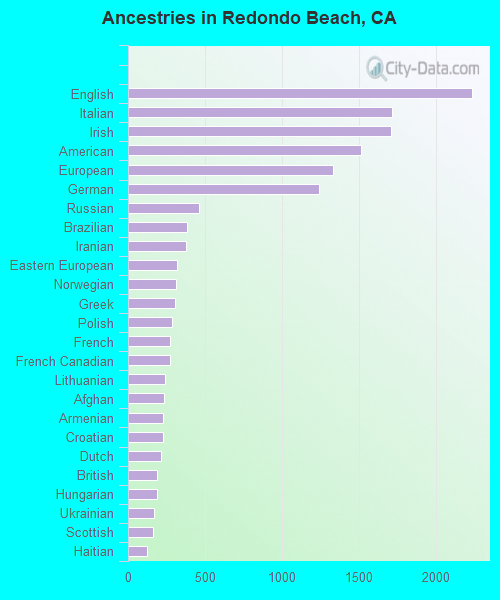
Ancestries in Redondo Beach
2,243 7.0% English1,876 5.9% European1,570 4.9% German1,513 4.7% Irish1,112 3.5% American833 2.6% Italian510 1.6% Russian497 1.6% Eastern European395 1.2% Iranian382 1.2% British364 1.1% Polish361 1.1% French289 0.9% Brazilian282 0.9% Northern European269 0.8% Egyptian256 0.8% Norwegian252 0.8% Ukrainian212 0.7% Greek207 0.6% Scottish193 0.6% Hungarian165 0.5% Nigerian164 0.5% Czech161 0.5% Armenian160 0.5% Dutch144 0.5% Swedish142 0.4% African137 0.4% Albanian134 0.4% Romanian128 0.4% Afghan115 0.4% Scotch-Irish111 0.3% French Canadian105 0.3% Israeli94 0.3% Croatian87 0.3% Danish83 0.3% Lithuanian81 0.3% Canadian71 0.2% Palestinian70 0.2% Lebanese66 0.2% Finnish65 0.2% Swiss61 0.2% Scandinavian61 0.2% Turkish59 0.2% Arab58 0.2% Serbian56 0.2% Jamaican52 0.2% Welsh47 0.1% Ghanaian42 0.1% Portuguese35 0.1% Austrian29 0.09% Yugoslavian28 0.09% Moroccan25 0.08% Bulgarian23 0.07% Belgian22 0.07% Trinidadian and Tobagonian22 0.07% West Indian19 0.06% Australian15 0.05% Kenyan11 0.03% Basque11 0.03% Slavic10 0.03% Jordanian8 0.03% Czechoslovakian7 0.02% Latvian7 0.02% Slovak
Geographical mobility in Redondo Beach Same house 1 year ago 30,933 83.0% White (Caucasian)1,937 87.7% Black or African American361 87.6% American Indian / Alaska Native9,848 90.6% Asian63 98.4% Native Hawaiian / Pacific Islander2,604 89.1% Other race13,336 96.8% Two or more races33,379 87.5% White alone, not Hispanic / Latino9,242 84.5% Hispanic or LatinoMoved within same county 3,715 10.0% White / Caucasian148 6.7% Black or African American294 2.7% Asian192 6.6% Other race674 4.9% Two or more races3,003 7.9% White alone, not Hispanic / Latino866 7.9% Hispanic or LatinoMoved within same state 207 0.6% White / Caucasian15 0.7% Black or African American176 1.6% Asian8 0.3% Other race47 0.3% Two or more races596 1.6% White alone, not Hispanic / Latino49 0.5% Hispanic or LatinoMoved from different state 1,234 3.3% White / Caucasian132 6.0% Black or African American26 6.3% American Indian / Alaska Native1 1.8% Native Hawaiian / Pacific Islander107 3.6% Other race62 0.4% Two or more races962 2.5% White alone, not Hispanic / Latino314 2.9% Hispanic or LatinoMoved from abroad 902 2.4% White461 4.2% Asian10 0.3% Other race39 0.3% Two or more races137 0.4% White alone, not Hispanic / Latino396 3.6% Hispanic or Latino
Children Nativity (place of birth) in Redondo Beach
Children under 6 years - Living with two parents Both parents native 2,513 100.0% Native1 0.0% Foreign-bornBoth parents foreign-born 383 79.4% Native99 20.6% Foreign-bornOne native, one foreign-born parent 1,186 100.0% NativeChildren under 6 years - Living with one parent Native parent 467 99.9% Native0 0.1% Foreign-bornForeign-born parent 92 88.9% Native11 11.1% Foreign-bornChildren 6 to 17 years - Living with two parents Both parents native 4,259 100.0% NativeBoth parents foreign-born 716 67.2% Native350 32.8% Foreign-bornOne native, one foreign-born parent 1,643 100.0% NativeChildren 6 to 17 years - Living with one parent Native parent 1,402 100.0% NativeForeign-born parent 409 50.0% Native409 50.0% Foreign-born
Place of birth for residents in Redondo Beach 5,852 Asia3,387 Americas3,301 Europe2,806 Latin America2,404 Eastern Asia1,797 South Eastern Asia1,376 Central America1,313 Eastern Europe1,299 South Central Asia1,209 South America973 Northern Europe897 China696 Western Europe600 Africa580 Northern America328 Western Asia318 Southern Europe279 Northern Africa220 Caribbean181 Oceania181 Australia and New Zealand Subregion176 Eastern Africa105 Western Africa29 Southern Africa1,027 Philippines923 Mexico855 Japan651 Korea606 India580 Canada528 United Kingdom523 China458 Iran447 Vietnam394 Argentina311 Ukraine295 France295 Brazil293 Taiwan283 Russia277 Germany268 Egypt234 El Salvador220 Peru199 England166 Italy151 Australia148 Hungary136 Colombia127 Lebanon123 Indonesia117 Ireland115 Belize114 Greece105 Nigeria102 Cuba99 Romania97 Netherlands97 Albania88 Poland87 Israel80 Hong Kong80 Chile74 Pakistan70 Afghanistan69 Lithuania69 Thailand67 Czechoslovakia64 Sweden61 Bangladesh60 Trinidad and Tobago51 Cambodia51 Turkey48 Croatia39 Costa Rica38 Scotland38 Singapore37 Spain35 Kenya34 Bolivia32 Guatemala29 New Zealand29 South Africa26 Honduras25 Syria24 Uzbekistan21 Malaysia21 Bulgaria19 Venezuela18 Burma18 Ecuador17 Moldova15 Uganda15 Serbia14 Kuwait14 Austria12 Belgium11 Morocco10 Haiti10 Belarus9 Ethiopia8 Jamaica4 Panama2 Nepal
Grandparents responsible for own grandchildren in Redondo Beach
Grandparents (30 to 59 years) White / Caucasian 9 100.0% Not responsible for grandchildrenBlack or African American 11 100.0% Not responsible for grandchildrenWhite alone, not Hispanic / Latino 9 100.0% Not responsible for grandchildrenGrandparents (60 years and over) White / Caucasian 63 52.0% Responsible for grandchildren58 48.0% Not responsible for grandchildrenBlack or African American 85 100.0% Not responsible for grandchildrenWhite alone, not Hispanic / Latino 77 48.8% Responsible for grandchildren81 51.2% Not responsible for grandchildren