Races in Reston, Virginia (VA) Detailed Stats
Data:
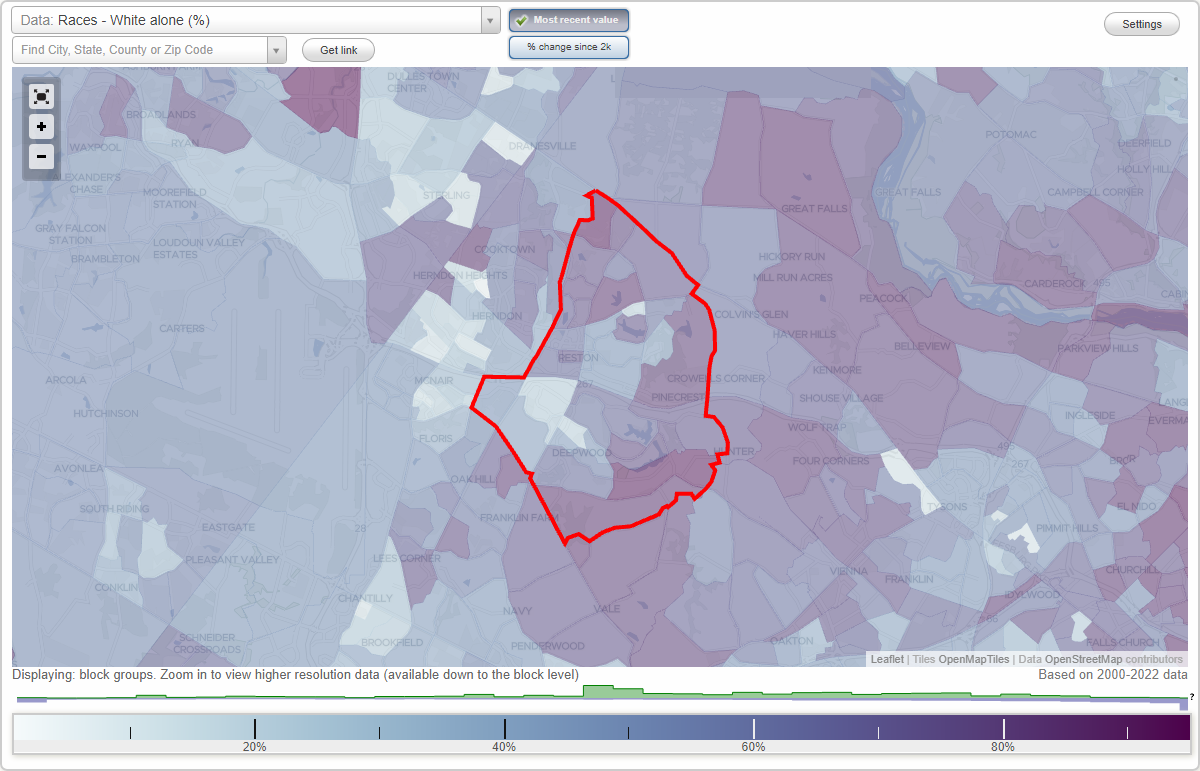
Races - White alone (%)
Races - White alone (% change since 2000)
Races - Black alone (%)
Races - Black alone (% change since 2000)
Races - American Indian alone (%)
Races - American Indian alone (% change since 2000)
Races - Asian alone (%)
Races - Asian alone (% change since 2000)
Races - Hispanic (%)
Races - Hispanic (% change since 2000)
Races - Native Hawaiian and Other Pacific Islander alone (%)
Races - Native Hawaiian and Other Pacific Islander alone (% change since 2000)
Races - Two or more races(%)
Races - Two or more races(% change since 2000)
Races - Other race alone (%)
Races - Other race alone (% change since 2000)
Racial diversity
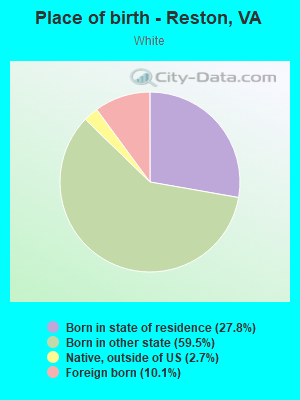
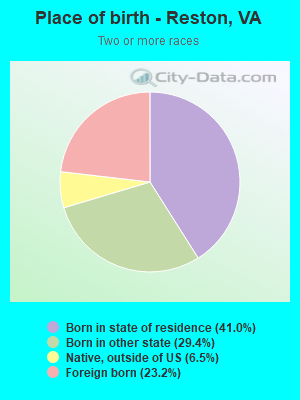
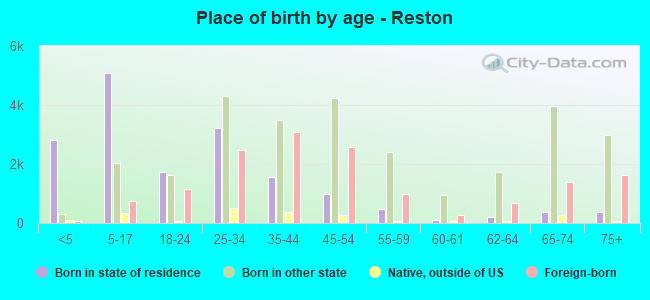
Place of birth - Born in state of residence (%)
Place of birth - Born in state of residence (%) - White
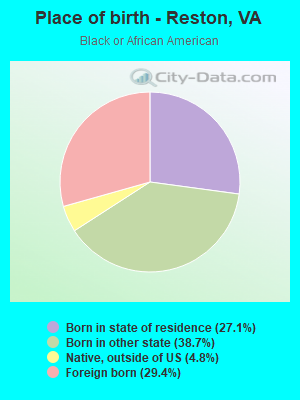
Place of birth - Born in state of residence (%) - Black or African American
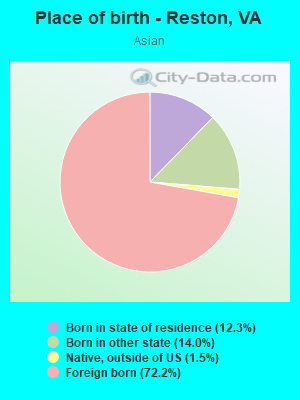
Place of birth - Born in state of residence (%) - Asian
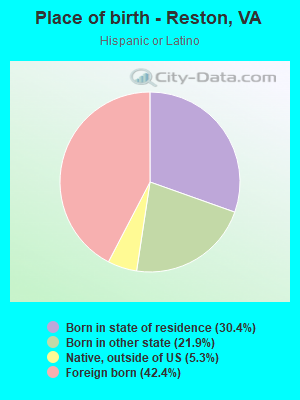
Place of birth - Born in state of residence (%) - Hispanic or Latino
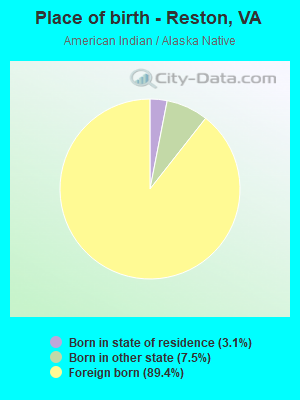
Place of birth - Born in state of residence (%) - American Indian and Alaska Native
Place of birth - Born in state of residence (%) - Multirace
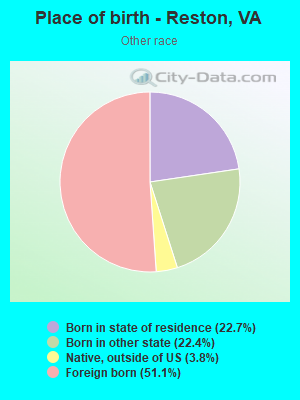
Place of birth - Born in state of residence (%) - Other Race
Place of birth - Born in other state (%)
Place of birth - Born in other state (%) - White
Place of birth - Born in other state (%) - Black or African American
Place of birth - Born in other state (%) - Asian
Place of birth - Born in other state (%) - Hispanic or Latino
Place of birth - Born in other state (%) - American Indian and Alaska Native
Place of birth - Born in other state (%) - Multirace
Place of birth - Born in other state (%) - Other Race
Place of birth - Native, outside of US (%)
Place of birth - Native, outside of US (%) - White
Place of birth - Native, outside of US (%) - Black or African American
Place of birth - Native, outside of US (%) - Asian
Place of birth - Native, outside of US (%) - Hispanic or Latino
Place of birth - Native, outside of US (%) - American Indian and Alaska Native
Place of birth - Native, outside of US (%) - Multirace
Place of birth - Native, outside of US (%) - Other Race
Place of birth - Foreign born (%)
Place of birth - Foreign born (%) - White
Place of birth - Foreign born (%) - Black or African American
Place of birth - Foreign born (%) - Asian
Place of birth - Foreign born (%) - Hispanic or Latino
Place of birth - Foreign born (%) - American Indian and Alaska Native
Place of birth - Foreign born (%) - Multirace
Place of birth - Foreign born (%) - Other Race
Residents speaking English at home (%)
Residents speaking English at home - Born in the United States (%)
Residents speaking English at home - Native, born elsewhere (%)
Residents speaking English at home - Foreign born (%)
Residents speaking Spanish at home (%)
Residents speaking Spanish at home - Born in the United States (%)
Residents speaking Spanish at home - Native, born elsewhere (%)
Residents speaking Spanish at home - Foreign born (%)
Residents speaking other language at home (%)
Residents speaking other language at home - Born in the United States (%)
Residents speaking other language at home - Native, born elsewhere (%)
Residents speaking other language at home - Foreign born (%)
Marital status - Never married (%)
Marital status - Now married (%)
Marital status - Separated (%)
Marital status - Widowed (%)
Marital status - Divorced (%)
Ancestries Reported - Arab (%)
Ancestries Reported - Czech (%)
Ancestries Reported - Danish (%)
Ancestries Reported - Dutch (%)
Ancestries Reported - English (%)
Ancestries Reported - French (%)
Ancestries Reported - French Canadian (%)
Ancestries Reported - German (%)
Ancestries Reported - Greek (%)
Ancestries Reported - Hungarian (%)
Ancestries Reported - Irish (%)
Ancestries Reported - Italian (%)
Ancestries Reported - Lithuanian (%)
Ancestries Reported - Norwegian (%)
Ancestries Reported - Polish (%)
Ancestries Reported - Portuguese (%)
Ancestries Reported - Russian (%)
Ancestries Reported - Scotch-Irish (%)
Ancestries Reported - Scottish (%)
Ancestries Reported - Slovak (%)
Ancestries Reported - Subsaharan African (%)
Ancestries Reported - Swedish (%)
Ancestries Reported - Swiss (%)
Ancestries Reported - Ukrainian (%)
Ancestries Reported - United States (%)
Ancestries Reported - Welsh (%)
Ancestries Reported - West Indian (%)
Ancestries Reported - Other (%)
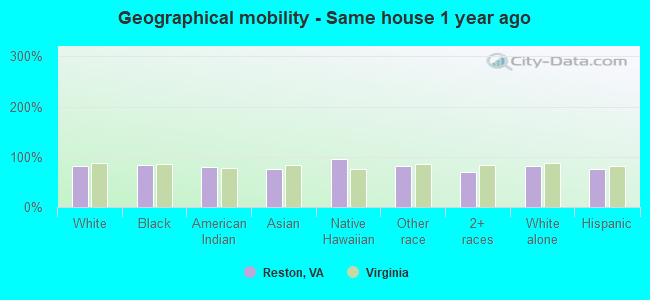
Geographical mobility - Same house 1 year ago (%)
Geographical mobility - Same house 1 year ago (%) - White
Geographical mobility - Same house 1 year ago (%) - Black or African American
Geographical mobility - Same house 1 year ago (%) - Asian
Geographical mobility - Same house 1 year ago (%) - Hispanic or Latino
Geographical mobility - Same house 1 year ago (%) - American Indian and Alaska Native
Geographical mobility - Same house 1 year ago (%) - Multirace
Geographical mobility - Same house 1 year ago (%) - Other Race
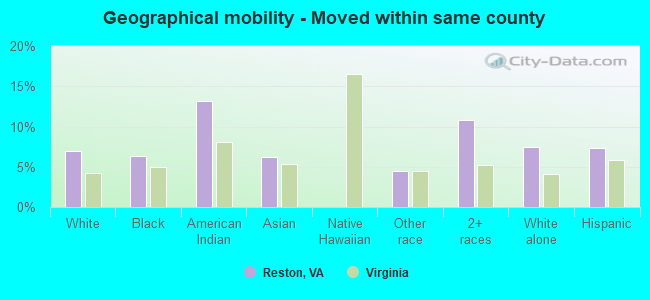
Geographical mobility - Moved within same county (%)
Geographical mobility - Moved within same county (%) - White
Geographical mobility - Moved within same county (%) - Black or African American
Geographical mobility - Moved within same county (%) - Asian
Geographical mobility - Moved within same county (%) - Hispanic or Latino
Geographical mobility - Moved within same county (%) - American Indian and Alaska Native
Geographical mobility - Moved within same county (%) - Multirace
Geographical mobility - Moved within same county (%) - Other Race
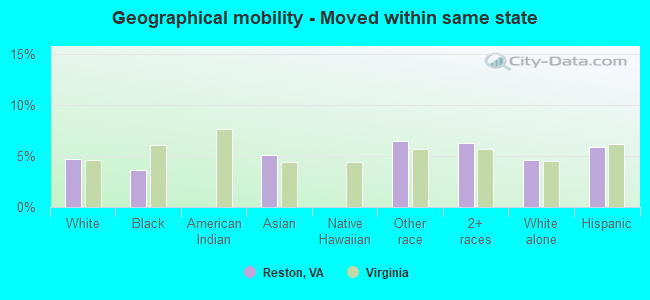
Geographical mobility - Moved from different county within same state (%)
Geographical mobility - Moved from different county within same state (%) - White
Geographical mobility - Moved from different county within same state (%) - Black or African American
Geographical mobility - Moved from different county within same state (%) - Asian
Geographical mobility - Moved from different county within same state (%) - Hispanic or Latino
Geographical mobility - Moved from different county within same state (%) - American Indian and Alaska Native
Geographical mobility - Moved from different county within same state (%) - Multirace
Geographical mobility - Moved from different county within same state (%) - Other Race
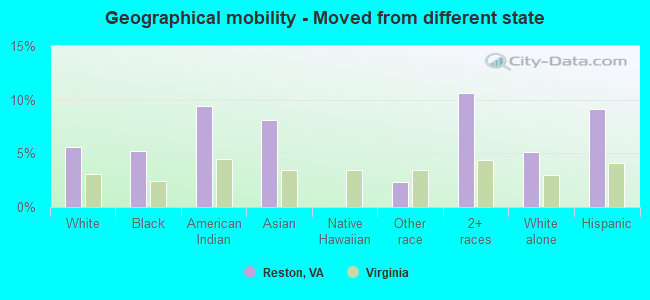
Geographical mobility - Moved from different state (%)
Geographical mobility - Moved from different state (%) - White
Geographical mobility - Moved from different state (%) - Black or African American
Geographical mobility - Moved from different state (%) - Asian
Geographical mobility - Moved from different state (%) - Hispanic or Latino
Geographical mobility - Moved from different state (%) - American Indian and Alaska Native
Geographical mobility - Moved from different state (%) - Multirace
Geographical mobility - Moved from different state (%) - Other Race
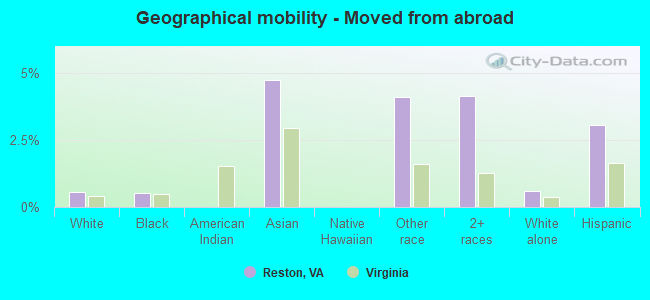
Geographical mobility - Moved from abroad (%)
Geographical mobility - Moved from abroad (%) - White
Geographical mobility - Moved from abroad (%) - Black or African American
Geographical mobility - Moved from abroad (%) - Asian
Geographical mobility - Moved from abroad (%) - Hispanic or Latino
Geographical mobility - Moved from abroad (%) - American Indian and Alaska Native
Geographical mobility - Moved from abroad (%) - Multirace
Geographical mobility - Moved from abroad (%) - Other Race
Place of birth for the foreign-born population - Ireland (%)
Place of birth for the foreign-born population - Denmark (%)
Place of birth for the foreign-born population - Norway (%)
Place of birth for the foreign-born population - Sweden (%)
Place of birth for the foreign-born population - United Kingdom (%)
Place of birth for the foreign-born population - England (%)
Place of birth for the foreign-born population - Scotland (%)
Place of birth for the foreign-born population - Other Northern Europe (%)
Place of birth for the foreign-born population - Austria (%)
Place of birth for the foreign-born population - Belgium (%)
Place of birth for the foreign-born population - France (%)
Place of birth for the foreign-born population - Germany (%)
Place of birth for the foreign-born population - Netherlands (%)
Place of birth for the foreign-born population - Switzerland (%)
Place of birth for the foreign-born population - Other Western Europe (%)
Place of birth for the foreign-born population - Greece (%)
Place of birth for the foreign-born population - Italy (%)
Place of birth for the foreign-born population - Portugal (%)
Place of birth for the foreign-born population - Spain (%)
Place of birth for the foreign-born population - Other Southern Europe (%)
Place of birth for the foreign-born population - Albania (%)
Place of birth for the foreign-born population - Belarus (%)
Place of birth for the foreign-born population - Bosnia and Herzegovina (%)
Place of birth for the foreign-born population - Bulgaria (%)
Place of birth for the foreign-born population - Croatia (%)
Place of birth for the foreign-born population - Czechoslovakia (%)
Place of birth for the foreign-born population - Hungary (%)
Place of birth for the foreign-born population - Latvia (%)
Place of birth for the foreign-born population - Lithuania (%)
Place of birth for the foreign-born population - North Macedonia (Macedonia) (%)
Place of birth for the foreign-born population - Moldova (%)
Place of birth for the foreign-born population - Poland (%)
Place of birth for the foreign-born population - Romania (%)
Place of birth for the foreign-born population - Russia (%)
Place of birth for the foreign-born population - Serbia (%)
Place of birth for the foreign-born population - Ukraine (%)
Place of birth for the foreign-born population - Other Eastern Europe (%)
Place of birth for the foreign-born population - China (%)
Place of birth for the foreign-born population - Hong Kong (%)
Place of birth for the foreign-born population - Taiwan (%)
Place of birth for the foreign-born population - Japan (%)
Place of birth for the foreign-born population - Korea (%)
Place of birth for the foreign-born population - Other Eastern Asia (%)
Place of birth for the foreign-born population - Afghanistan (%)
Place of birth for the foreign-born population - Bangladesh (%)
Place of birth for the foreign-born population - India (%)
Place of birth for the foreign-born population - Iran (%)
Place of birth for the foreign-born population - Kazakhstan (%)
Place of birth for the foreign-born population - Nepal (%)
Place of birth for the foreign-born population - Pakistan (%)
Place of birth for the foreign-born population - Sri Lanka (%)
Place of birth for the foreign-born population - Uzbekistan (%)
Place of birth for the foreign-born population - Other South Central Asia (%)
Place of birth for the foreign-born population - Burma (%)
Place of birth for the foreign-born population - Cambodia (%)
Place of birth for the foreign-born population - Indonesia (%)
Place of birth for the foreign-born population - Laos (%)
Place of birth for the foreign-born population - Malaysia (%)
Place of birth for the foreign-born population - Philippines (%)
Place of birth for the foreign-born population - Singapore (%)
Place of birth for the foreign-born population - Thailand (%)
Place of birth for the foreign-born population - Vietnam (%)
Place of birth for the foreign-born population - Other South Eastern Asia (%)
Place of birth for the foreign-born population - Armenia (%)
Place of birth for the foreign-born population - Iraq (%)
Place of birth for the foreign-born population - Israel (%)
Place of birth for the foreign-born population - Jordan (%)
Place of birth for the foreign-born population - Kuwait (%)
Place of birth for the foreign-born population - Lebanon (%)
Place of birth for the foreign-born population - Saudi Arabia (%)
Place of birth for the foreign-born population - Syria (%)
Place of birth for the foreign-born population - Turkey (%)
Place of birth for the foreign-born population - Yemen (%)
Place of birth for the foreign-born population - Other Western Asia (%)
Place of birth for the foreign-born population - Eritrea (%)
Place of birth for the foreign-born population - Ethiopia (%)
Place of birth for the foreign-born population - Kenya (%)
Place of birth for the foreign-born population - Somalia (%)
Place of birth for the foreign-born population - Uganda (%)
Place of birth for the foreign-born population - Zimbabwe (%)
Place of birth for the foreign-born population - Other Eastern Africa (%)
Place of birth for the foreign-born population - Cameroon (%)
Place of birth for the foreign-born population - Congo (%)
Place of birth for the foreign-born population - Democratic Republic of Congo (Zaire) (%)
Place of birth for the foreign-born population - Other Middle Africa (%)
Place of birth for the foreign-born population - Egypt (%)
Place of birth for the foreign-born population - Morocco (%)
Place of birth for the foreign-born population - Sudan (%)
Place of birth for the foreign-born population - Other Northern Africa (%)
Place of birth for the foreign-born population - South Africa (%)
Place of birth for the foreign-born population - Other Southern Africa (%)
Place of birth for the foreign-born population - Cabo Verde (%)
Place of birth for the foreign-born population - Ghana (%)
Place of birth for the foreign-born population - Liberia (%)
Place of birth for the foreign-born population - Nigeria (%)
Place of birth for the foreign-born population - Senegal (%)
Place of birth for the foreign-born population - Sierra Leone (%)
Place of birth for the foreign-born population - Other Western Africa (%)
Place of birth for the foreign-born population - Australia (%)
Place of birth for the foreign-born population - New Zealand (%)
Place of birth for the foreign-born population - Fiji (%)
Place of birth for the foreign-born population - Micronesia (%)
Place of birth for the foreign-born population - Bahamas (%)
Place of birth for the foreign-born population - Barbados (%)
Place of birth for the foreign-born population - Cuba (%)
Place of birth for the foreign-born population - Dominica (%)
Place of birth for the foreign-born population - Dominican Republic (%)
Place of birth for the foreign-born population - Grenada (%)
Place of birth for the foreign-born population - Haiti (%)
Place of birth for the foreign-born population - Jamaica (%)
Place of birth for the foreign-born population - St. Vincent and the Grenadines (%)
Place of birth for the foreign-born population - Trinidad and Tobago (%)
Place of birth for the foreign-born population - West Indies (%)
Place of birth for the foreign-born population - Other Caribbean (%)
Place of birth for the foreign-born population - Belize (%)
Place of birth for the foreign-born population - Costa Rica (%)
Place of birth for the foreign-born population - El Salvador (%)
Place of birth for the foreign-born population - Guatemala (%)
Place of birth for the foreign-born population - Honduras (%)
Place of birth for the foreign-born population - Mexico (%)
Place of birth for the foreign-born population - Nicaragua (%)
Place of birth for the foreign-born population - Panama (%)
Place of birth for the foreign-born population - Other Central America (%)
Place of birth for the foreign-born population - Argentina (%)
Place of birth for the foreign-born population - Bolivia (%)
Place of birth for the foreign-born population - Brazil (%)
Place of birth for the foreign-born population - Chile (%)
Place of birth for the foreign-born population - Colombia (%)
Place of birth for the foreign-born population - Ecuador (%)
Place of birth for the foreign-born population - Guyana (%)
Place of birth for the foreign-born population - Peru (%)
Place of birth for the foreign-born population - Uruguay (%)
Place of birth for the foreign-born population - Venezuela (%)
Place of birth for the foreign-born population - Other South America (%)
Place of birth for the foreign-born population - Canada (%)
Place of birth for the foreign-born population - Other Northern America (%)
Place of birth for the foreign-born population - Other (%)
Latest news about races in Reston, VA collected exclusively by city-data.com from local newspapers, TV, and radio stations
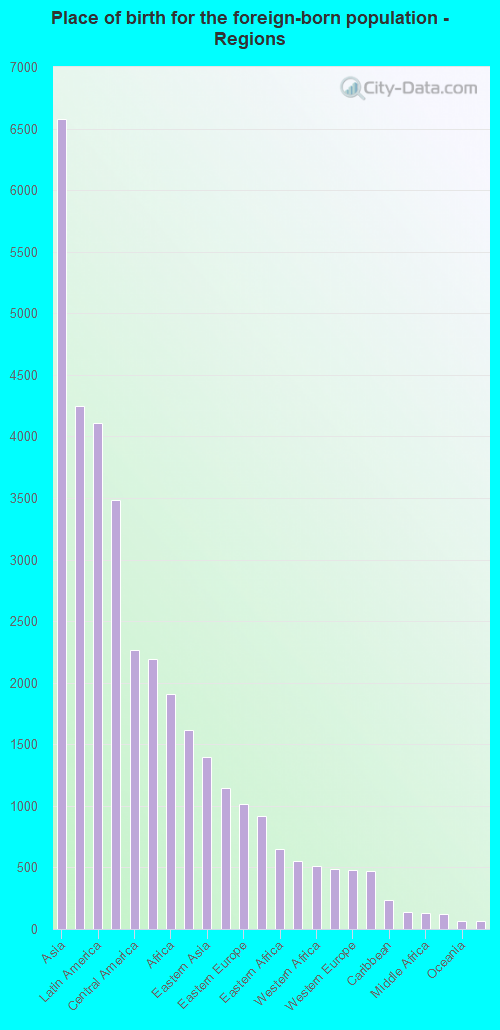
According to 2022 data, the most numerous races in Reston, VA are White alone (35,319 residents), Black alone (6,031 residents), and Hispanic (8,923 residents). 70.9% of Reston residents speak English at home. 24.2% of Reston, VA residents are foreign-born (10.6% born in Asia, 6.6% born in Latin America, 3.5% born in Europe, 3.1% born in Africa), which is 50.4% greater than the foreign-born rate of 12.0% across the entire state of Virginia.
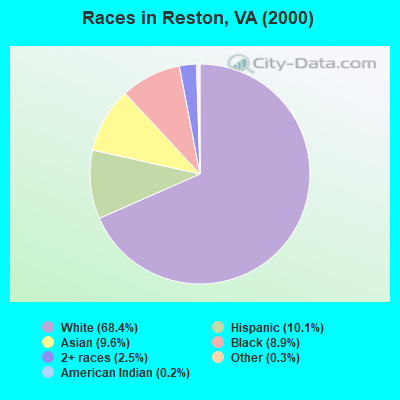
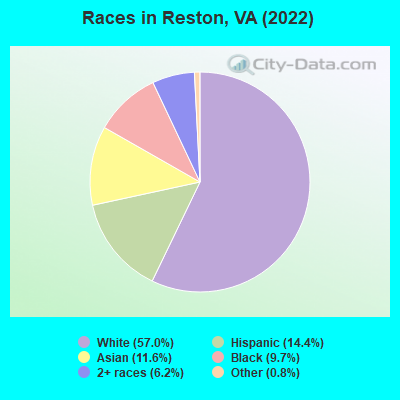
Race distribution in Reston
2000 2022
38,563 68.4% White alone 5,699 10.1% Hispanic 5,408 9.6% Asian alone 5,017 8.9% Black alone 1,411 2.5% Two or more races 187 0.3% Other race alone 102 0.2% American Indian alone 20 0.04% Native Hawaiian and Other
35,319 57.0% White alone 8,923 14.4% Hispanic 7,189 11.6% Asian alone 6,031 9.7% Black alone 3,818 6.2% Two or more races 480 0.8% Other race alone
2000 2022
4,965,637 70.2% White alone 1,376,378 19.4% Black alone 329,540 4.7% Hispanic 259,277 3.7% Asian alone 114,022 1.6% Two or more races 18,596 0.3% American Indian alone 11,685 0.2% Other race alone 3,380 0.05% Native Hawaiian and Other
5,095,130 58.7% White alone 1,594,785 18.4% Black alone 905,750 10.4% Hispanic 602,881 6.9% Asian alone 406,047 4.7% Two or more races 60,419 0.7% Other race alone 11,738 0.1% American Indian alone 6,869 0.08% Native Hawaiian and Other
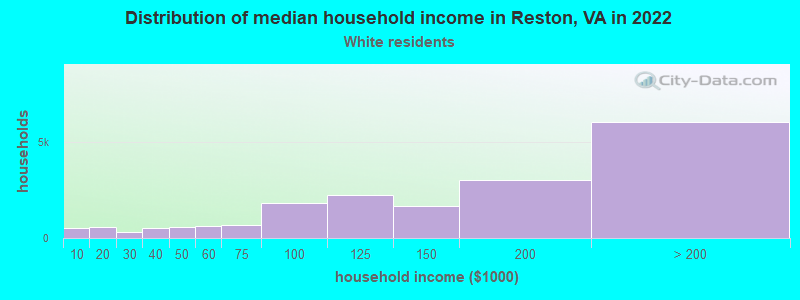
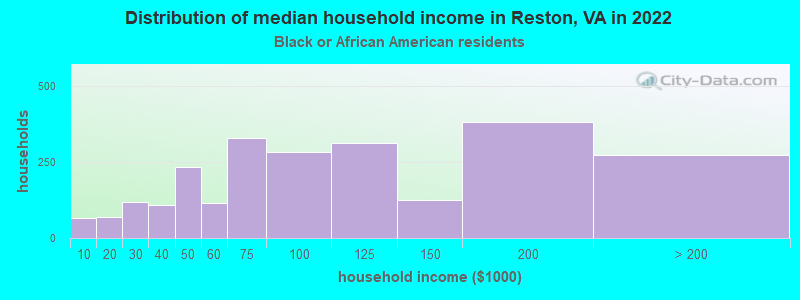
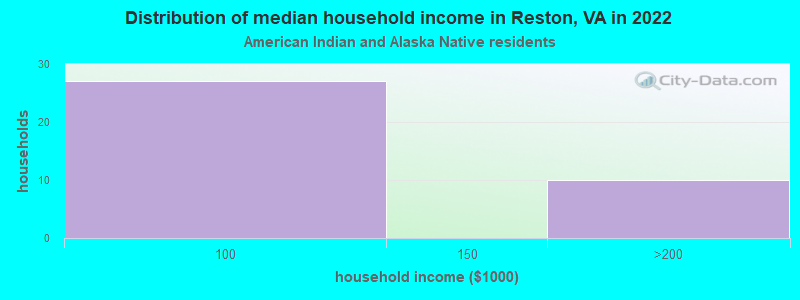
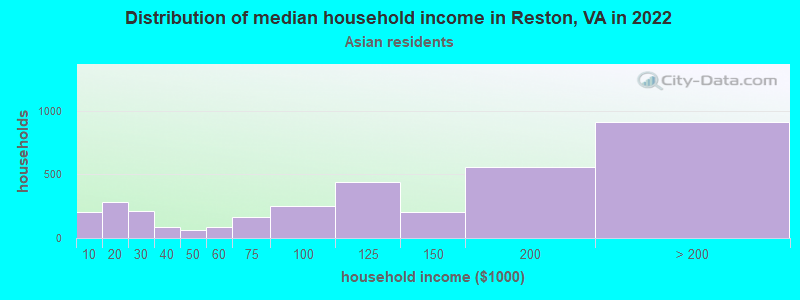
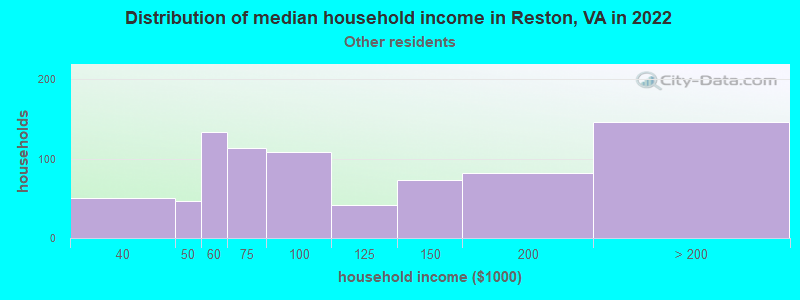
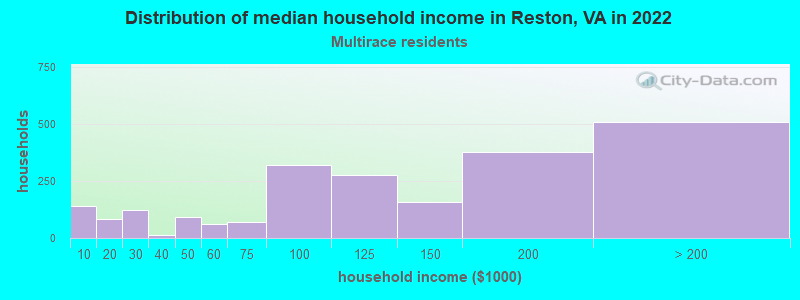
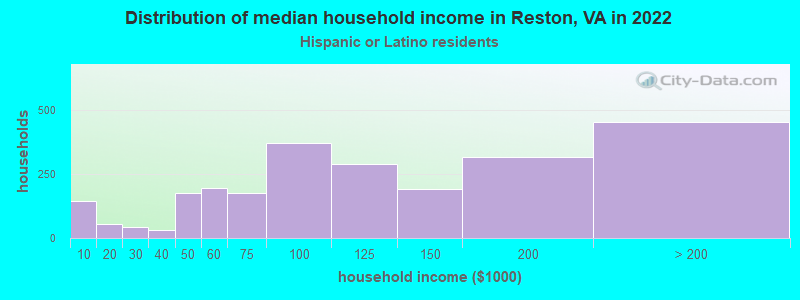
Income and house value in Reston Median household income in 2022 $147,566 White non-Hispanic householders$89,885 Black householders$119,925 Asian householders$94,951 Some other race householders$116,145 Two or more races householders$101,458 Hispanic or Latino race householdersMedian 2022 house value $740,672 White Non-Hispanic householders$539,402 Black or African American householders$760,351 American Indian or Alaska Native householders $678,651 Asian householders$395,979 Some other race householders$425,200 Two or more races householders$438,320 Hispanic or Latino householders
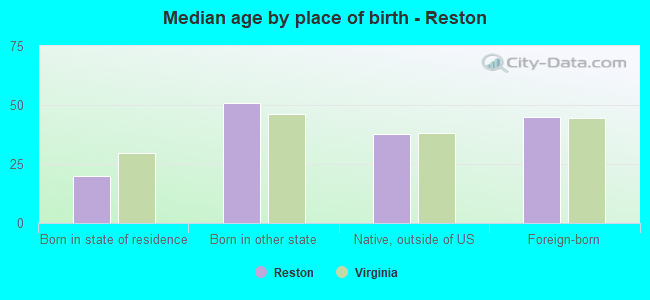
Median age by race in Reston
45.0 Median age for White residents44.6 45.4 39.4 Median age for Black or African American residents36.3 42.1 34.8 Median age for American Indian / Alaska Native residents43.4 48.3 43.4 Median age for Asian residents39.6 45.8 -666,666,666.0 Median age for Native Hawaiian / Pacific Islander residents-558,791,801.0 -584,518,166.9 32.6 Median age for Other race residents31.6 33.9 25.1 Median age for Two or more races residents25.1 26.0 46.1 Median age for White alone residents45.5 46.5 28.1 Median age for Hispanic or Latino residents27.8 28.7
Owner/renter occupied households by race in Reston
House owners and renters - White residents 12,410 66.8% Owner occupied6,180 33.2% Renter occupiedHouse owners and renters - Black or African American residents 977 39.3% Owner occupied1,510 60.7% Renter occupiedHouse owners and renters - American Indian / Alaska Native residents 12 27.5% Owner occupied31 72.5% Renter occupiedHouse owners and renters - Asian residents 1,887 54.0% Owner occupied1,606 46.0% Renter occupiedHouse owners and renters - Other race residents 441 52.8% Owner occupied395 47.2% Renter occupiedHouse owners and renters - Two or more races residents 1,191 51.9% Owner occupied1,106 48.1% Renter occupiedHouse owners and renters - White alone residents 12,523 67.6% Owner occupied6,012 32.4% Renter occupiedHouse owners and renters - Hispanic or Latino residents 1,039 41.3% Owner occupied1,479 58.7% Renter occupied
Language usage in Reston
English speakers - Total 70.9% of residents of Reston speak English at home.
10.4% of residents speak Spanish at home 3,558 58.5% Speak English very well2,529 41.5% Speak English less than very well19.0% of residents speak other language at home 8,087 72.7% Speak English very well3,036 27.3% Speak English less than very well
English speakers - Born in the United States 92.1% of residents of Reston speak English at home.
3.7% of residents speak Spanish at home 911 89.8% Speak English very well104 10.2% Speak English less than very well4.1% of residents speak other language at home 1,047 91.0% Speak English very well103 9.0% Speak English less than very well
English speakers - Native, born elsewhere 62.1% of residents of Reston speak English at home.
20.2% of residents speak Spanish at home 336 85.1% Speak English very well59 14.9% Speak English less than very well17.7% of residents speak other language at home 226 65.3% Speak English very well120 34.7% Speak English less than very well
English speakers - Foreign-born 20.4% of residents of Reston speak English at home.
24.3% of residents speak Spanish at home 1,308 36.0% Speak English very well2,321 64.0% Speak English less than very well56.1% of residents speak other language at home 5,621 67.0% Speak English very well2,770 33.0% Speak English less than very well
White (Caucasian) - Speak only English Native:
94.7% (29,320)Foreign-born:
33.9% (1,234)
White (Caucasian) - Speak another language Native:
5.7% (1,751)Foreign-born:
69.1% (2,514)
Black or African American - Speak only English Native:
86.1% (3,357)Foreign-born:
27.7% (497)
Black or African American - Speak another language Native:
14.3% (559)Foreign-born:
73.1% (1,314)
American Indian / Alaska Native - Speak another language Native:
67.1% (21)Foreign-born:
100.0% (203)
Asian - Speak only English Native:
57.5% (1,065)Foreign-born:
16.7% (877)
Asian - Speak another language Native:
41.8% (774)Foreign-born:
83.8% (4,401)
Other race - Speak only English Native:
54.1% (612)Foreign-born:
6.0% (85)
Other race - Speak another language Native:
49.2% (556)Foreign-born:
93.5% (1,330)
Two or more races - Speak only English Native:
73.5% (4,185)Foreign-born:
12.5% (257)
Two or more races - Speak another language Native:
26.5% (1,511)Foreign-born:
87.5% (1,802)
White alone - Speak only English Native:
95.6% (29,220)Foreign-born:
36.6% (1,297)
White alone - Speak another language Native:
4.5% (1,380)Foreign-born:
64.6% (2,291)
Hispanic or Latino - Speak only English Native:
45.6% (1,906)Foreign-born:
3.7% (138)
Hispanic or Latino - Speak another language Native:
54.2% (2,266)Foreign-born:
96.3% (3,634)
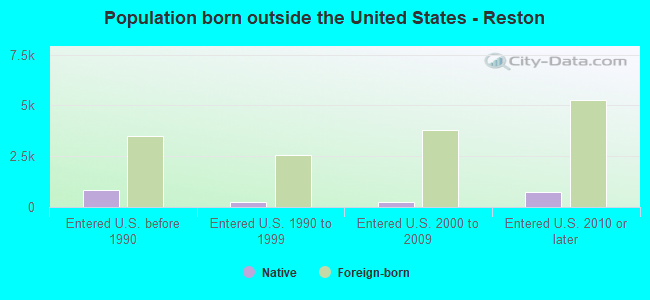
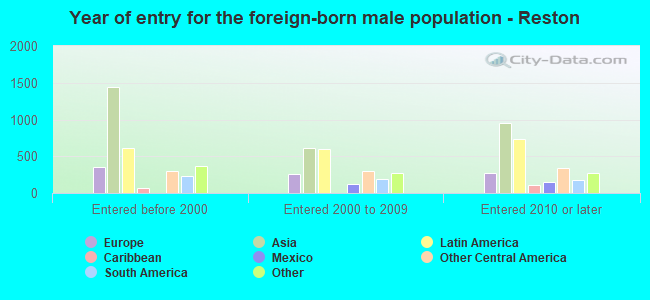
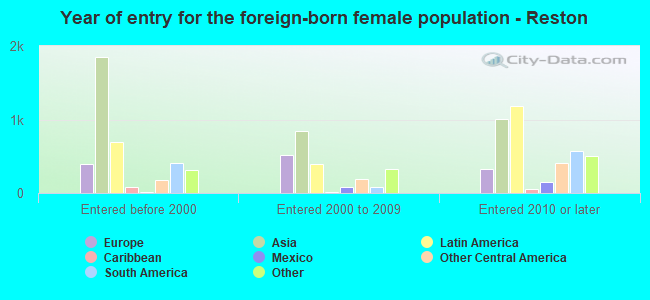
Foreign-born residents in Reston 14,994 residents are foreign born (10.6% Asia , 6.6% Latin America , 3.5% Europe , 3.1% Africa ).
This city:
24.2%Virginia:
12.6%
Marital status for residents in Reston Marital status - White (Caucasian) population 15 years and over
Males 29.8% Never married56.0% Now married1.6% Separated2.3% Widowed10.2% DivorcedFemales 29.7% Never married50.0% Now married0.8% Separated5.1% Widowed14.4% DivorcedWomen who gave birth in the past 12 months Now married:
92.6% (290)Unmarried:
7.4% (23)
Women who did not give birth in the past 12 months Now married:
45.6% (3,544)Unmarried:
54.4% (4,229)
Marital status - Black or African American population 15 years and over
Males 40.5% Never married45.4% Now married1.5% Separated1.0% Widowed11.5% DivorcedFemales 43.2% Never married28.9% Now married6.2% Separated4.6% Widowed17.1% DivorcedWomen who gave birth in the past 12 months Now married:
59.4% (41)Unmarried:
40.6% (28)
Women who did not give birth in the past 12 months Now married:
33.4% (489)Unmarried:
66.6% (975)
Marital status - American Indian / Alaska Native population 15 years and over
Males 86.6% Never married13.4% Now married0.0% Separated0.0% Widowed0.0% DivorcedFemales 28.9% Never married71.1% Now married0.0% Separated0.0% Widowed0.0% DivorcedWomen who did not give birth in the past 12 months Now married:
57.7% (32)Unmarried:
42.3% (23)
Marital status - Asian population 15 years and over
Males 32.8% Never married62.4% Now married0.5% Separated0.6% Widowed3.7% DivorcedFemales 22.2% Never married57.9% Now married0.0% Separated12.4% Widowed7.5% DivorcedWomen who gave birth in the past 12 months Now married:
100.0% (122)Unmarried:
0.0% (0)
Women who did not give birth in the past 12 months Now married:
56.1% (1,054)Unmarried:
43.9% (823)
Marital status - Other race population 15 years and over
Males 40.2% Never married51.0% Now married1.4% Separated0.9% Widowed6.6% DivorcedFemales 39.6% Never married47.2% Now married1.0% Separated0.0% Widowed12.2% DivorcedWomen who gave birth in the past 12 months Now married:
100.0% (7)Unmarried:
0.0% (0)
Women who did not give birth in the past 12 months Now married:
45.6% (347)Unmarried:
54.4% (414)
Marital status - Two or more races population 15 years and over
Males 57.3% Never married35.6% Now married1.0% Separated1.3% Widowed4.9% DivorcedFemales 43.8% Never married36.8% Now married6.8% Separated1.3% Widowed11.3% DivorcedWomen who gave birth in the past 12 months Now married:
68.2% (80)Unmarried:
31.8% (37)
Women who did not give birth in the past 12 months Now married:
42.6% (1,008)Unmarried:
57.4% (1,356)
Marital status - White alone, not Hispanic / Latino population 15 years and over
Males 28.2% Never married56.8% Now married1.7% Separated2.4% Widowed10.9% DivorcedFemales 28.2% Never married50.9% Now married0.8% Separated5.3% Widowed14.9% DivorcedWomen who gave birth in the past 12 months Now married:
96.2% (291)Unmarried:
3.8% (12)
Women who did not give birth in the past 12 months Now married:
47.5% (3,641)Unmarried:
52.5% (4,020)
Marital status - Hispanic or Latino population 15 years and over
Males 48.8% Never married45.8% Now married0.8% Separated0.9% Widowed3.7% DivorcedFemales 42.6% Never married41.8% Now married2.2% Separated2.9% Widowed10.5% DivorcedWomen who gave birth in the past 12 months Now married:
74.5% (41)Unmarried:
25.5% (14)
Women who did not give birth in the past 12 months Now married:
40.5% (893)Unmarried:
59.5% (1,310)
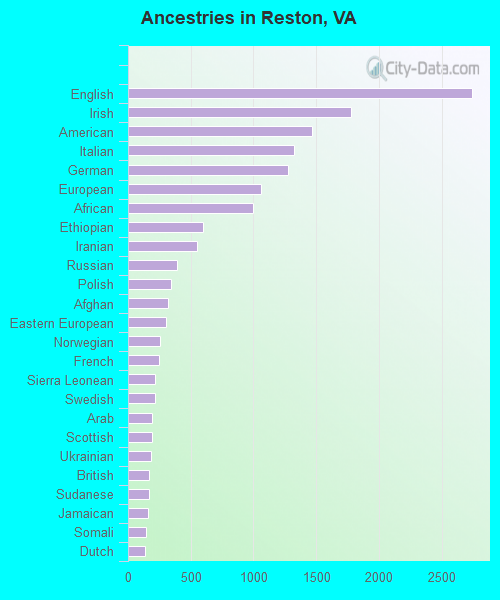
Ancestries in Reston
2,741 8.7% English1,775 5.6% Irish1,470 4.7% American1,325 4.2% Italian1,273 4.0% German1,058 3.4% European998 3.2% African601 1.9% Ethiopian551 1.7% Iranian388 1.2% Russian343 1.1% Polish315 1.0% Afghan302 1.0% Eastern European256 0.8% Norwegian246 0.8% French218 0.7% Sierra Leonean216 0.7% Swedish191 0.6% Arab188 0.6% Scottish180 0.6% Ukrainian171 0.5% British164 0.5% Sudanese156 0.5% Jamaican140 0.4% Somali134 0.4% Dutch130 0.4% West Indian103 0.3% Romanian98 0.3% Greek97 0.3% Moroccan90 0.3% Scotch-Irish83 0.3% Czech75 0.2% Northern European74 0.2% Brazilian72 0.2% French Canadian71 0.2% Egyptian71 0.2% Turkish60 0.2% Kenyan57 0.2% Austrian56 0.2% Hungarian55 0.2% Palestinian51 0.2% Ghanaian47 0.1% Iraqi44 0.1% Scandinavian43 0.1% Lebanese36 0.1% Finnish34 0.1% Portuguese33 0.1% Bulgarian30 0.10% New Zealander26 0.08% Slovak25 0.08% Belgian22 0.07% Lithuanian20 0.06% Croatian19 0.06% Swiss18 0.06% Danish18 0.06% Armenian17 0.05% Estonian17 0.05% Welsh17 0.05% Serbian13 0.04% Syrian12 0.04% Jordanian11 0.03% British West Indian9 0.03% Haitian8 0.03% Barbadian7 0.02% Canadian7 0.02% Slovene
Geographical mobility in Reston Same house 1 year ago 29,385 82.5% White (Caucasian)4,982 82.7% Black or African American124 79.3% American Indian / Alaska Native5,516 76.0% Asian2 95.3% Native Hawaiian / Pacific Islander2,232 81.5% Other race6,234 69.9% Two or more races28,905 82.4% White alone, not Hispanic / Latino6,753 76.1% Hispanic or LatinoMoved within same county 2,487 7.0% White / Caucasian380 6.3% Black or African American21 13.2% American Indian / Alaska Native450 6.2% Asian122 4.5% Other race963 10.8% Two or more races2,633 7.5% White alone, not Hispanic / Latino656 7.4% Hispanic or LatinoMoved within same state 1,667 4.7% White / Caucasian220 3.6% Black or African American368 5.1% Asian177 6.5% Other race563 6.3% Two or more races1,607 4.6% White alone, not Hispanic / Latino526 5.9% Hispanic or LatinoMoved from different state 1,984 5.6% White / Caucasian317 5.3% Black or African American15 9.5% American Indian / Alaska Native591 8.1% Asian64 2.3% Other race950 10.7% Two or more races1,789 5.1% White alone, not Hispanic / Latino813 9.2% Hispanic or LatinoMoved from abroad 193 0.5% White31 0.5% Black or African American343 4.7% Asian112 4.1% Other race368 4.1% Two or more races205 0.6% White alone, not Hispanic / Latino272 3.1% Hispanic or Latino
Children Nativity (place of birth) in Reston
Children under 6 years - Living with two parents Both parents native 1,805 100.0% NativeBoth parents foreign-born 1,051 96.8% Native35 3.2% Foreign-bornOne native, one foreign-born parent 541 100.0% NativeChildren under 6 years - Living with one parent Native parent 224 100.0% NativeForeign-born parent 220 82.7% Native46 17.3% Foreign-bornChildren 6 to 17 years - Living with two parents Both parents native 3,137 95.9% Native134 4.1% Foreign-bornBoth parents foreign-born 1,117 81.1% Native260 18.9% Foreign-bornOne native, one foreign-born parent 655 88.7% Native83 11.3% Foreign-bornChildren 6 to 17 years - Living with one parent Native parent 903 100.0% NativeForeign-born parent 986 56.2% Native768 43.8% Foreign-born
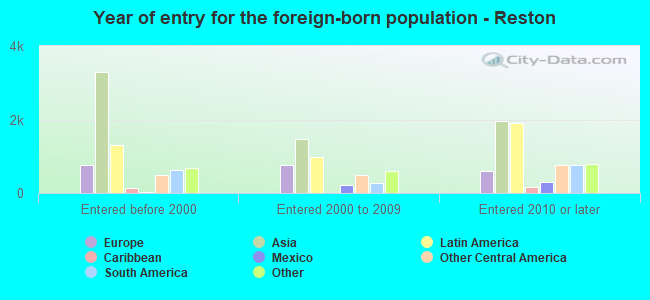
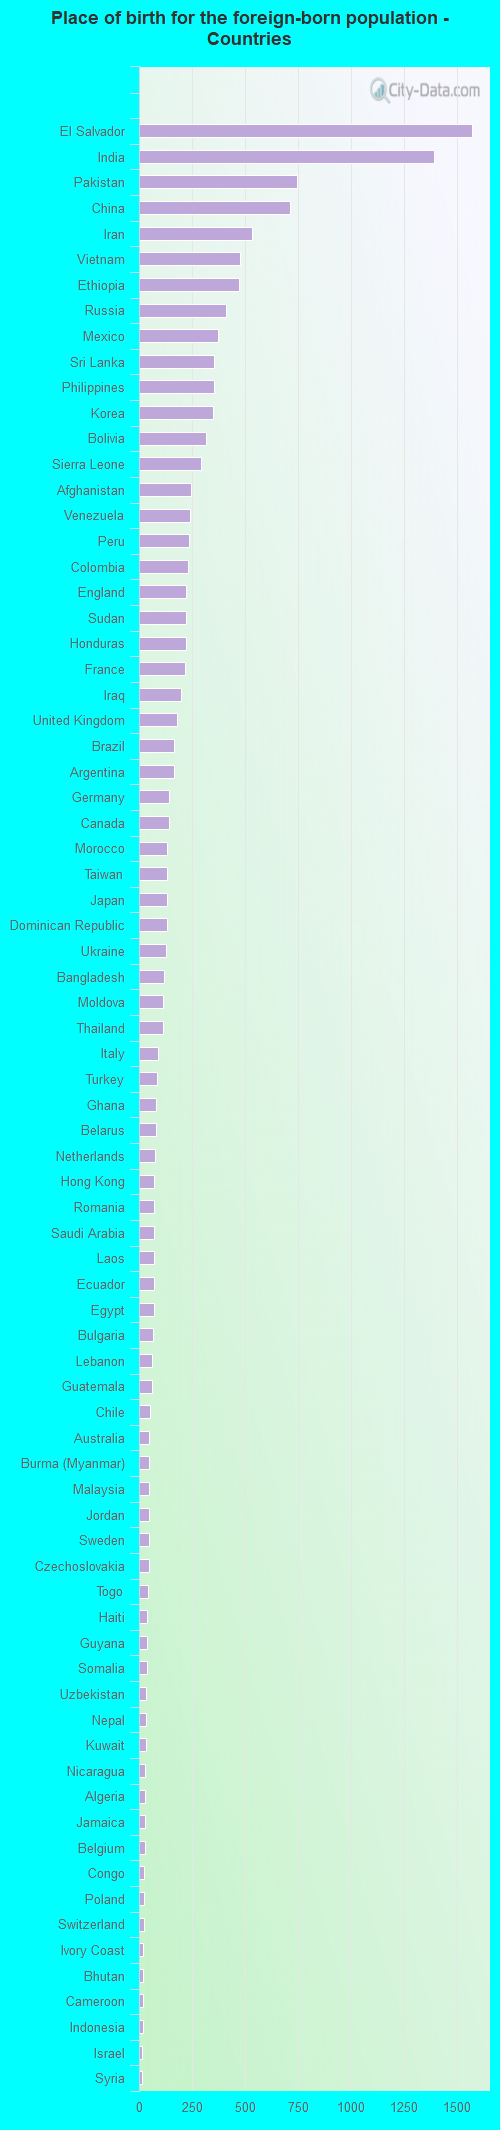
Place of birth for residents in Reston 6,574 Asia4,251 Americas4,111 Latin America3,480 South Central Asia2,266 Central America2,191 Europe1,906 Africa1,612 South America1,400 Eastern Asia1,143 South Eastern Asia1,012 Eastern Europe919 China653 Eastern Africa550 Western Asia508 Western Africa491 Northern Europe483 Western Europe469 Northern Africa232 Caribbean140 Northern America129 Middle Africa121 Southern Europe69 Oceania62 Australia and New Zealand Subregion4 Southern Africa1,574 El Salvador1,392 India746 Pakistan711 China532 Iran478 Vietnam472 Ethiopia413 Russia371 Mexico356 Sri Lanka353 Philippines348 Korea315 Bolivia294 Sierra Leone244 Afghanistan243 Venezuela234 Peru231 Colombia224 England223 Sudan221 Honduras216 France196 Iraq181 United Kingdom167 Brazil163 Argentina143 Germany140 Canada133 Morocco133 Taiwan133 Japan130 Dominican Republic128 Ukraine116 Bangladesh112 Moldova111 Thailand91 Italy86 Turkey81 Ghana78 Belarus74 Netherlands73 Hong Kong72 Romania70 Saudi Arabia70 Laos70 Ecuador70 Egypt65 Bulgaria62 Lebanon61 Guatemala54 Chile48 Australia48 Burma (Myanmar)48 Malaysia48 Jordan47 Sweden45 Czechoslovakia42 Togo40 Haiti37 Guyana37 Somalia34 Uzbekistan33 Nepal32 Kuwait28 Nicaragua28 Algeria26 Jamaica26 Belgium24 Congo22 Poland22 Switzerland21 Ivory Coast21 Bhutan19 Cameroon18 Indonesia16 Israel16 Syria14 Lithuania14 Kenya14 Nigeria13 Yemen13 New Zealand12 Norway11 Greece9 Hungary9 Portugal9 Serbia9 Uruguay8 Eritrea8 Trinidad and Tobago8 Panama8 Denmark7 Spain7 Ireland6 Marshall Islands6 Singapore4 Barbados4 South Africa4 Cambodia3 Cuba
Grandparents responsible for own grandchildren in Reston
Grandparents (30 to 59 years) White / Caucasian 2 36.2% Responsible for grandchildren4 63.8% Not responsible for grandchildrenBlack or African American 51 100.0% Responsible for grandchildrenWhite alone, not Hispanic / Latino 5 100.0% Responsible for grandchildrenHispanic or Latino 7 100.0% Not responsible for grandchildrenGrandparents (60 years and over) White / Caucasian 76 46.7% Responsible for grandchildren87 53.3% Not responsible for grandchildrenBlack or African American 6 5.6% Responsible for grandchildren97 94.4% Not responsible for grandchildrenWhite alone, not Hispanic / Latino 83 51.3% Responsible for grandchildren79 48.7% Not responsible for grandchildrenHispanic or Latino 151 100.0% Not responsible for grandchildren