Races in Richmond Hill, Georgia (GA) Detailed Stats
Data:
Races - White alone (%)
Races - White alone (% change since 2000)
Races - Black alone (%)
Races - Black alone (% change since 2000)
Races - American Indian alone (%)
Races - American Indian alone (% change since 2000)
Races - Asian alone (%)
Races - Asian alone (% change since 2000)
Races - Hispanic (%)
Races - Hispanic (% change since 2000)
Races - Native Hawaiian and Other Pacific Islander alone (%)
Races - Native Hawaiian and Other Pacific Islander alone (% change since 2000)
Races - Two or more races(%)
Races - Two or more races(% change since 2000)
Races - Other race alone (%)
Races - Other race alone (% change since 2000)
Racial diversity
Place of birth - Born in state of residence (%)
Place of birth - Born in state of residence (%) - White
Place of birth - Born in state of residence (%) - Black or African American
Place of birth - Born in state of residence (%) - Asian
Place of birth - Born in state of residence (%) - Hispanic or Latino
Place of birth - Born in state of residence (%) - American Indian and Alaska Native
Place of birth - Born in state of residence (%) - Multirace
Place of birth - Born in state of residence (%) - Other Race
Place of birth - Born in other state (%)
Place of birth - Born in other state (%) - White
Place of birth - Born in other state (%) - Black or African American
Place of birth - Born in other state (%) - Asian
Place of birth - Born in other state (%) - Hispanic or Latino
Place of birth - Born in other state (%) - American Indian and Alaska Native
Place of birth - Born in other state (%) - Multirace
Place of birth - Born in other state (%) - Other Race
Place of birth - Native, outside of US (%)
Place of birth - Native, outside of US (%) - White
Place of birth - Native, outside of US (%) - Black or African American
Place of birth - Native, outside of US (%) - Asian
Place of birth - Native, outside of US (%) - Hispanic or Latino
Place of birth - Native, outside of US (%) - American Indian and Alaska Native
Place of birth - Native, outside of US (%) - Multirace
Place of birth - Native, outside of US (%) - Other Race
Place of birth - Foreign born (%)
Place of birth - Foreign born (%) - White
Place of birth - Foreign born (%) - Black or African American
Place of birth - Foreign born (%) - Asian
Place of birth - Foreign born (%) - Hispanic or Latino
Place of birth - Foreign born (%) - American Indian and Alaska Native
Place of birth - Foreign born (%) - Multirace
Place of birth - Foreign born (%) - Other Race
Residents speaking English at home (%)
Residents speaking English at home - Born in the United States (%)
Residents speaking English at home - Native, born elsewhere (%)
Residents speaking English at home - Foreign born (%)
Residents speaking Spanish at home (%)
Residents speaking Spanish at home - Born in the United States (%)
Residents speaking Spanish at home - Native, born elsewhere (%)
Residents speaking Spanish at home - Foreign born (%)
Residents speaking other language at home (%)
Residents speaking other language at home - Born in the United States (%)
Residents speaking other language at home - Native, born elsewhere (%)
Residents speaking other language at home - Foreign born (%)
Marital status - Never married (%)
Marital status - Now married (%)
Marital status - Separated (%)
Marital status - Widowed (%)
Marital status - Divorced (%)
Ancestries Reported - Arab (%)
Ancestries Reported - Czech (%)
Ancestries Reported - Danish (%)
Ancestries Reported - Dutch (%)
Ancestries Reported - English (%)
Ancestries Reported - French (%)
Ancestries Reported - French Canadian (%)
Ancestries Reported - German (%)
Ancestries Reported - Greek (%)
Ancestries Reported - Hungarian (%)
Ancestries Reported - Irish (%)
Ancestries Reported - Italian (%)
Ancestries Reported - Lithuanian (%)
Ancestries Reported - Norwegian (%)
Ancestries Reported - Polish (%)
Ancestries Reported - Portuguese (%)
Ancestries Reported - Russian (%)
Ancestries Reported - Scotch-Irish (%)
Ancestries Reported - Scottish (%)
Ancestries Reported - Slovak (%)
Ancestries Reported - Subsaharan African (%)
Ancestries Reported - Swedish (%)
Ancestries Reported - Swiss (%)
Ancestries Reported - Ukrainian (%)
Ancestries Reported - United States (%)
Ancestries Reported - Welsh (%)
Ancestries Reported - West Indian (%)
Ancestries Reported - Other (%)
Geographical mobility - Same house 1 year ago (%)
Geographical mobility - Same house 1 year ago (%) - White
Geographical mobility - Same house 1 year ago (%) - Black or African American
Geographical mobility - Same house 1 year ago (%) - Asian
Geographical mobility - Same house 1 year ago (%) - Hispanic or Latino
Geographical mobility - Same house 1 year ago (%) - American Indian and Alaska Native
Geographical mobility - Same house 1 year ago (%) - Multirace
Geographical mobility - Same house 1 year ago (%) - Other Race
Geographical mobility - Moved within same county (%)
Geographical mobility - Moved within same county (%) - White
Geographical mobility - Moved within same county (%) - Black or African American
Geographical mobility - Moved within same county (%) - Asian
Geographical mobility - Moved within same county (%) - Hispanic or Latino
Geographical mobility - Moved within same county (%) - American Indian and Alaska Native
Geographical mobility - Moved within same county (%) - Multirace
Geographical mobility - Moved within same county (%) - Other Race
Geographical mobility - Moved from different county within same state (%)
Geographical mobility - Moved from different county within same state (%) - White
Geographical mobility - Moved from different county within same state (%) - Black or African American
Geographical mobility - Moved from different county within same state (%) - Asian
Geographical mobility - Moved from different county within same state (%) - Hispanic or Latino
Geographical mobility - Moved from different county within same state (%) - American Indian and Alaska Native
Geographical mobility - Moved from different county within same state (%) - Multirace
Geographical mobility - Moved from different county within same state (%) - Other Race
Geographical mobility - Moved from different state (%)
Geographical mobility - Moved from different state (%) - White
Geographical mobility - Moved from different state (%) - Black or African American
Geographical mobility - Moved from different state (%) - Asian
Geographical mobility - Moved from different state (%) - Hispanic or Latino
Geographical mobility - Moved from different state (%) - American Indian and Alaska Native
Geographical mobility - Moved from different state (%) - Multirace
Geographical mobility - Moved from different state (%) - Other Race
Geographical mobility - Moved from abroad (%)
Geographical mobility - Moved from abroad (%) - White
Geographical mobility - Moved from abroad (%) - Black or African American
Geographical mobility - Moved from abroad (%) - Asian
Geographical mobility - Moved from abroad (%) - Hispanic or Latino
Geographical mobility - Moved from abroad (%) - American Indian and Alaska Native
Geographical mobility - Moved from abroad (%) - Multirace
Geographical mobility - Moved from abroad (%) - Other Race
Place of birth for the foreign-born population - Ireland (%)
Place of birth for the foreign-born population - Denmark (%)
Place of birth for the foreign-born population - Norway (%)
Place of birth for the foreign-born population - Sweden (%)
Place of birth for the foreign-born population - United Kingdom (%)
Place of birth for the foreign-born population - England (%)
Place of birth for the foreign-born population - Scotland (%)
Place of birth for the foreign-born population - Other Northern Europe (%)
Place of birth for the foreign-born population - Austria (%)
Place of birth for the foreign-born population - Belgium (%)
Place of birth for the foreign-born population - France (%)
Place of birth for the foreign-born population - Germany (%)
Place of birth for the foreign-born population - Netherlands (%)
Place of birth for the foreign-born population - Switzerland (%)
Place of birth for the foreign-born population - Other Western Europe (%)
Place of birth for the foreign-born population - Greece (%)
Place of birth for the foreign-born population - Italy (%)
Place of birth for the foreign-born population - Portugal (%)
Place of birth for the foreign-born population - Spain (%)
Place of birth for the foreign-born population - Other Southern Europe (%)
Place of birth for the foreign-born population - Albania (%)
Place of birth for the foreign-born population - Belarus (%)
Place of birth for the foreign-born population - Bosnia and Herzegovina (%)
Place of birth for the foreign-born population - Bulgaria (%)
Place of birth for the foreign-born population - Croatia (%)
Place of birth for the foreign-born population - Czechoslovakia (%)
Place of birth for the foreign-born population - Hungary (%)
Place of birth for the foreign-born population - Latvia (%)
Place of birth for the foreign-born population - Lithuania (%)
Place of birth for the foreign-born population - North Macedonia (Macedonia) (%)
Place of birth for the foreign-born population - Moldova (%)
Place of birth for the foreign-born population - Poland (%)
Place of birth for the foreign-born population - Romania (%)
Place of birth for the foreign-born population - Russia (%)
Place of birth for the foreign-born population - Serbia (%)
Place of birth for the foreign-born population - Ukraine (%)
Place of birth for the foreign-born population - Other Eastern Europe (%)
Place of birth for the foreign-born population - China (%)
Place of birth for the foreign-born population - Hong Kong (%)
Place of birth for the foreign-born population - Taiwan (%)
Place of birth for the foreign-born population - Japan (%)
Place of birth for the foreign-born population - Korea (%)
Place of birth for the foreign-born population - Other Eastern Asia (%)
Place of birth for the foreign-born population - Afghanistan (%)
Place of birth for the foreign-born population - Bangladesh (%)
Place of birth for the foreign-born population - India (%)
Place of birth for the foreign-born population - Iran (%)
Place of birth for the foreign-born population - Kazakhstan (%)
Place of birth for the foreign-born population - Nepal (%)
Place of birth for the foreign-born population - Pakistan (%)
Place of birth for the foreign-born population - Sri Lanka (%)
Place of birth for the foreign-born population - Uzbekistan (%)
Place of birth for the foreign-born population - Other South Central Asia (%)
Place of birth for the foreign-born population - Burma (%)
Place of birth for the foreign-born population - Cambodia (%)
Place of birth for the foreign-born population - Indonesia (%)
Place of birth for the foreign-born population - Laos (%)
Place of birth for the foreign-born population - Malaysia (%)
Place of birth for the foreign-born population - Philippines (%)
Place of birth for the foreign-born population - Singapore (%)
Place of birth for the foreign-born population - Thailand (%)
Place of birth for the foreign-born population - Vietnam (%)
Place of birth for the foreign-born population - Other South Eastern Asia (%)
Place of birth for the foreign-born population - Armenia (%)
Place of birth for the foreign-born population - Iraq (%)
Place of birth for the foreign-born population - Israel (%)
Place of birth for the foreign-born population - Jordan (%)
Place of birth for the foreign-born population - Kuwait (%)
Place of birth for the foreign-born population - Lebanon (%)
Place of birth for the foreign-born population - Saudi Arabia (%)
Place of birth for the foreign-born population - Syria (%)
Place of birth for the foreign-born population - Turkey (%)
Place of birth for the foreign-born population - Yemen (%)
Place of birth for the foreign-born population - Other Western Asia (%)
Place of birth for the foreign-born population - Eritrea (%)
Place of birth for the foreign-born population - Ethiopia (%)
Place of birth for the foreign-born population - Kenya (%)
Place of birth for the foreign-born population - Somalia (%)
Place of birth for the foreign-born population - Uganda (%)
Place of birth for the foreign-born population - Zimbabwe (%)
Place of birth for the foreign-born population - Other Eastern Africa (%)
Place of birth for the foreign-born population - Cameroon (%)
Place of birth for the foreign-born population - Congo (%)
Place of birth for the foreign-born population - Democratic Republic of Congo (Zaire) (%)
Place of birth for the foreign-born population - Other Middle Africa (%)
Place of birth for the foreign-born population - Egypt (%)
Place of birth for the foreign-born population - Morocco (%)
Place of birth for the foreign-born population - Sudan (%)
Place of birth for the foreign-born population - Other Northern Africa (%)
Place of birth for the foreign-born population - South Africa (%)
Place of birth for the foreign-born population - Other Southern Africa (%)
Place of birth for the foreign-born population - Cabo Verde (%)
Place of birth for the foreign-born population - Ghana (%)
Place of birth for the foreign-born population - Liberia (%)
Place of birth for the foreign-born population - Nigeria (%)
Place of birth for the foreign-born population - Senegal (%)
Place of birth for the foreign-born population - Sierra Leone (%)
Place of birth for the foreign-born population - Other Western Africa (%)
Place of birth for the foreign-born population - Australia (%)
Place of birth for the foreign-born population - New Zealand (%)
Place of birth for the foreign-born population - Fiji (%)
Place of birth for the foreign-born population - Micronesia (%)
Place of birth for the foreign-born population - Bahamas (%)
Place of birth for the foreign-born population - Barbados (%)
Place of birth for the foreign-born population - Cuba (%)
Place of birth for the foreign-born population - Dominica (%)
Place of birth for the foreign-born population - Dominican Republic (%)
Place of birth for the foreign-born population - Grenada (%)
Place of birth for the foreign-born population - Haiti (%)
Place of birth for the foreign-born population - Jamaica (%)
Place of birth for the foreign-born population - St. Vincent and the Grenadines (%)
Place of birth for the foreign-born population - Trinidad and Tobago (%)
Place of birth for the foreign-born population - West Indies (%)
Place of birth for the foreign-born population - Other Caribbean (%)
Place of birth for the foreign-born population - Belize (%)
Place of birth for the foreign-born population - Costa Rica (%)
Place of birth for the foreign-born population - El Salvador (%)
Place of birth for the foreign-born population - Guatemala (%)
Place of birth for the foreign-born population - Honduras (%)
Place of birth for the foreign-born population - Mexico (%)
Place of birth for the foreign-born population - Nicaragua (%)
Place of birth for the foreign-born population - Panama (%)
Place of birth for the foreign-born population - Other Central America (%)
Place of birth for the foreign-born population - Argentina (%)
Place of birth for the foreign-born population - Bolivia (%)
Place of birth for the foreign-born population - Brazil (%)
Place of birth for the foreign-born population - Chile (%)
Place of birth for the foreign-born population - Colombia (%)
Place of birth for the foreign-born population - Ecuador (%)
Place of birth for the foreign-born population - Guyana (%)
Place of birth for the foreign-born population - Peru (%)
Place of birth for the foreign-born population - Uruguay (%)
Place of birth for the foreign-born population - Venezuela (%)
Place of birth for the foreign-born population - Other South America (%)
Place of birth for the foreign-born population - Canada (%)
Place of birth for the foreign-born population - Other Northern America (%)
Place of birth for the foreign-born population - Other (%)
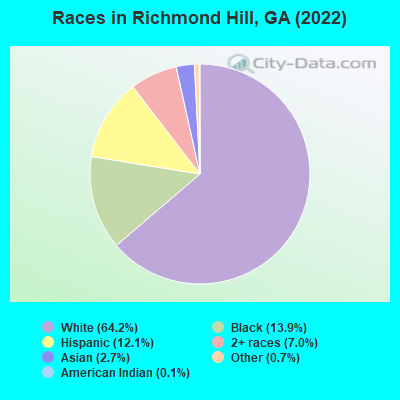
According to 2022 data, the most numerous races in Richmond Hill, GA are White alone (10,915 residents), Black alone (2,360 residents), and Hispanic (2,052 residents). 86.1% of Richmond Hill residents speak English at home. 5.4% of Richmond Hill, GA residents are foreign-born (2.6% born in Latin America, 1.6% born in Asia, 0.6% born in Europe), which is 86.2% less than the foreign-born rate of 10.0% across the entire state of Georgia.
Race distribution in Richmond Hill
2000 2022
5,128,661 62.6% White alone 2,331,465 28.5% Black alone 435,227 5.3% Hispanic 171,513 2.1% Asian alone 87,364 1.1% Two or more races 17,670 0.2% American Indian alone 11,275 0.1% Other race alone 3,278 0.04% Native Hawaiian and Other
5,415,657 49.6% White alone 3,349,240 30.7% Black alone 1,132,604 10.4% Hispanic 479,156 4.4% Asian alone 462,923 4.2% Two or more races 54,416 0.5% Other race alone 11,923 0.1% American Indian alone 6,957 0.06% Native Hawaiian and Other
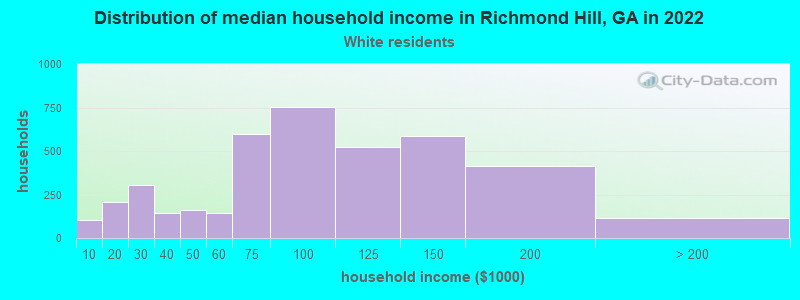
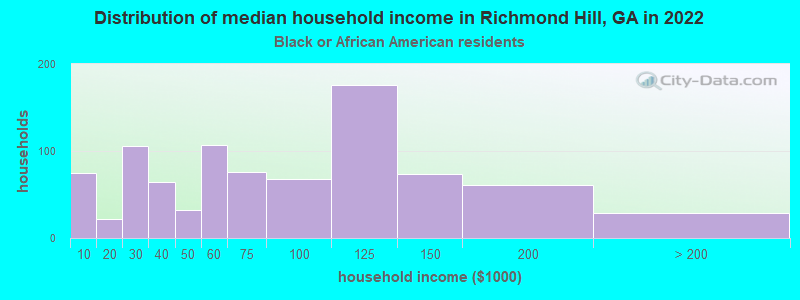
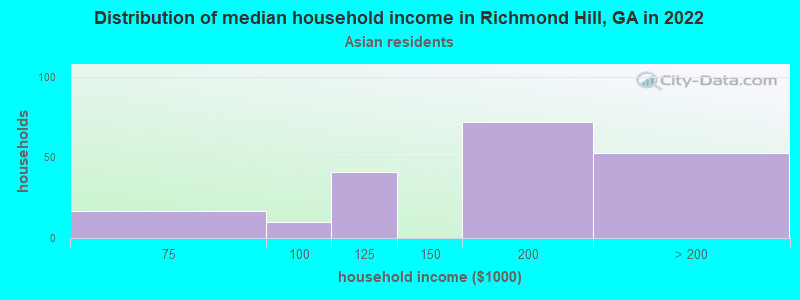
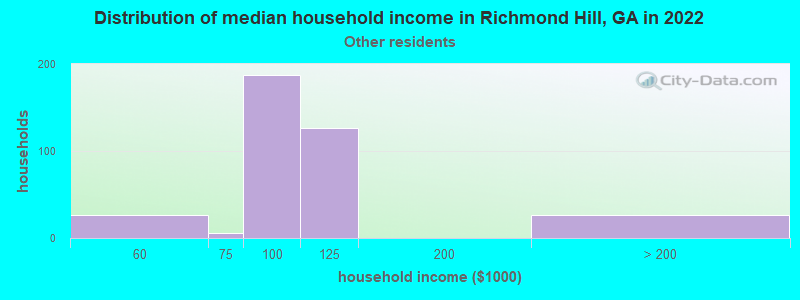
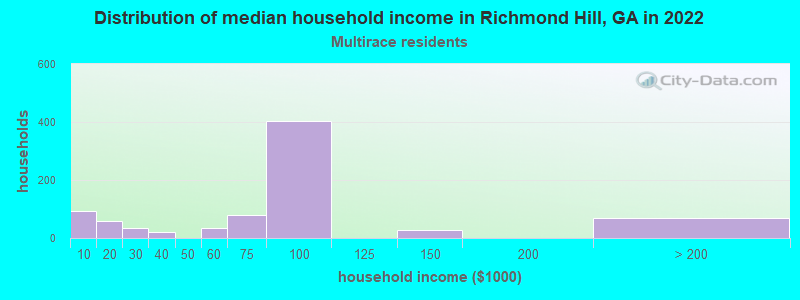
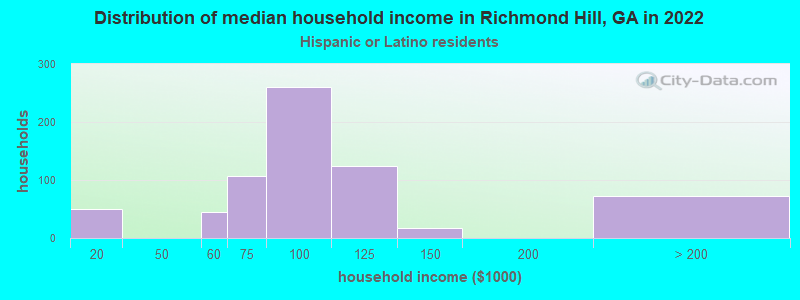
Income and house value in Richmond Hill Median household income in 2022 $88,639 White non-Hispanic householders$73,398 Black householders$178,683 Asian householders$91,632 Some other race householders$79,038 Two or more races householders$88,385 Hispanic or Latino race householdersMedian 2022 house value $296,987 White Non-Hispanic householders$270,071 Black or African American householders$356,935 American Indian or Alaska Native householders $545,648 Asian householders$420,553 Two or more races householders$275,271 Hispanic or Latino householders
Median age by race in Richmond Hill
31.8 Median age for White residents31.1 32.7 32.3 Median age for Black or African American residents28.9 38.4 -597,462,513.8 Median age for American Indian / Alaska Native residents-597,222,221.6 -597,938,143.7 32.6 Median age for Asian residents25.6 34.4 -657,243,815.6 Median age for Native Hawaiian / Pacific Islander residents-693,227,090.9 -776,776,776.0 35.2 Median age for Other race residents30.8 35.4 29.0 Median age for Two or more races residents17.5 29.2 31.6 Median age for White alone residents30.9 32.5 29.1 Median age for Hispanic or Latino residents28.9 25.8
Owner/renter occupied households by race in Richmond Hill
House owners and renters - White residents 2,610 65.0% Owner occupied1,407 35.0% Renter occupiedHouse owners and renters - Black or African American residents 491 54.5% Owner occupied410 45.5% Renter occupiedHouse owners and renters - American Indian / Alaska Native residents 21 100.0% Renter occupiedHouse owners and renters - Asian residents 95 52.1% Owner occupied87 47.9% Renter occupiedHouse owners and renters - Other race residents 266 74.4% Owner occupied92 25.6% Renter occupiedHouse owners and renters - Two or more races residents 509 65.1% Owner occupied272 34.9% Renter occupiedHouse owners and renters - White alone residents 2,583 64.2% Owner occupied1,438 35.8% Renter occupiedHouse owners and renters - Hispanic or Latino residents 432 67.1% Owner occupied211 32.9% Renter occupied
Language usage in Richmond Hill
English speakers - Total 86.1% of residents of Richmond Hill speak English at home.
8.5% of residents speak Spanish at home 978 74.2% Speak English very well340 25.8% Speak English less than very well5.3% of residents speak other language at home 559 68.1% Speak English very well262 31.9% Speak English less than very well
English speakers - Born in the United States 91.7% of residents of Richmond Hill speak English at home.
4.1% of residents speak Spanish at home 320 98.5% Speak English very well5 1.5% Speak English less than very well4.3% of residents speak other language at home 256 74.2% Speak English very well89 25.8% Speak English less than very well
English speakers - Native, born elsewhere 30.3% of residents of Richmond Hill speak English at home.
70.6% of residents speak Spanish at home 378 61.9% Speak English very well233 38.1% Speak English less than very well
English speakers - Foreign-born 33.1% of residents of Richmond Hill speak English at home.
25.7% of residents speak Spanish at home 125 53.2% Speak English very well110 46.8% Speak English less than very well41.3% of residents speak other language at home 253 67.1% Speak English very well124 32.9% Speak English less than very well
White (Caucasian) - Speak only English Native:
97.3% (9,664)Foreign-born:
75.3% (45)
White (Caucasian) - Speak another language Native:
2.7% (271)Foreign-born:
39.1% (23)
Black or African American - Speak only English Native:
99.8% (1,873)Foreign-born:
60.0% (172)
Asian - Speak only English Native:
46.7% (82)Foreign-born:
25.6% (61)
Asian - Speak another language Native:
53.2% (94)Foreign-born:
72.8% (175)
Other race - Speak another language Native:
81.6% (933)Foreign-born:
99.0% (282)
Two or more races - Speak only English Native:
78.9% (1,360)Foreign-born:
18.9% (19)
Two or more races - Speak another language Native:
21.2% (366)Foreign-born:
81.3% (80)
White alone - Speak only English Native:
97.8% (9,562)Foreign-born:
73.7% (50)
White alone - Speak another language Native:
2.2% (217)Foreign-born:
26.6% (18)
Hispanic or Latino - Speak another language Native:
66.9% (1,118)Foreign-born:
99.8% (271)
Foreign-born residents in Richmond Hill 913 residents are foreign born (2.6% Latin America , 1.6% Asia , 0.6% Europe ).
This city:
5.4%Georgia:
10.4%
Marital status for residents in Richmond Hill Marital status - White (Caucasian) population 15 years and over
Males 22.7% Never married57.0% Now married2.3% Separated1.8% Widowed16.2% DivorcedFemales 26.3% Never married50.0% Now married3.5% Separated6.4% Widowed13.8% DivorcedWomen who gave birth in the past 12 months Now married:
72.2% (205)Unmarried:
27.8% (79)
Women who did not give birth in the past 12 months Now married:
51.4% (1,414)Unmarried:
48.6% (1,338)
Marital status - Black or African American population 15 years and over
Males 34.9% Never married45.6% Now married4.2% Separated0.4% Widowed14.9% DivorcedFemales 32.3% Never married45.3% Now married0.0% Separated4.9% Widowed17.5% DivorcedWomen who gave birth in the past 12 months Now married:
100.0% (34)Unmarried:
0.0% (0)
Women who did not give birth in the past 12 months Now married:
46.3% (307)Unmarried:
53.7% (356)
Marital status - Asian population 15 years and over
Males 40.0% Never married60.0% Now married0.0% Separated0.0% Widowed0.0% DivorcedFemales 22.8% Never married77.2% Now married0.0% Separated0.0% Widowed0.0% DivorcedWomen who did not give birth in the past 12 months Now married:
74.2% (137)Unmarried:
25.8% (48)
Marital status - Other race population 15 years and over
Males 46.8% Never married53.2% Now married0.0% Separated0.0% Widowed0.0% DivorcedFemales 27.6% Never married61.1% Now married7.1% Separated0.0% Widowed4.2% DivorcedWomen who did not give birth in the past 12 months Now married:
70.8% (329)Unmarried:
29.2% (136)
Marital status - Two or more races population 15 years and over
Males 18.2% Never married55.0% Now married2.9% Separated0.0% Widowed23.9% DivorcedFemales 25.4% Never married31.4% Now married0.0% Separated0.0% Widowed43.2% DivorcedWomen who did not give birth in the past 12 months Now married:
48.1% (241)Unmarried:
51.9% (261)
Marital status - White alone, not Hispanic / Latino population 15 years and over
Males 22.4% Never married57.0% Now married2.4% Separated1.8% Widowed16.4% DivorcedFemales 26.0% Never married49.7% Now married3.6% Separated6.7% Widowed14.0% DivorcedWomen who gave birth in the past 12 months Now married:
72.2% (213)Unmarried:
27.8% (82)
Women who did not give birth in the past 12 months Now married:
51.0% (1,372)Unmarried:
49.0% (1,319)
Marital status - Hispanic or Latino population 15 years and over
Males 34.0% Never married54.6% Now married1.5% Separated0.0% Widowed10.0% DivorcedFemales 32.1% Never married54.3% Now married3.9% Separated0.0% Widowed9.7% DivorcedWomen who did not give birth in the past 12 months Now married:
59.0% (414)Unmarried:
41.0% (288)
Ancestries in Richmond Hill
856 12.2% English612 8.7% American406 5.8% German265 3.8% Irish170 2.4% African159 2.3% Italian135 1.9% Haitian120 1.7% Nigerian80 1.1% Welsh73 1.0% Greek67 1.0% French Canadian65 0.9% Russian52 0.7% European51 0.7% Jamaican37 0.5% Dutch33 0.5% Cajun32 0.5% Iranian29 0.4% Swiss26 0.4% Scotch-Irish22 0.3% Bahamian19 0.3% Scandinavian16 0.2% Norwegian15 0.2% Trinidadian and Tobagonian7 0.10% Czech6 0.09% British
Geographical mobility in Richmond Hill Same house 1 year ago 8,756 81.8% White (Caucasian)2,130 92.7% Black or African American25 99.5% American Indian / Alaska Native380 83.4% Asian872 60.7% Other race1,240 61.0% Two or more races8,732 81.5% White alone, not Hispanic / Latino1,163 56.6% Hispanic or LatinoMoved within same county 565 5.3% White / Caucasian5 0.2% Black or African American20 1.4% Other race31 1.5% Two or more races574 5.4% White alone, not Hispanic / Latino53 2.6% Hispanic or LatinoMoved within same state 440 4.1% White / Caucasian179 7.8% Black or African American25 5.6% Asian93 6.5% Other race145 7.1% Two or more races432 4.0% White alone, not Hispanic / Latino177 8.6% Hispanic or LatinoMoved from different state 1,016 9.5% White / Caucasian60 13.3% Asian68 4.7% Other race483 23.8% Two or more races1,058 9.9% White alone, not Hispanic / Latino356 17.3% Hispanic or LatinoMoved from abroad 353 24.6% Other race139 6.9% Two or more races345 16.8% Hispanic or Latino
Children Nativity (place of birth) in Richmond Hill
Children under 6 years - Living with two parents Both parents native 1,337 100.0% NativeOne native, one foreign-born parent 84 100.0% NativeChildren under 6 years - Living with one parent Native parent 128 100.0% NativeChildren 6 to 17 years - Living with two parents Both parents native 2,047 99.2% Native16 0.8% Foreign-bornBoth parents foreign-born 19 37.9% Native31 62.1% Foreign-bornOne native, one foreign-born parent 173 100.0% NativeChildren 6 to 17 years - Living with one parent Native parent 1,403 100.0% NativeForeign-born parent 243 54.2% Native205 45.8% Foreign-born