Races in Rochester, New Hampshire (NH) Detailed Stats
Data:
Races - White alone (%)
Races - White alone (% change since 2000)
Races - Black alone (%)
Races - Black alone (% change since 2000)
Races - American Indian alone (%)
Races - American Indian alone (% change since 2000)
Races - Asian alone (%)
Races - Asian alone (% change since 2000)
Races - Hispanic (%)
Races - Hispanic (% change since 2000)
Races - Native Hawaiian and Other Pacific Islander alone (%)
Races - Native Hawaiian and Other Pacific Islander alone (% change since 2000)
Races - Two or more races(%)
Races - Two or more races(% change since 2000)
Races - Other race alone (%)
Races - Other race alone (% change since 2000)
Racial diversity
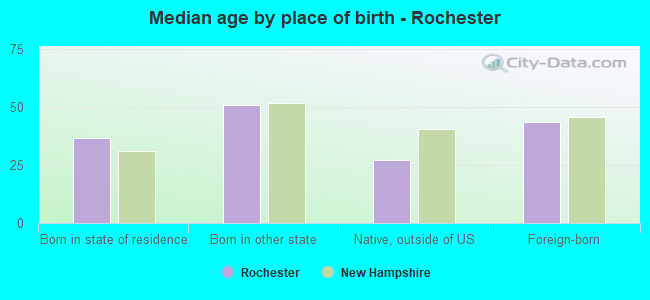
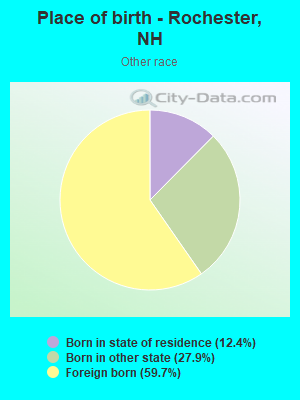
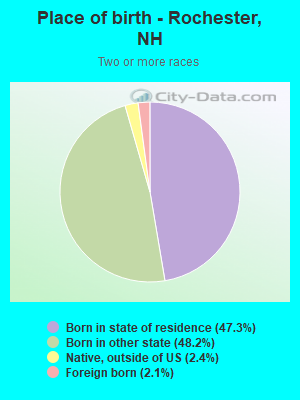
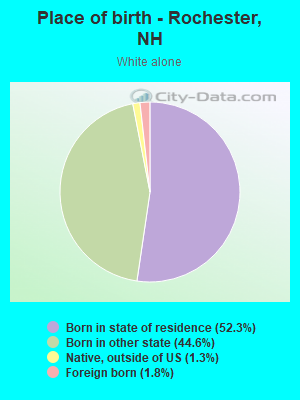
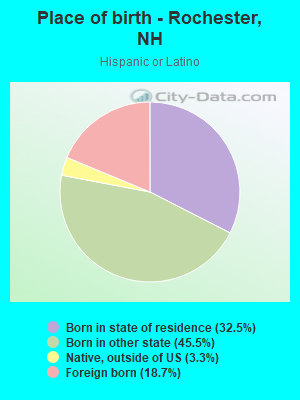
Place of birth - Born in state of residence (%)
Place of birth - Born in state of residence (%) - White
Place of birth - Born in state of residence (%) - Black or African American
Place of birth - Born in state of residence (%) - Asian
Place of birth - Born in state of residence (%) - Hispanic or Latino
Place of birth - Born in state of residence (%) - American Indian and Alaska Native
Place of birth - Born in state of residence (%) - Multirace
Place of birth - Born in state of residence (%) - Other Race
Place of birth - Born in other state (%)
Place of birth - Born in other state (%) - White
Place of birth - Born in other state (%) - Black or African American
Place of birth - Born in other state (%) - Asian
Place of birth - Born in other state (%) - Hispanic or Latino
Place of birth - Born in other state (%) - American Indian and Alaska Native
Place of birth - Born in other state (%) - Multirace
Place of birth - Born in other state (%) - Other Race
Place of birth - Native, outside of US (%)
Place of birth - Native, outside of US (%) - White
Place of birth - Native, outside of US (%) - Black or African American
Place of birth - Native, outside of US (%) - Asian
Place of birth - Native, outside of US (%) - Hispanic or Latino
Place of birth - Native, outside of US (%) - American Indian and Alaska Native
Place of birth - Native, outside of US (%) - Multirace
Place of birth - Native, outside of US (%) - Other Race
Place of birth - Foreign born (%)
Place of birth - Foreign born (%) - White
Place of birth - Foreign born (%) - Black or African American
Place of birth - Foreign born (%) - Asian
Place of birth - Foreign born (%) - Hispanic or Latino
Place of birth - Foreign born (%) - American Indian and Alaska Native
Place of birth - Foreign born (%) - Multirace
Place of birth - Foreign born (%) - Other Race
Residents speaking English at home (%)
Residents speaking English at home - Born in the United States (%)
Residents speaking English at home - Native, born elsewhere (%)
Residents speaking English at home - Foreign born (%)
Residents speaking Spanish at home (%)
Residents speaking Spanish at home - Born in the United States (%)
Residents speaking Spanish at home - Native, born elsewhere (%)
Residents speaking Spanish at home - Foreign born (%)
Residents speaking other language at home (%)
Residents speaking other language at home - Born in the United States (%)
Residents speaking other language at home - Native, born elsewhere (%)
Residents speaking other language at home - Foreign born (%)
Marital status - Never married (%)
Marital status - Now married (%)
Marital status - Separated (%)
Marital status - Widowed (%)
Marital status - Divorced (%)
Ancestries Reported - Arab (%)
Ancestries Reported - Czech (%)
Ancestries Reported - Danish (%)
Ancestries Reported - Dutch (%)
Ancestries Reported - English (%)
Ancestries Reported - French (%)
Ancestries Reported - French Canadian (%)
Ancestries Reported - German (%)
Ancestries Reported - Greek (%)
Ancestries Reported - Hungarian (%)
Ancestries Reported - Irish (%)
Ancestries Reported - Italian (%)
Ancestries Reported - Lithuanian (%)
Ancestries Reported - Norwegian (%)
Ancestries Reported - Polish (%)
Ancestries Reported - Portuguese (%)
Ancestries Reported - Russian (%)
Ancestries Reported - Scotch-Irish (%)
Ancestries Reported - Scottish (%)
Ancestries Reported - Slovak (%)
Ancestries Reported - Subsaharan African (%)
Ancestries Reported - Swedish (%)
Ancestries Reported - Swiss (%)
Ancestries Reported - Ukrainian (%)
Ancestries Reported - United States (%)
Ancestries Reported - Welsh (%)
Ancestries Reported - West Indian (%)
Ancestries Reported - Other (%)
Geographical mobility - Same house 1 year ago (%)
Geographical mobility - Same house 1 year ago (%) - White
Geographical mobility - Same house 1 year ago (%) - Black or African American
Geographical mobility - Same house 1 year ago (%) - Asian
Geographical mobility - Same house 1 year ago (%) - Hispanic or Latino
Geographical mobility - Same house 1 year ago (%) - American Indian and Alaska Native
Geographical mobility - Same house 1 year ago (%) - Multirace
Geographical mobility - Same house 1 year ago (%) - Other Race
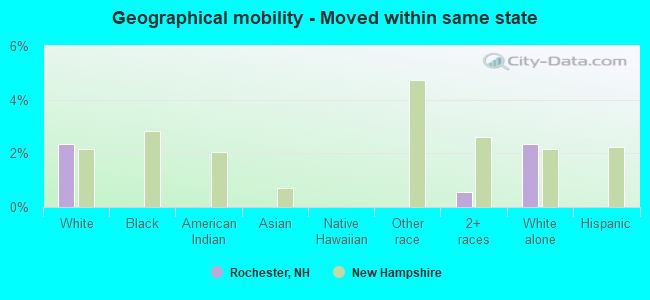
Geographical mobility - Moved within same county (%)
Geographical mobility - Moved within same county (%) - White
Geographical mobility - Moved within same county (%) - Black or African American
Geographical mobility - Moved within same county (%) - Asian
Geographical mobility - Moved within same county (%) - Hispanic or Latino
Geographical mobility - Moved within same county (%) - American Indian and Alaska Native
Geographical mobility - Moved within same county (%) - Multirace
Geographical mobility - Moved within same county (%) - Other Race
Geographical mobility - Moved from different county within same state (%)
Geographical mobility - Moved from different county within same state (%) - White
Geographical mobility - Moved from different county within same state (%) - Black or African American
Geographical mobility - Moved from different county within same state (%) - Asian
Geographical mobility - Moved from different county within same state (%) - Hispanic or Latino
Geographical mobility - Moved from different county within same state (%) - American Indian and Alaska Native
Geographical mobility - Moved from different county within same state (%) - Multirace
Geographical mobility - Moved from different county within same state (%) - Other Race
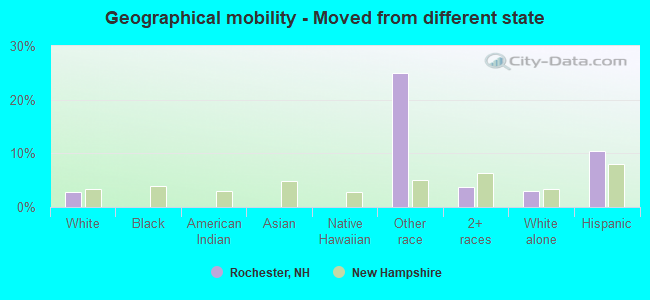
Geographical mobility - Moved from different state (%)
Geographical mobility - Moved from different state (%) - White
Geographical mobility - Moved from different state (%) - Black or African American
Geographical mobility - Moved from different state (%) - Asian
Geographical mobility - Moved from different state (%) - Hispanic or Latino
Geographical mobility - Moved from different state (%) - American Indian and Alaska Native
Geographical mobility - Moved from different state (%) - Multirace
Geographical mobility - Moved from different state (%) - Other Race
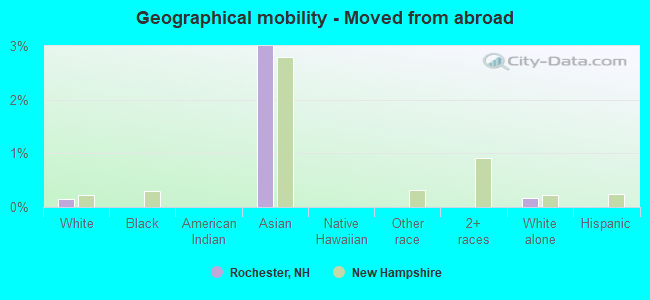
Geographical mobility - Moved from abroad (%)
Geographical mobility - Moved from abroad (%) - White
Geographical mobility - Moved from abroad (%) - Black or African American
Geographical mobility - Moved from abroad (%) - Asian
Geographical mobility - Moved from abroad (%) - Hispanic or Latino
Geographical mobility - Moved from abroad (%) - American Indian and Alaska Native
Geographical mobility - Moved from abroad (%) - Multirace
Geographical mobility - Moved from abroad (%) - Other Race
Place of birth for the foreign-born population - Ireland (%)
Place of birth for the foreign-born population - Denmark (%)
Place of birth for the foreign-born population - Norway (%)
Place of birth for the foreign-born population - Sweden (%)
Place of birth for the foreign-born population - United Kingdom (%)
Place of birth for the foreign-born population - England (%)
Place of birth for the foreign-born population - Scotland (%)
Place of birth for the foreign-born population - Other Northern Europe (%)
Place of birth for the foreign-born population - Austria (%)
Place of birth for the foreign-born population - Belgium (%)
Place of birth for the foreign-born population - France (%)
Place of birth for the foreign-born population - Germany (%)
Place of birth for the foreign-born population - Netherlands (%)
Place of birth for the foreign-born population - Switzerland (%)
Place of birth for the foreign-born population - Other Western Europe (%)
Place of birth for the foreign-born population - Greece (%)
Place of birth for the foreign-born population - Italy (%)
Place of birth for the foreign-born population - Portugal (%)
Place of birth for the foreign-born population - Spain (%)
Place of birth for the foreign-born population - Other Southern Europe (%)
Place of birth for the foreign-born population - Albania (%)
Place of birth for the foreign-born population - Belarus (%)
Place of birth for the foreign-born population - Bosnia and Herzegovina (%)
Place of birth for the foreign-born population - Bulgaria (%)
Place of birth for the foreign-born population - Croatia (%)
Place of birth for the foreign-born population - Czechoslovakia (%)
Place of birth for the foreign-born population - Hungary (%)
Place of birth for the foreign-born population - Latvia (%)
Place of birth for the foreign-born population - Lithuania (%)
Place of birth for the foreign-born population - North Macedonia (Macedonia) (%)
Place of birth for the foreign-born population - Moldova (%)
Place of birth for the foreign-born population - Poland (%)
Place of birth for the foreign-born population - Romania (%)
Place of birth for the foreign-born population - Russia (%)
Place of birth for the foreign-born population - Serbia (%)
Place of birth for the foreign-born population - Ukraine (%)
Place of birth for the foreign-born population - Other Eastern Europe (%)
Place of birth for the foreign-born population - China (%)
Place of birth for the foreign-born population - Hong Kong (%)
Place of birth for the foreign-born population - Taiwan (%)
Place of birth for the foreign-born population - Japan (%)
Place of birth for the foreign-born population - Korea (%)
Place of birth for the foreign-born population - Other Eastern Asia (%)
Place of birth for the foreign-born population - Afghanistan (%)
Place of birth for the foreign-born population - Bangladesh (%)
Place of birth for the foreign-born population - India (%)
Place of birth for the foreign-born population - Iran (%)
Place of birth for the foreign-born population - Kazakhstan (%)
Place of birth for the foreign-born population - Nepal (%)
Place of birth for the foreign-born population - Pakistan (%)
Place of birth for the foreign-born population - Sri Lanka (%)
Place of birth for the foreign-born population - Uzbekistan (%)
Place of birth for the foreign-born population - Other South Central Asia (%)
Place of birth for the foreign-born population - Burma (%)
Place of birth for the foreign-born population - Cambodia (%)
Place of birth for the foreign-born population - Indonesia (%)
Place of birth for the foreign-born population - Laos (%)
Place of birth for the foreign-born population - Malaysia (%)
Place of birth for the foreign-born population - Philippines (%)
Place of birth for the foreign-born population - Singapore (%)
Place of birth for the foreign-born population - Thailand (%)
Place of birth for the foreign-born population - Vietnam (%)
Place of birth for the foreign-born population - Other South Eastern Asia (%)
Place of birth for the foreign-born population - Armenia (%)
Place of birth for the foreign-born population - Iraq (%)
Place of birth for the foreign-born population - Israel (%)
Place of birth for the foreign-born population - Jordan (%)
Place of birth for the foreign-born population - Kuwait (%)
Place of birth for the foreign-born population - Lebanon (%)
Place of birth for the foreign-born population - Saudi Arabia (%)
Place of birth for the foreign-born population - Syria (%)
Place of birth for the foreign-born population - Turkey (%)
Place of birth for the foreign-born population - Yemen (%)
Place of birth for the foreign-born population - Other Western Asia (%)
Place of birth for the foreign-born population - Eritrea (%)
Place of birth for the foreign-born population - Ethiopia (%)
Place of birth for the foreign-born population - Kenya (%)
Place of birth for the foreign-born population - Somalia (%)
Place of birth for the foreign-born population - Uganda (%)
Place of birth for the foreign-born population - Zimbabwe (%)
Place of birth for the foreign-born population - Other Eastern Africa (%)
Place of birth for the foreign-born population - Cameroon (%)
Place of birth for the foreign-born population - Congo (%)
Place of birth for the foreign-born population - Democratic Republic of Congo (Zaire) (%)
Place of birth for the foreign-born population - Other Middle Africa (%)
Place of birth for the foreign-born population - Egypt (%)
Place of birth for the foreign-born population - Morocco (%)
Place of birth for the foreign-born population - Sudan (%)
Place of birth for the foreign-born population - Other Northern Africa (%)
Place of birth for the foreign-born population - South Africa (%)
Place of birth for the foreign-born population - Other Southern Africa (%)
Place of birth for the foreign-born population - Cabo Verde (%)
Place of birth for the foreign-born population - Ghana (%)
Place of birth for the foreign-born population - Liberia (%)
Place of birth for the foreign-born population - Nigeria (%)
Place of birth for the foreign-born population - Senegal (%)
Place of birth for the foreign-born population - Sierra Leone (%)
Place of birth for the foreign-born population - Other Western Africa (%)
Place of birth for the foreign-born population - Australia (%)
Place of birth for the foreign-born population - New Zealand (%)
Place of birth for the foreign-born population - Fiji (%)
Place of birth for the foreign-born population - Micronesia (%)
Place of birth for the foreign-born population - Bahamas (%)
Place of birth for the foreign-born population - Barbados (%)
Place of birth for the foreign-born population - Cuba (%)
Place of birth for the foreign-born population - Dominica (%)
Place of birth for the foreign-born population - Dominican Republic (%)
Place of birth for the foreign-born population - Grenada (%)
Place of birth for the foreign-born population - Haiti (%)
Place of birth for the foreign-born population - Jamaica (%)
Place of birth for the foreign-born population - St. Vincent and the Grenadines (%)
Place of birth for the foreign-born population - Trinidad and Tobago (%)
Place of birth for the foreign-born population - West Indies (%)
Place of birth for the foreign-born population - Other Caribbean (%)
Place of birth for the foreign-born population - Belize (%)
Place of birth for the foreign-born population - Costa Rica (%)
Place of birth for the foreign-born population - El Salvador (%)
Place of birth for the foreign-born population - Guatemala (%)
Place of birth for the foreign-born population - Honduras (%)
Place of birth for the foreign-born population - Mexico (%)
Place of birth for the foreign-born population - Nicaragua (%)
Place of birth for the foreign-born population - Panama (%)
Place of birth for the foreign-born population - Other Central America (%)
Place of birth for the foreign-born population - Argentina (%)
Place of birth for the foreign-born population - Bolivia (%)
Place of birth for the foreign-born population - Brazil (%)
Place of birth for the foreign-born population - Chile (%)
Place of birth for the foreign-born population - Colombia (%)
Place of birth for the foreign-born population - Ecuador (%)
Place of birth for the foreign-born population - Guyana (%)
Place of birth for the foreign-born population - Peru (%)
Place of birth for the foreign-born population - Uruguay (%)
Place of birth for the foreign-born population - Venezuela (%)
Place of birth for the foreign-born population - Other South America (%)
Place of birth for the foreign-born population - Canada (%)
Place of birth for the foreign-born population - Other Northern America (%)
Place of birth for the foreign-born population - Other (%)
Latest news about races in Rochester, NH collected exclusively by city-data.com from local newspapers, TV, and radio stations
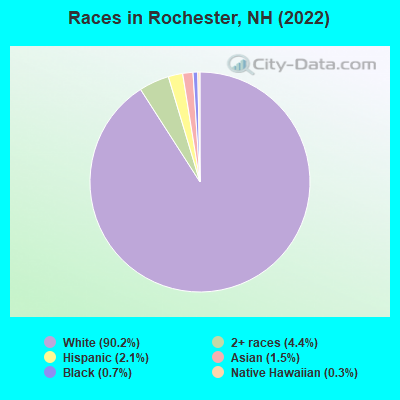
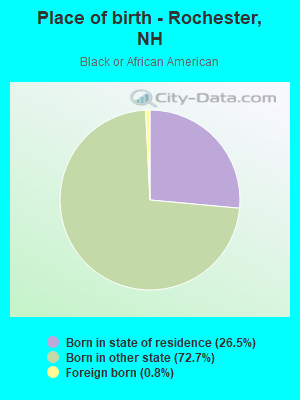
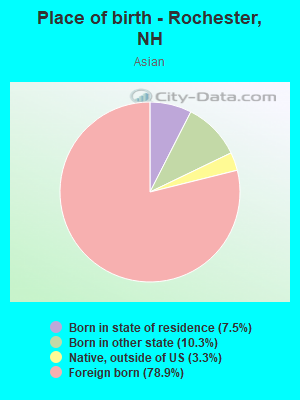
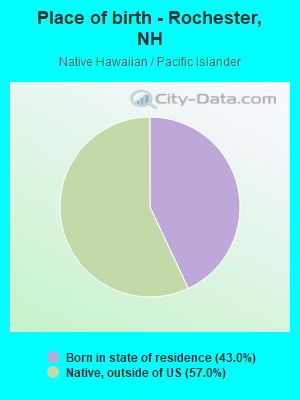
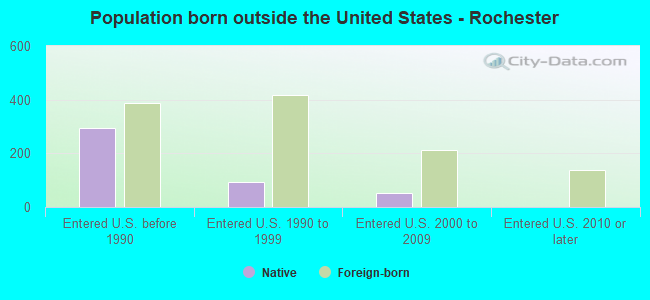
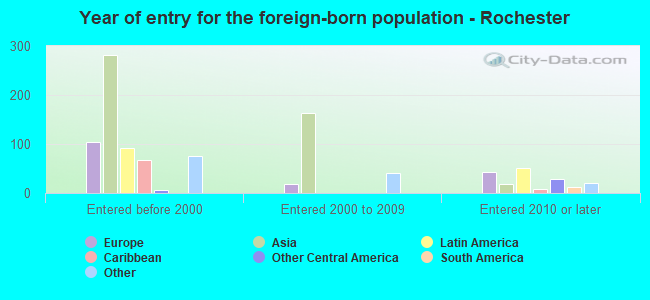
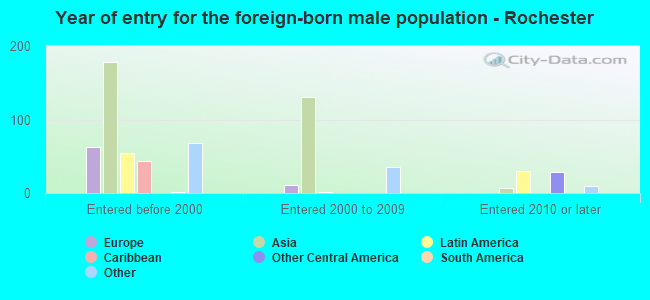
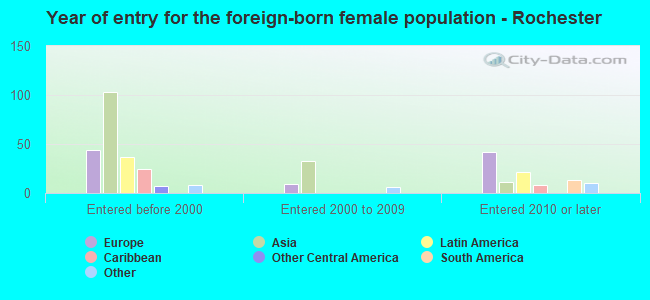
According to 2022 data, the most numerous races in Rochester, NH are White alone (29,690 residents), Hispanic (698 residents), and Two or more races (1,453 residents). 95.6% of Rochester residents speak English at home. 2.7% of Rochester, NH residents are foreign-born (1.2% born in Asia, 0.6% born in Europe, 0.4% born in Latin America, 0.3% born in North America), which is 84.8% less than the foreign-born rate of 5.0% across the entire state of New Hampshire.
Race distribution in Rochester
2000 2022
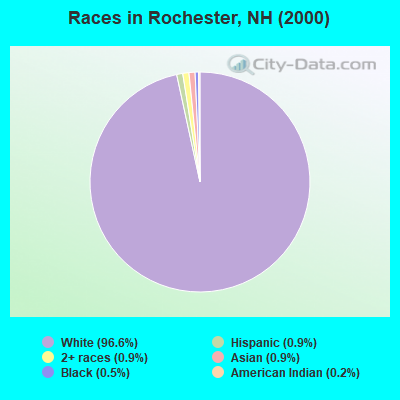
1,175,252 95.1% White alone 20,489 1.7% Hispanic 15,803 1.3% Asian alone 11,606 0.9% Two or more races 8,354 0.7% Black alone 2,698 0.2% American Indian alone 1,254 0.1% Other race alone 330 0.03% Native Hawaiian and Other
1,208,101 86.6% White alone 63,479 4.5% Hispanic 60,724 4.4% Two or more races 36,519 2.6% Asian alone 17,931 1.3% Black alone 6,615 0.5% Other race alone 1,014 0.07% American Indian alone 848 0.06% Native Hawaiian and Other
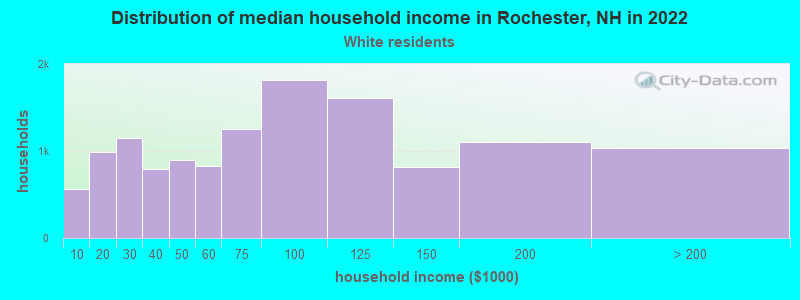
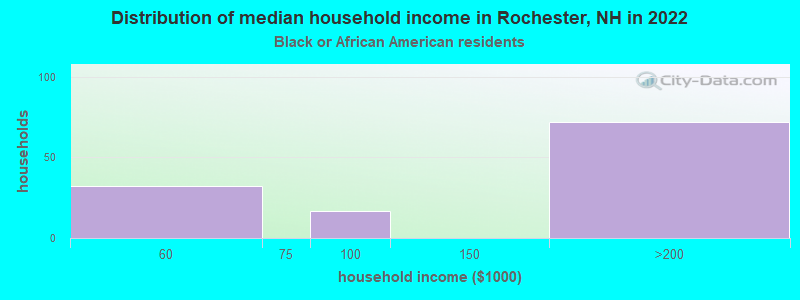
Income and house value in Rochester Median household income in 2022 $76,169 White non-Hispanic householders$144,427 Black householders$76,241 Some other race householders$108,450 Two or more races householders$75,084 Hispanic or Latino race householdersMedian 2022 house value $305,850 White Non-Hispanic householders$362,077 Black or African American householders $682,139 Asian householders$494,303 Some other race householders$307,086 Two or more races householders$336,744 Hispanic or Latino householders
Median age by race in Rochester
45.3 Median age for White residents42.5 49.4 51.5 Median age for Black or African American residents54.8 56.1 -671,296,295.6 Median age for American Indian / Alaska Native residents-772,357,722.8 -763,157,894.0 48.7 Median age for Asian residents40.9 52.9 -666,666,666.0 Median age for Native Hawaiian / Pacific Islander residents-666,666,666.0 -666,666,666.0 33.8 Median age for Other race residents33.7 70.3 15.6 Median age for Two or more races residents17.0 19.6 45.3 Median age for White alone residents42.6 49.4 32.6 Median age for Hispanic or Latino residents32.9 20.2
Owner/renter occupied households by race in Rochester
House owners and renters - White residents 8,492 65.4% Owner occupied4,501 34.6% Renter occupiedHouse owners and renters - Black or African American residents 19 14.3% Owner occupied112 85.7% Renter occupiedHouse owners and renters - American Indian / Alaska Native residents 6 100.0% Renter occupiedHouse owners and renters - Asian residents 267 97.4% Owner occupied7 2.6% Renter occupiedHouse owners and renters - Native Hawaiian / Pacific Islander residents 68 100.0% Owner occupiedHouse owners and renters - Other race residents 123 100.0% Owner occupiedHouse owners and renters - Two or more races residents 151 67.2% Owner occupied74 32.8% Renter occupiedHouse owners and renters - White alone residents 8,451 65.3% Owner occupied4,484 34.7% Renter occupiedHouse owners and renters - Hispanic or Latino residents 197 89.2% Owner occupied24 10.8% Renter occupied
Language usage in Rochester
English speakers - Total 95.6% of residents of Rochester speak English at home.
2.1% of residents speak Spanish at home 622 94.8% Speak English very well34 5.2% Speak English less than very well2.4% of residents speak other language at home 406 54.6% Speak English very well338 45.4% Speak English less than very well
English speakers - Born in the United States 98.3% of residents of Rochester speak English at home.
2.7% of residents speak Spanish at home 376 98.2% Speak English very well7 1.8% Speak English less than very well0.2% of residents speak other language at home 35 100.0% Speak English very well
English speakers - Native, born elsewhere 78.3% of residents of Rochester speak English at home.
3.4% of residents speak Spanish at home 20 100.0% Speak English very well1.7% of residents speak other language at home 10 100.0% Speak English very well
English speakers - Foreign-born 43.3% of residents of Rochester speak English at home.
8.0% of residents speak Spanish at home 49 57.0% Speak English very well37 43.0% Speak English less than very well40.5% of residents speak other language at home 71 16.2% Speak English very well367 83.8% Speak English less than very well
White (Caucasian) - Speak only English Native:
98.6% (27,791)Foreign-born:
88.3% (451)
White (Caucasian) - Speak another language Native:
1.4% (409)Foreign-born:
14.3% (73)
Asian - Speak only English Native:
5.9% (6)Foreign-born:
5.7% (22)
Asian - Speak another language Native:
100.0% (107)Foreign-born:
92.1% (355)
Other race - Speak another language Native:
40.5% (41)Foreign-born:
100.0% (192)
Two or more races - Speak another language Native:
2.1% (40)Foreign-born:
92.7% (33)
White alone - Speak only English Native:
98.7% (27,611)Foreign-born:
86.7% (456)
White alone - Speak another language Native:
1.4% (379)Foreign-born:
14.1% (74)
Hispanic or Latino - Speak only English Native:
68.8% (322)Foreign-born:
1.1% (1)
Hispanic or Latino - Speak another language Native:
30.7% (144)Foreign-born:
100.0% (131)
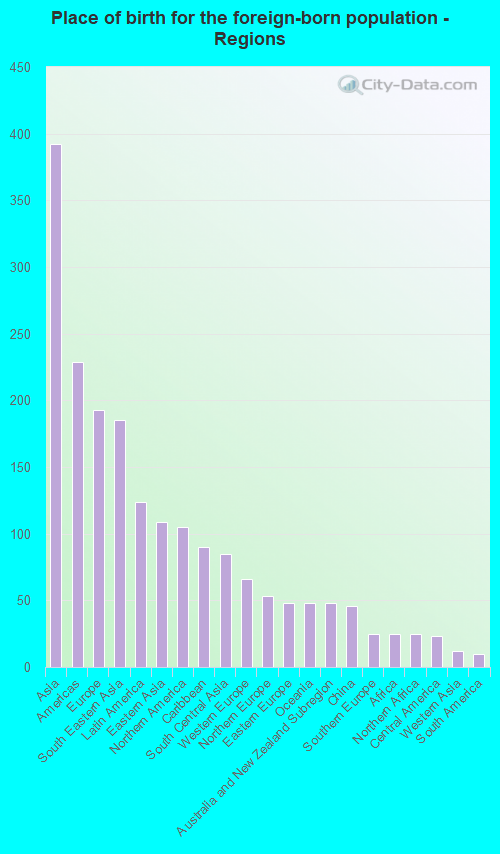
Foreign-born residents in Rochester 890 residents are foreign born (1.2% Asia , 0.6% Europe , 0.4% Latin America , 0.3% North America ).
This city:
2.7%New Hampshire:
6.0%
Marital status for residents in Rochester Marital status - White (Caucasian) population 15 years and over
Males 33.2% Never married47.5% Now married1.2% Separated3.6% Widowed14.5% DivorcedFemales 22.2% Never married47.2% Now married2.1% Separated10.5% Widowed18.0% DivorcedWomen who gave birth in the past 12 months Now married:
91.9% (273)Unmarried:
8.1% (24)
Women who did not give birth in the past 12 months Now married:
42.3% (2,381)Unmarried:
57.7% (3,249)
Marital status - Black or African American population 15 years and over
Males 18.1% Never married81.9% Now married0.0% Separated0.0% Widowed0.0% DivorcedFemales 23.9% Never married57.5% Now married0.0% Separated0.0% Widowed18.7% DivorcedWomen who did not give birth in the past 12 months Now married:
70.6% (75)Unmarried:
29.4% (31)
Marital status - Asian population 15 years and over
Males 49.5% Never married41.0% Now married0.0% Separated0.0% Widowed9.5% DivorcedFemales 23.8% Never married67.3% Now married0.0% Separated6.5% Widowed2.4% DivorcedWomen who did not give birth in the past 12 months Now married:
59.6% (66)Unmarried:
40.4% (45)
Marital status - Other race population 15 years and over
Males 72.9% Never married27.1% Now married0.0% Separated0.0% Widowed0.0% DivorcedFemales 3.8% Never married17.0% Now married0.0% Separated30.2% Widowed49.1% DivorcedWomen who did not give birth in the past 12 months Now married:
0.0% (0)Unmarried:
100.0% (4)
Marital status - Two or more races population 15 years and over
Males 60.7% Never married38.1% Now married0.0% Separated0.0% Widowed1.2% DivorcedFemales 43.4% Never married33.6% Now married0.5% Separated2.3% Widowed20.2% DivorcedWomen who gave birth in the past 12 months Now married:
100.0% (37)Unmarried:
0.0% (0)
Women who did not give birth in the past 12 months Now married:
36.0% (152)Unmarried:
64.0% (270)
Marital status - White alone, not Hispanic / Latino population 15 years and over
Males 33.0% Never married47.7% Now married1.2% Separated3.6% Widowed14.4% DivorcedFemales 21.8% Never married47.3% Now married2.1% Separated10.6% Widowed18.2% DivorcedWomen who gave birth in the past 12 months Now married:
91.9% (275)Unmarried:
8.1% (24)
Women who did not give birth in the past 12 months Now married:
42.4% (2,361)Unmarried:
57.6% (3,204)
Marital status - Hispanic or Latino population 15 years and over
Males 59.6% Never married32.0% Now married0.0% Separated0.0% Widowed8.5% DivorcedFemales 39.9% Never married37.8% Now married0.0% Separated8.5% Widowed13.8% DivorcedWomen who did not give birth in the past 12 months Now married:
44.0% (64)Unmarried:
56.0% (81)
Ancestries in Rochester
2,690 19.6% English1,835 13.4% Irish1,417 10.3% American1,227 8.9% French Canadian1,213 8.8% French1,206 8.8% Italian451 3.3% German330 2.4% European306 2.2% Scotch-Irish279 2.0% Scottish146 1.1% Greek128 0.9% Haitian124 0.9% Polish68 0.5% Swedish62 0.5% Norwegian57 0.4% Scandinavian55 0.4% Northern European53 0.4% Lithuanian37 0.3% Canadian31 0.2% Dutch29 0.2% Luxembourger27 0.2% Moroccan27 0.2% British26 0.2% Swiss25 0.2% Portuguese19 0.1% Celtic14 0.1% Cajun14 0.1% Eastern European12 0.09% Finnish10 0.07% Welsh9 0.07% Armenian
Children Nativity (place of birth) in Rochester
Children under 6 years - Living with two parents Both parents native 1,161 100.0% NativeBoth parents foreign-born 19 100.0% NativeOne native, one foreign-born parent 19 100.0% NativeChildren under 6 years - Living with one parent Native parent 394 100.0% NativeChildren 6 to 17 years - Living with two parents Both parents native 2,498 100.0% NativeBoth parents foreign-born 30 100.0% NativeOne native, one foreign-born parent 13 100.0% NativeChildren 6 to 17 years - Living with one parent Native parent 1,446 100.0% NativeForeign-born parent 19 48.8% Native20 51.2% Foreign-born
Grandparents responsible for own grandchildren in Rochester
Grandparents (30 to 59 years) White / Caucasian 33 22.5% Responsible for grandchildren113 77.5% Not responsible for grandchildrenTwo or more races 61 100.0% Responsible for grandchildrenWhite alone, not Hispanic / Latino 33 22.6% Responsible for grandchildren113 77.4% Not responsible for grandchildrenGrandparents (60 years and over) White / Caucasian 114 23.3% Responsible for grandchildren377 76.7% Not responsible for grandchildrenWhite alone, not Hispanic / Latino 114 23.3% Responsible for grandchildren377 76.7% Not responsible for grandchildren