Races in Rocklin, California (CA) Detailed Stats
Data:
Races - White alone (%)
Races - White alone (% change since 2000)
Races - Black alone (%)
Races - Black alone (% change since 2000)
Races - American Indian alone (%)
Races - American Indian alone (% change since 2000)
Races - Asian alone (%)
Races - Asian alone (% change since 2000)
Races - Hispanic (%)
Races - Hispanic (% change since 2000)
Races - Native Hawaiian and Other Pacific Islander alone (%)
Races - Native Hawaiian and Other Pacific Islander alone (% change since 2000)
Races - Two or more races(%)
Races - Two or more races(% change since 2000)
Races - Other race alone (%)
Races - Other race alone (% change since 2000)
Racial diversity
Place of birth - Born in state of residence (%)
Place of birth - Born in state of residence (%) - White
Place of birth - Born in state of residence (%) - Black or African American
Place of birth - Born in state of residence (%) - Asian
Place of birth - Born in state of residence (%) - Hispanic or Latino
Place of birth - Born in state of residence (%) - American Indian and Alaska Native
Place of birth - Born in state of residence (%) - Multirace
Place of birth - Born in state of residence (%) - Other Race
Place of birth - Born in other state (%)
Place of birth - Born in other state (%) - White
Place of birth - Born in other state (%) - Black or African American
Place of birth - Born in other state (%) - Asian
Place of birth - Born in other state (%) - Hispanic or Latino
Place of birth - Born in other state (%) - American Indian and Alaska Native
Place of birth - Born in other state (%) - Multirace
Place of birth - Born in other state (%) - Other Race
Place of birth - Native, outside of US (%)
Place of birth - Native, outside of US (%) - White
Place of birth - Native, outside of US (%) - Black or African American
Place of birth - Native, outside of US (%) - Asian
Place of birth - Native, outside of US (%) - Hispanic or Latino
Place of birth - Native, outside of US (%) - American Indian and Alaska Native
Place of birth - Native, outside of US (%) - Multirace
Place of birth - Native, outside of US (%) - Other Race
Place of birth - Foreign born (%)
Place of birth - Foreign born (%) - White
Place of birth - Foreign born (%) - Black or African American
Place of birth - Foreign born (%) - Asian
Place of birth - Foreign born (%) - Hispanic or Latino
Place of birth - Foreign born (%) - American Indian and Alaska Native
Place of birth - Foreign born (%) - Multirace
Place of birth - Foreign born (%) - Other Race
Residents speaking English at home (%)
Residents speaking English at home - Born in the United States (%)
Residents speaking English at home - Native, born elsewhere (%)
Residents speaking English at home - Foreign born (%)
Residents speaking Spanish at home (%)
Residents speaking Spanish at home - Born in the United States (%)
Residents speaking Spanish at home - Native, born elsewhere (%)
Residents speaking Spanish at home - Foreign born (%)
Residents speaking other language at home (%)
Residents speaking other language at home - Born in the United States (%)
Residents speaking other language at home - Native, born elsewhere (%)
Residents speaking other language at home - Foreign born (%)
Marital status - Never married (%)
Marital status - Now married (%)
Marital status - Separated (%)
Marital status - Widowed (%)
Marital status - Divorced (%)
Ancestries Reported - Arab (%)
Ancestries Reported - Czech (%)
Ancestries Reported - Danish (%)
Ancestries Reported - Dutch (%)
Ancestries Reported - English (%)
Ancestries Reported - French (%)
Ancestries Reported - French Canadian (%)
Ancestries Reported - German (%)
Ancestries Reported - Greek (%)
Ancestries Reported - Hungarian (%)
Ancestries Reported - Irish (%)
Ancestries Reported - Italian (%)
Ancestries Reported - Lithuanian (%)
Ancestries Reported - Norwegian (%)
Ancestries Reported - Polish (%)
Ancestries Reported - Portuguese (%)
Ancestries Reported - Russian (%)
Ancestries Reported - Scotch-Irish (%)
Ancestries Reported - Scottish (%)
Ancestries Reported - Slovak (%)
Ancestries Reported - Subsaharan African (%)
Ancestries Reported - Swedish (%)
Ancestries Reported - Swiss (%)
Ancestries Reported - Ukrainian (%)
Ancestries Reported - United States (%)
Ancestries Reported - Welsh (%)
Ancestries Reported - West Indian (%)
Ancestries Reported - Other (%)
Geographical mobility - Same house 1 year ago (%)
Geographical mobility - Same house 1 year ago (%) - White
Geographical mobility - Same house 1 year ago (%) - Black or African American
Geographical mobility - Same house 1 year ago (%) - Asian
Geographical mobility - Same house 1 year ago (%) - Hispanic or Latino
Geographical mobility - Same house 1 year ago (%) - American Indian and Alaska Native
Geographical mobility - Same house 1 year ago (%) - Multirace
Geographical mobility - Same house 1 year ago (%) - Other Race
Geographical mobility - Moved within same county (%)
Geographical mobility - Moved within same county (%) - White
Geographical mobility - Moved within same county (%) - Black or African American
Geographical mobility - Moved within same county (%) - Asian
Geographical mobility - Moved within same county (%) - Hispanic or Latino
Geographical mobility - Moved within same county (%) - American Indian and Alaska Native
Geographical mobility - Moved within same county (%) - Multirace
Geographical mobility - Moved within same county (%) - Other Race
Geographical mobility - Moved from different county within same state (%)
Geographical mobility - Moved from different county within same state (%) - White
Geographical mobility - Moved from different county within same state (%) - Black or African American
Geographical mobility - Moved from different county within same state (%) - Asian
Geographical mobility - Moved from different county within same state (%) - Hispanic or Latino
Geographical mobility - Moved from different county within same state (%) - American Indian and Alaska Native
Geographical mobility - Moved from different county within same state (%) - Multirace
Geographical mobility - Moved from different county within same state (%) - Other Race
Geographical mobility - Moved from different state (%)
Geographical mobility - Moved from different state (%) - White
Geographical mobility - Moved from different state (%) - Black or African American
Geographical mobility - Moved from different state (%) - Asian
Geographical mobility - Moved from different state (%) - Hispanic or Latino
Geographical mobility - Moved from different state (%) - American Indian and Alaska Native
Geographical mobility - Moved from different state (%) - Multirace
Geographical mobility - Moved from different state (%) - Other Race
Geographical mobility - Moved from abroad (%)
Geographical mobility - Moved from abroad (%) - White
Geographical mobility - Moved from abroad (%) - Black or African American
Geographical mobility - Moved from abroad (%) - Asian
Geographical mobility - Moved from abroad (%) - Hispanic or Latino
Geographical mobility - Moved from abroad (%) - American Indian and Alaska Native
Geographical mobility - Moved from abroad (%) - Multirace
Geographical mobility - Moved from abroad (%) - Other Race
Place of birth for the foreign-born population - Ireland (%)
Place of birth for the foreign-born population - Denmark (%)
Place of birth for the foreign-born population - Norway (%)
Place of birth for the foreign-born population - Sweden (%)
Place of birth for the foreign-born population - United Kingdom (%)
Place of birth for the foreign-born population - England (%)
Place of birth for the foreign-born population - Scotland (%)
Place of birth for the foreign-born population - Other Northern Europe (%)
Place of birth for the foreign-born population - Austria (%)
Place of birth for the foreign-born population - Belgium (%)
Place of birth for the foreign-born population - France (%)
Place of birth for the foreign-born population - Germany (%)
Place of birth for the foreign-born population - Netherlands (%)
Place of birth for the foreign-born population - Switzerland (%)
Place of birth for the foreign-born population - Other Western Europe (%)
Place of birth for the foreign-born population - Greece (%)
Place of birth for the foreign-born population - Italy (%)
Place of birth for the foreign-born population - Portugal (%)
Place of birth for the foreign-born population - Spain (%)
Place of birth for the foreign-born population - Other Southern Europe (%)
Place of birth for the foreign-born population - Albania (%)
Place of birth for the foreign-born population - Belarus (%)
Place of birth for the foreign-born population - Bosnia and Herzegovina (%)
Place of birth for the foreign-born population - Bulgaria (%)
Place of birth for the foreign-born population - Croatia (%)
Place of birth for the foreign-born population - Czechoslovakia (%)
Place of birth for the foreign-born population - Hungary (%)
Place of birth for the foreign-born population - Latvia (%)
Place of birth for the foreign-born population - Lithuania (%)
Place of birth for the foreign-born population - North Macedonia (Macedonia) (%)
Place of birth for the foreign-born population - Moldova (%)
Place of birth for the foreign-born population - Poland (%)
Place of birth for the foreign-born population - Romania (%)
Place of birth for the foreign-born population - Russia (%)
Place of birth for the foreign-born population - Serbia (%)
Place of birth for the foreign-born population - Ukraine (%)
Place of birth for the foreign-born population - Other Eastern Europe (%)
Place of birth for the foreign-born population - China (%)
Place of birth for the foreign-born population - Hong Kong (%)
Place of birth for the foreign-born population - Taiwan (%)
Place of birth for the foreign-born population - Japan (%)
Place of birth for the foreign-born population - Korea (%)
Place of birth for the foreign-born population - Other Eastern Asia (%)
Place of birth for the foreign-born population - Afghanistan (%)
Place of birth for the foreign-born population - Bangladesh (%)
Place of birth for the foreign-born population - India (%)
Place of birth for the foreign-born population - Iran (%)
Place of birth for the foreign-born population - Kazakhstan (%)
Place of birth for the foreign-born population - Nepal (%)
Place of birth for the foreign-born population - Pakistan (%)
Place of birth for the foreign-born population - Sri Lanka (%)
Place of birth for the foreign-born population - Uzbekistan (%)
Place of birth for the foreign-born population - Other South Central Asia (%)
Place of birth for the foreign-born population - Burma (%)
Place of birth for the foreign-born population - Cambodia (%)
Place of birth for the foreign-born population - Indonesia (%)
Place of birth for the foreign-born population - Laos (%)
Place of birth for the foreign-born population - Malaysia (%)
Place of birth for the foreign-born population - Philippines (%)
Place of birth for the foreign-born population - Singapore (%)
Place of birth for the foreign-born population - Thailand (%)
Place of birth for the foreign-born population - Vietnam (%)
Place of birth for the foreign-born population - Other South Eastern Asia (%)
Place of birth for the foreign-born population - Armenia (%)
Place of birth for the foreign-born population - Iraq (%)
Place of birth for the foreign-born population - Israel (%)
Place of birth for the foreign-born population - Jordan (%)
Place of birth for the foreign-born population - Kuwait (%)
Place of birth for the foreign-born population - Lebanon (%)
Place of birth for the foreign-born population - Saudi Arabia (%)
Place of birth for the foreign-born population - Syria (%)
Place of birth for the foreign-born population - Turkey (%)
Place of birth for the foreign-born population - Yemen (%)
Place of birth for the foreign-born population - Other Western Asia (%)
Place of birth for the foreign-born population - Eritrea (%)
Place of birth for the foreign-born population - Ethiopia (%)
Place of birth for the foreign-born population - Kenya (%)
Place of birth for the foreign-born population - Somalia (%)
Place of birth for the foreign-born population - Uganda (%)
Place of birth for the foreign-born population - Zimbabwe (%)
Place of birth for the foreign-born population - Other Eastern Africa (%)
Place of birth for the foreign-born population - Cameroon (%)
Place of birth for the foreign-born population - Congo (%)
Place of birth for the foreign-born population - Democratic Republic of Congo (Zaire) (%)
Place of birth for the foreign-born population - Other Middle Africa (%)
Place of birth for the foreign-born population - Egypt (%)
Place of birth for the foreign-born population - Morocco (%)
Place of birth for the foreign-born population - Sudan (%)
Place of birth for the foreign-born population - Other Northern Africa (%)
Place of birth for the foreign-born population - South Africa (%)
Place of birth for the foreign-born population - Other Southern Africa (%)
Place of birth for the foreign-born population - Cabo Verde (%)
Place of birth for the foreign-born population - Ghana (%)
Place of birth for the foreign-born population - Liberia (%)
Place of birth for the foreign-born population - Nigeria (%)
Place of birth for the foreign-born population - Senegal (%)
Place of birth for the foreign-born population - Sierra Leone (%)
Place of birth for the foreign-born population - Other Western Africa (%)
Place of birth for the foreign-born population - Australia (%)
Place of birth for the foreign-born population - New Zealand (%)
Place of birth for the foreign-born population - Fiji (%)
Place of birth for the foreign-born population - Micronesia (%)
Place of birth for the foreign-born population - Bahamas (%)
Place of birth for the foreign-born population - Barbados (%)
Place of birth for the foreign-born population - Cuba (%)
Place of birth for the foreign-born population - Dominica (%)
Place of birth for the foreign-born population - Dominican Republic (%)
Place of birth for the foreign-born population - Grenada (%)
Place of birth for the foreign-born population - Haiti (%)
Place of birth for the foreign-born population - Jamaica (%)
Place of birth for the foreign-born population - St. Vincent and the Grenadines (%)
Place of birth for the foreign-born population - Trinidad and Tobago (%)
Place of birth for the foreign-born population - West Indies (%)
Place of birth for the foreign-born population - Other Caribbean (%)
Place of birth for the foreign-born population - Belize (%)
Place of birth for the foreign-born population - Costa Rica (%)
Place of birth for the foreign-born population - El Salvador (%)
Place of birth for the foreign-born population - Guatemala (%)
Place of birth for the foreign-born population - Honduras (%)
Place of birth for the foreign-born population - Mexico (%)
Place of birth for the foreign-born population - Nicaragua (%)
Place of birth for the foreign-born population - Panama (%)
Place of birth for the foreign-born population - Other Central America (%)
Place of birth for the foreign-born population - Argentina (%)
Place of birth for the foreign-born population - Bolivia (%)
Place of birth for the foreign-born population - Brazil (%)
Place of birth for the foreign-born population - Chile (%)
Place of birth for the foreign-born population - Colombia (%)
Place of birth for the foreign-born population - Ecuador (%)
Place of birth for the foreign-born population - Guyana (%)
Place of birth for the foreign-born population - Peru (%)
Place of birth for the foreign-born population - Uruguay (%)
Place of birth for the foreign-born population - Venezuela (%)
Place of birth for the foreign-born population - Other South America (%)
Place of birth for the foreign-born population - Canada (%)
Place of birth for the foreign-born population - Other Northern America (%)
Place of birth for the foreign-born population - Other (%)
Latest news about races in Rocklin, CA collected exclusively by city-data.com from local newspapers, TV, and radio stations
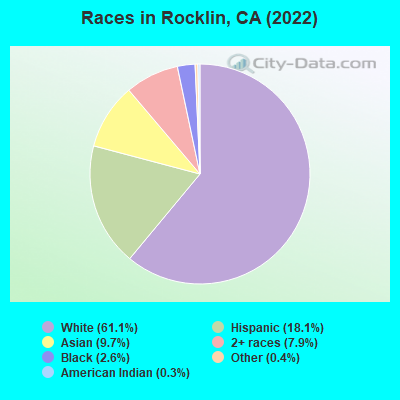
According to 2022 data, the most numerous races in Rocklin, CA are Hispanic (8,438 residents), White alone (42,712 residents), and Asian alone (6,800 residents). 85.5% of Rocklin residents speak English at home. 11.7% of Rocklin, CA residents are foreign-born (6.6% born in Asia, 2.5% born in Latin America, 2.0% born in Europe), which is 121.3% less than the foreign-born rate of 26.0% across the entire state of California.
Race distribution in Rocklin
2000 2022
15,816,790 46.7% White alone 10,966,556 32.4% Hispanic 3,648,860 10.8% Asian alone 2,181,926 6.4% Black alone 903,115 2.7% Two or more races 178,984 0.5% American Indian alone 103,736 0.3% Native Hawaiian and Other 71,681 0.2% Other race alone
15,732,184 40.3% Hispanic 13,160,426 33.7% White alone 5,957,867 15.3% Asian alone 2,025,218 5.2% Black alone 1,663,222 4.3% Two or more races 251,618 0.6% Other race alone 135,777 0.3% Native Hawaiian and Other 103,030 0.3% American Indian alone
Income and house value in Rocklin Median household income in 2022 $120,543 White non-Hispanic householders$127,487 Black householdersover $200,000 American Indian and Alaska Native householders$129,590 Asian householders$24,909 Native Hawaiian and other Pacific Islander householders$106,613 Some other race householders$79,000 Two or more races householders$91,460 Hispanic or Latino race householdersMedian 2022 house value $762,330 White Non-Hispanic householders$903,423 Black or African American householders$815,240 American Indian or Alaska Native householders $838,995 Asian householders$584,885 Native Hawaiian and other Pacific Islander householders$743,254 Some other race householders$805,162 Two or more races householders$756,212 Hispanic or Latino householders
Median age by race in Rocklin
42.2 Median age for White residents41.6 43.3 53.2 Median age for Black or African American residents48.1 68.6 72.1 Median age for American Indian / Alaska Native residents39.0 Median age for Asian residents38.1 41.5 74.9 Median age for Native Hawaiian / Pacific Islander residents56.5 Median age for Other race residents28.1 67.1 26.4 Median age for Two or more races residents24.3 29.7 41.2 Median age for White alone residents40.2 42.1 33.2 Median age for Hispanic or Latino residents29.5 39.9
Owner/renter occupied households by race in Rocklin
House owners and renters - White residents 12,578 73.7% Owner occupied4,497 26.3% Renter occupiedHouse owners and renters - Black or African American residents 208 33.4% Owner occupied414 66.6% Renter occupiedHouse owners and renters - American Indian / Alaska Native residents 88 53.7% Owner occupied75 46.3% Renter occupiedHouse owners and renters - Asian residents 1,744 68.4% Owner occupied806 31.6% Renter occupiedHouse owners and renters - Native Hawaiian / Pacific Islander residents 5 100.0% Owner occupiedHouse owners and renters - Other race residents 193 46.3% Owner occupied224 53.7% Renter occupiedHouse owners and renters - Two or more races residents 1,019 45.7% Owner occupied1,209 54.3% Renter occupiedHouse owners and renters - White alone residents 12,672 74.8% Owner occupied4,270 25.2% Renter occupiedHouse owners and renters - Hispanic or Latino residents 1,299 50.6% Owner occupied1,267 49.4% Renter occupied
Language usage in Rocklin
English speakers - Total 85.5% of residents of Rocklin speak English at home.
4.8% of residents speak Spanish at home 2,250 76.3% Speak English very well697 23.7% Speak English less than very well10.4% of residents speak other language at home 4,668 72.6% Speak English very well1,758 27.4% Speak English less than very well
English speakers - Born in the United States 94.4% of residents of Rocklin speak English at home.
2.5% of residents speak Spanish at home 281 91.5% Speak English very well26 8.5% Speak English less than very well3.1% of residents speak other language at home 341 89.3% Speak English very well41 10.7% Speak English less than very well
English speakers - Native, born elsewhere 74.7% of residents of Rocklin speak English at home.
15.9% of residents speak Spanish at home 159 100.0% Speak English very well9.5% of residents speak other language at home 70 73.7% Speak English very well25 26.3% Speak English less than very well
English speakers - Foreign-born 25.3% of residents of Rocklin speak English at home.
15.9% of residents speak Spanish at home 644 53.0% Speak English very well571 47.0% Speak English less than very well62.2% of residents speak other language at home 3,262 68.4% Speak English very well1,507 31.6% Speak English less than very well
White (Caucasian) - Speak only English Native:
100.0% (41,368)Foreign-born:
42.8% (874)
White (Caucasian) - Speak another language Native:
2.8% (1,151)Foreign-born:
64.7% (1,320)
Black or African American - Speak only English Native:
96.3% (878)Foreign-born:
45.4% (77)
Black or African American - Speak another language Native:
3.5% (32)Foreign-born:
52.9% (90)
Asian - Speak only English Native:
56.5% (1,853)Foreign-born:
7.8% (366)
Asian - Speak another language Native:
43.4% (1,425)Foreign-born:
91.8% (4,302)
Other race - Speak only English Native:
78.7% (1,162)Foreign-born:
54.0% (313)
Other race - Speak another language Native:
28.5% (421)Foreign-born:
61.5% (357)
Two or more races - Speak only English Native:
72.4% (5,931)Foreign-born:
17.1% (99)
Two or more races - Speak another language Native:
11.6% (953)Foreign-born:
76.1% (439)
White alone - Speak only English Native:
97.2% (41,062)Foreign-born:
45.5% (834)
White alone - Speak another language Native:
2.7% (1,122)Foreign-born:
54.2% (992)
Hispanic or Latino - Speak only English Native:
87.4% (5,337)Foreign-born:
11.8% (158)
Hispanic or Latino - Speak another language Native:
16.2% (992)Foreign-born:
89.8% (1,197)
Foreign-born residents in Rocklin 7,885 residents are foreign born (6.6% Asia , 2.5% Latin America , 2.0% Europe ).
This city:
11.7%California:
100.0%
Marital status for residents in Rocklin Marital status - White (Caucasian) population 15 years and over
Males 31.1% Never married60.2% Now married0.3% Separated1.7% Widowed6.7% DivorcedFemales 19.0% Never married56.5% Now married1.3% Separated10.8% Widowed12.4% DivorcedWomen who gave birth in the past 12 months Now married:
87.3% (388)Unmarried:
12.7% (56)
Women who did not give birth in the past 12 months Now married:
56.3% (4,899)Unmarried:
43.7% (3,808)
Marital status - Black or African American population 15 years and over
Males 30.4% Never married56.0% Now married0.0% Separated0.0% Widowed13.5% DivorcedFemales 31.8% Never married41.9% Now married5.9% Separated5.0% Widowed15.4% DivorcedWomen who gave birth in the past 12 months Now married:
100.0% (33)Unmarried:
0.0% (0)
Women who did not give birth in the past 12 months Now married:
37.0% (72)Unmarried:
63.0% (123)
Marital status - American Indian / Alaska Native population 15 years and over
Males 20.5% Never married51.2% Now married0.0% Separated0.0% Widowed28.3% DivorcedFemales 58.7% Never married28.6% Now married0.0% Separated7.1% Widowed5.6% DivorcedWomen who did not give birth in the past 12 months Now married:
9.8% (6)Unmarried:
90.2% (54)
Marital status - Asian population 15 years and over
Males 25.6% Never married72.3% Now married0.4% Separated0.0% Widowed1.7% DivorcedFemales 19.4% Never married68.8% Now married0.3% Separated6.2% Widowed5.3% DivorcedWomen who gave birth in the past 12 months Now married:
100.0% (60)Unmarried:
0.0% (0)
Women who did not give birth in the past 12 months Now married:
66.9% (1,276)Unmarried:
33.1% (632)
Marital status - Native Hawaiian / Pacific Islander population 15 years and over
Males 100.0% Never married0.0% Now married0.0% Separated0.0% Widowed0.0% DivorcedFemales 6.1% Never married10.2% Now married0.0% Separated0.0% Widowed83.7% DivorcedWomen who did not give birth in the past 12 months Now married:
0.0% (0)Unmarried:
100.0% (42)
Marital status - Other race population 15 years and over
Males 39.2% Never married55.9% Now married4.9% Separated0.0% Widowed0.0% DivorcedFemales 35.7% Never married41.8% Now married4.2% Separated3.0% Widowed15.2% DivorcedWomen who did not give birth in the past 12 months Now married:
45.1% (306)Unmarried:
54.9% (372)
Marital status - Two or more races population 15 years and over
Males 59.7% Never married30.3% Now married1.9% Separated0.8% Widowed7.4% DivorcedFemales 54.2% Never married31.9% Now married0.0% Separated4.3% Widowed9.7% DivorcedWomen who gave birth in the past 12 months Now married:
100.0% (55)Unmarried:
0.0% (0)
Women who did not give birth in the past 12 months Now married:
29.8% (1,000)Unmarried:
70.2% (2,353)
Marital status - White alone, not Hispanic / Latino population 15 years and over
Males 28.6% Never married62.4% Now married0.3% Separated1.9% Widowed6.7% DivorcedFemales 17.0% Never married56.6% Now married1.5% Separated11.9% Widowed13.0% DivorcedWomen who gave birth in the past 12 months Now married:
100.0% (382)Unmarried:
0.0% (0)
Women who did not give birth in the past 12 months Now married:
56.3% (4,924)Unmarried:
43.7% (3,829)
Marital status - Hispanic or Latino population 15 years and over
Males 46.5% Never married41.8% Now married3.2% Separated0.5% Widowed8.0% DivorcedFemales 34.3% Never married45.8% Now married2.0% Separated3.9% Widowed14.0% DivorcedWomen who gave birth in the past 12 months Now married:
73.8% (33)Unmarried:
26.2% (12)
Women who did not give birth in the past 12 months Now married:
47.0% (1,216)Unmarried:
53.0% (1,373)
Ancestries in Rocklin
2,599 8.6% European2,088 6.9% German1,965 6.5% English1,270 4.2% Italian1,140 3.8% American1,075 3.5% Irish389 1.3% Scottish360 1.2% French350 1.2% Norwegian321 1.1% Swedish298 1.0% Portuguese284 0.9% Iranian239 0.8% Scotch-Irish239 0.8% Northern European227 0.7% Russian222 0.7% Romanian218 0.7% Arab217 0.7% British216 0.7% Polish189 0.6% African139 0.5% Afghan123 0.4% Ukrainian122 0.4% Dutch113 0.4% Danish99 0.3% Belizean94 0.3% French Canadian93 0.3% Egyptian92 0.3% Turkish74 0.2% Czech74 0.2% Greek57 0.2% Eastern European54 0.2% Scandinavian52 0.2% Croatian50 0.2% Hungarian49 0.2% Welsh42 0.1% Brazilian39 0.1% Assyrian36 0.1% Canadian34 0.1% Swiss33 0.1% Armenian33 0.1% Slovene23 0.08% Basque21 0.07% Yugoslavian20 0.07% Palestinian16 0.05% Estonian15 0.05% Belgian13 0.04% Ethiopian12 0.04% Lithuanian12 0.04% Finnish11 0.04% Haitian9 0.03% Slavic9 0.03% Lebanese8 0.03% Czechoslovakian7 0.02% Austrian6 0.02% Australian4 0.01% Slovak3 0.01% Pennsylvania German
Geographical mobility in Rocklin Same house 1 year ago 37,992 86.2% White (Caucasian)831 72.3% Black or African American434 97.3% American Indian / Alaska Native6,265 82.9% Asian50 80.3% Native Hawaiian / Pacific Islander1,703 82.4% Other race7,952 74.9% Two or more races37,056 85.6% White alone, not Hispanic / Latino6,619 80.0% Hispanic or LatinoMoved within same county 1,638 3.7% White / Caucasian144 12.5% Black or African American224 3.0% Asian181 8.8% Other race1,167 11.0% Two or more races2,500 5.8% White alone, not Hispanic / Latino572 6.9% Hispanic or LatinoMoved within same state 3,622 8.2% White / Caucasian47 4.1% Black or African American25 5.7% American Indian / Alaska Native400 5.3% Asian13 21.1% Native Hawaiian / Pacific Islander133 6.4% Other race748 7.1% Two or more races2,983 6.9% White alone, not Hispanic / Latino880 10.6% Hispanic or LatinoMoved from different state 843 1.9% White / Caucasian111 9.7% Black or African American305 4.0% Asian177 1.7% Two or more races687 1.6% White alone, not Hispanic / Latino147 1.8% Hispanic or LatinoMoved from abroad 242 0.5% White365 4.8% Asian18 0.9% Other race21 0.2% Two or more races145 0.3% White alone, not Hispanic / Latino31 0.4% Hispanic or Latino
Children Nativity (place of birth) in Rocklin
Children under 6 years - Living with two parents Both parents native 2,363 100.0% NativeBoth parents foreign-born 565 90.0% Native63 10.0% Foreign-bornOne native, one foreign-born parent 539 99.4% Native3 0.6% Foreign-bornChildren under 6 years - Living with one parent Native parent 313 97.8% Native7 2.2% Foreign-bornForeign-born parent 29 100.0% NativeChildren 6 to 17 years - Living with two parents Both parents native 7,149 100.0% NativeBoth parents foreign-born 1,386 79.0% Native369 21.0% Foreign-bornOne native, one foreign-born parent 1,130 95.9% Native49 4.1% Foreign-bornChildren 6 to 17 years - Living with one parent Native parent 2,001 100.0% NativeForeign-born parent 390 60.4% Native256 39.6% Foreign-born
Place of birth for residents in Rocklin
Grandparents responsible for own grandchildren in Rocklin
Grandparents (30 to 59 years) White / Caucasian 32 29.2% Responsible for grandchildren77 70.8% Not responsible for grandchildrenBlack or African American 23 100.0% Not responsible for grandchildrenAsian 13 100.0% Responsible for grandchildrenTwo or more races 4 12.5% Responsible for grandchildren29 87.5% Not responsible for grandchildrenWhite alone, not Hispanic / Latino 32 31.8% Responsible for grandchildren70 68.2% Not responsible for grandchildrenHispanic or Latino 2 5.5% Responsible for grandchildren28 94.5% Not responsible for grandchildrenGrandparents (60 years and over) White / Caucasian 138 28.6% Responsible for grandchildren346 71.4% Not responsible for grandchildrenAsian 20 6.7% Responsible for grandchildren283 93.3% Not responsible for grandchildrenTwo or more races 117 100.0% Not responsible for grandchildrenWhite alone, not Hispanic / Latino 166 27.1% Responsible for grandchildren448 72.9% Not responsible for grandchildrenHispanic or Latino 42 100.0% Not responsible for grandchildren