Races in Rolling Hills Estates, California (CA) Detailed Stats
Data:
Races - White alone (%)
Races - White alone (% change since 2000)
Races - Black alone (%)
Races - Black alone (% change since 2000)
Races - American Indian alone (%)
Races - American Indian alone (% change since 2000)
Races - Asian alone (%)
Races - Asian alone (% change since 2000)
Races - Hispanic (%)
Races - Hispanic (% change since 2000)
Races - Native Hawaiian and Other Pacific Islander alone (%)
Races - Native Hawaiian and Other Pacific Islander alone (% change since 2000)
Races - Two or more races(%)
Races - Two or more races(% change since 2000)
Races - Other race alone (%)
Races - Other race alone (% change since 2000)
Racial diversity
Place of birth - Born in state of residence (%)
Place of birth - Born in state of residence (%) - White
Place of birth - Born in state of residence (%) - Black or African American
Place of birth - Born in state of residence (%) - Asian
Place of birth - Born in state of residence (%) - Hispanic or Latino
Place of birth - Born in state of residence (%) - American Indian and Alaska Native
Place of birth - Born in state of residence (%) - Multirace
Place of birth - Born in state of residence (%) - Other Race
Place of birth - Born in other state (%)
Place of birth - Born in other state (%) - White
Place of birth - Born in other state (%) - Black or African American
Place of birth - Born in other state (%) - Asian
Place of birth - Born in other state (%) - Hispanic or Latino
Place of birth - Born in other state (%) - American Indian and Alaska Native
Place of birth - Born in other state (%) - Multirace
Place of birth - Born in other state (%) - Other Race
Place of birth - Native, outside of US (%)
Place of birth - Native, outside of US (%) - White
Place of birth - Native, outside of US (%) - Black or African American
Place of birth - Native, outside of US (%) - Asian
Place of birth - Native, outside of US (%) - Hispanic or Latino
Place of birth - Native, outside of US (%) - American Indian and Alaska Native
Place of birth - Native, outside of US (%) - Multirace
Place of birth - Native, outside of US (%) - Other Race
Place of birth - Foreign born (%)
Place of birth - Foreign born (%) - White
Place of birth - Foreign born (%) - Black or African American
Place of birth - Foreign born (%) - Asian
Place of birth - Foreign born (%) - Hispanic or Latino
Place of birth - Foreign born (%) - American Indian and Alaska Native
Place of birth - Foreign born (%) - Multirace
Place of birth - Foreign born (%) - Other Race
Residents speaking English at home (%)
Residents speaking English at home - Born in the United States (%)
Residents speaking English at home - Native, born elsewhere (%)
Residents speaking English at home - Foreign born (%)
Residents speaking Spanish at home (%)
Residents speaking Spanish at home - Born in the United States (%)
Residents speaking Spanish at home - Native, born elsewhere (%)
Residents speaking Spanish at home - Foreign born (%)
Residents speaking other language at home (%)
Residents speaking other language at home - Born in the United States (%)
Residents speaking other language at home - Native, born elsewhere (%)
Residents speaking other language at home - Foreign born (%)
Marital status - Never married (%)
Marital status - Now married (%)
Marital status - Separated (%)
Marital status - Widowed (%)
Marital status - Divorced (%)
Ancestries Reported - Arab (%)
Ancestries Reported - Czech (%)
Ancestries Reported - Danish (%)
Ancestries Reported - Dutch (%)
Ancestries Reported - English (%)
Ancestries Reported - French (%)
Ancestries Reported - French Canadian (%)
Ancestries Reported - German (%)
Ancestries Reported - Greek (%)
Ancestries Reported - Hungarian (%)
Ancestries Reported - Irish (%)
Ancestries Reported - Italian (%)
Ancestries Reported - Lithuanian (%)
Ancestries Reported - Norwegian (%)
Ancestries Reported - Polish (%)
Ancestries Reported - Portuguese (%)
Ancestries Reported - Russian (%)
Ancestries Reported - Scotch-Irish (%)
Ancestries Reported - Scottish (%)
Ancestries Reported - Slovak (%)
Ancestries Reported - Subsaharan African (%)
Ancestries Reported - Swedish (%)
Ancestries Reported - Swiss (%)
Ancestries Reported - Ukrainian (%)
Ancestries Reported - United States (%)
Ancestries Reported - Welsh (%)
Ancestries Reported - West Indian (%)
Ancestries Reported - Other (%)
Geographical mobility - Same house 1 year ago (%)
Geographical mobility - Same house 1 year ago (%) - White
Geographical mobility - Same house 1 year ago (%) - Black or African American
Geographical mobility - Same house 1 year ago (%) - Asian
Geographical mobility - Same house 1 year ago (%) - Hispanic or Latino
Geographical mobility - Same house 1 year ago (%) - American Indian and Alaska Native
Geographical mobility - Same house 1 year ago (%) - Multirace
Geographical mobility - Same house 1 year ago (%) - Other Race
Geographical mobility - Moved within same county (%)
Geographical mobility - Moved within same county (%) - White
Geographical mobility - Moved within same county (%) - Black or African American
Geographical mobility - Moved within same county (%) - Asian
Geographical mobility - Moved within same county (%) - Hispanic or Latino
Geographical mobility - Moved within same county (%) - American Indian and Alaska Native
Geographical mobility - Moved within same county (%) - Multirace
Geographical mobility - Moved within same county (%) - Other Race
Geographical mobility - Moved from different county within same state (%)
Geographical mobility - Moved from different county within same state (%) - White
Geographical mobility - Moved from different county within same state (%) - Black or African American
Geographical mobility - Moved from different county within same state (%) - Asian
Geographical mobility - Moved from different county within same state (%) - Hispanic or Latino
Geographical mobility - Moved from different county within same state (%) - American Indian and Alaska Native
Geographical mobility - Moved from different county within same state (%) - Multirace
Geographical mobility - Moved from different county within same state (%) - Other Race
Geographical mobility - Moved from different state (%)
Geographical mobility - Moved from different state (%) - White
Geographical mobility - Moved from different state (%) - Black or African American
Geographical mobility - Moved from different state (%) - Asian
Geographical mobility - Moved from different state (%) - Hispanic or Latino
Geographical mobility - Moved from different state (%) - American Indian and Alaska Native
Geographical mobility - Moved from different state (%) - Multirace
Geographical mobility - Moved from different state (%) - Other Race
Geographical mobility - Moved from abroad (%)
Geographical mobility - Moved from abroad (%) - White
Geographical mobility - Moved from abroad (%) - Black or African American
Geographical mobility - Moved from abroad (%) - Asian
Geographical mobility - Moved from abroad (%) - Hispanic or Latino
Geographical mobility - Moved from abroad (%) - American Indian and Alaska Native
Geographical mobility - Moved from abroad (%) - Multirace
Geographical mobility - Moved from abroad (%) - Other Race
Place of birth for the foreign-born population - Ireland (%)
Place of birth for the foreign-born population - Denmark (%)
Place of birth for the foreign-born population - Norway (%)
Place of birth for the foreign-born population - Sweden (%)
Place of birth for the foreign-born population - United Kingdom (%)
Place of birth for the foreign-born population - England (%)
Place of birth for the foreign-born population - Scotland (%)
Place of birth for the foreign-born population - Other Northern Europe (%)
Place of birth for the foreign-born population - Austria (%)
Place of birth for the foreign-born population - Belgium (%)
Place of birth for the foreign-born population - France (%)
Place of birth for the foreign-born population - Germany (%)
Place of birth for the foreign-born population - Netherlands (%)
Place of birth for the foreign-born population - Switzerland (%)
Place of birth for the foreign-born population - Other Western Europe (%)
Place of birth for the foreign-born population - Greece (%)
Place of birth for the foreign-born population - Italy (%)
Place of birth for the foreign-born population - Portugal (%)
Place of birth for the foreign-born population - Spain (%)
Place of birth for the foreign-born population - Other Southern Europe (%)
Place of birth for the foreign-born population - Albania (%)
Place of birth for the foreign-born population - Belarus (%)
Place of birth for the foreign-born population - Bosnia and Herzegovina (%)
Place of birth for the foreign-born population - Bulgaria (%)
Place of birth for the foreign-born population - Croatia (%)
Place of birth for the foreign-born population - Czechoslovakia (%)
Place of birth for the foreign-born population - Hungary (%)
Place of birth for the foreign-born population - Latvia (%)
Place of birth for the foreign-born population - Lithuania (%)
Place of birth for the foreign-born population - North Macedonia (Macedonia) (%)
Place of birth for the foreign-born population - Moldova (%)
Place of birth for the foreign-born population - Poland (%)
Place of birth for the foreign-born population - Romania (%)
Place of birth for the foreign-born population - Russia (%)
Place of birth for the foreign-born population - Serbia (%)
Place of birth for the foreign-born population - Ukraine (%)
Place of birth for the foreign-born population - Other Eastern Europe (%)
Place of birth for the foreign-born population - China (%)
Place of birth for the foreign-born population - Hong Kong (%)
Place of birth for the foreign-born population - Taiwan (%)
Place of birth for the foreign-born population - Japan (%)
Place of birth for the foreign-born population - Korea (%)
Place of birth for the foreign-born population - Other Eastern Asia (%)
Place of birth for the foreign-born population - Afghanistan (%)
Place of birth for the foreign-born population - Bangladesh (%)
Place of birth for the foreign-born population - India (%)
Place of birth for the foreign-born population - Iran (%)
Place of birth for the foreign-born population - Kazakhstan (%)
Place of birth for the foreign-born population - Nepal (%)
Place of birth for the foreign-born population - Pakistan (%)
Place of birth for the foreign-born population - Sri Lanka (%)
Place of birth for the foreign-born population - Uzbekistan (%)
Place of birth for the foreign-born population - Other South Central Asia (%)
Place of birth for the foreign-born population - Burma (%)
Place of birth for the foreign-born population - Cambodia (%)
Place of birth for the foreign-born population - Indonesia (%)
Place of birth for the foreign-born population - Laos (%)
Place of birth for the foreign-born population - Malaysia (%)
Place of birth for the foreign-born population - Philippines (%)
Place of birth for the foreign-born population - Singapore (%)
Place of birth for the foreign-born population - Thailand (%)
Place of birth for the foreign-born population - Vietnam (%)
Place of birth for the foreign-born population - Other South Eastern Asia (%)
Place of birth for the foreign-born population - Armenia (%)
Place of birth for the foreign-born population - Iraq (%)
Place of birth for the foreign-born population - Israel (%)
Place of birth for the foreign-born population - Jordan (%)
Place of birth for the foreign-born population - Kuwait (%)
Place of birth for the foreign-born population - Lebanon (%)
Place of birth for the foreign-born population - Saudi Arabia (%)
Place of birth for the foreign-born population - Syria (%)
Place of birth for the foreign-born population - Turkey (%)
Place of birth for the foreign-born population - Yemen (%)
Place of birth for the foreign-born population - Other Western Asia (%)
Place of birth for the foreign-born population - Eritrea (%)
Place of birth for the foreign-born population - Ethiopia (%)
Place of birth for the foreign-born population - Kenya (%)
Place of birth for the foreign-born population - Somalia (%)
Place of birth for the foreign-born population - Uganda (%)
Place of birth for the foreign-born population - Zimbabwe (%)
Place of birth for the foreign-born population - Other Eastern Africa (%)
Place of birth for the foreign-born population - Cameroon (%)
Place of birth for the foreign-born population - Congo (%)
Place of birth for the foreign-born population - Democratic Republic of Congo (Zaire) (%)
Place of birth for the foreign-born population - Other Middle Africa (%)
Place of birth for the foreign-born population - Egypt (%)
Place of birth for the foreign-born population - Morocco (%)
Place of birth for the foreign-born population - Sudan (%)
Place of birth for the foreign-born population - Other Northern Africa (%)
Place of birth for the foreign-born population - South Africa (%)
Place of birth for the foreign-born population - Other Southern Africa (%)
Place of birth for the foreign-born population - Cabo Verde (%)
Place of birth for the foreign-born population - Ghana (%)
Place of birth for the foreign-born population - Liberia (%)
Place of birth for the foreign-born population - Nigeria (%)
Place of birth for the foreign-born population - Senegal (%)
Place of birth for the foreign-born population - Sierra Leone (%)
Place of birth for the foreign-born population - Other Western Africa (%)
Place of birth for the foreign-born population - Australia (%)
Place of birth for the foreign-born population - New Zealand (%)
Place of birth for the foreign-born population - Fiji (%)
Place of birth for the foreign-born population - Micronesia (%)
Place of birth for the foreign-born population - Bahamas (%)
Place of birth for the foreign-born population - Barbados (%)
Place of birth for the foreign-born population - Cuba (%)
Place of birth for the foreign-born population - Dominica (%)
Place of birth for the foreign-born population - Dominican Republic (%)
Place of birth for the foreign-born population - Grenada (%)
Place of birth for the foreign-born population - Haiti (%)
Place of birth for the foreign-born population - Jamaica (%)
Place of birth for the foreign-born population - St. Vincent and the Grenadines (%)
Place of birth for the foreign-born population - Trinidad and Tobago (%)
Place of birth for the foreign-born population - West Indies (%)
Place of birth for the foreign-born population - Other Caribbean (%)
Place of birth for the foreign-born population - Belize (%)
Place of birth for the foreign-born population - Costa Rica (%)
Place of birth for the foreign-born population - El Salvador (%)
Place of birth for the foreign-born population - Guatemala (%)
Place of birth for the foreign-born population - Honduras (%)
Place of birth for the foreign-born population - Mexico (%)
Place of birth for the foreign-born population - Nicaragua (%)
Place of birth for the foreign-born population - Panama (%)
Place of birth for the foreign-born population - Other Central America (%)
Place of birth for the foreign-born population - Argentina (%)
Place of birth for the foreign-born population - Bolivia (%)
Place of birth for the foreign-born population - Brazil (%)
Place of birth for the foreign-born population - Chile (%)
Place of birth for the foreign-born population - Colombia (%)
Place of birth for the foreign-born population - Ecuador (%)
Place of birth for the foreign-born population - Guyana (%)
Place of birth for the foreign-born population - Peru (%)
Place of birth for the foreign-born population - Uruguay (%)
Place of birth for the foreign-born population - Venezuela (%)
Place of birth for the foreign-born population - Other South America (%)
Place of birth for the foreign-born population - Canada (%)
Place of birth for the foreign-born population - Other Northern America (%)
Place of birth for the foreign-born population - Other (%)
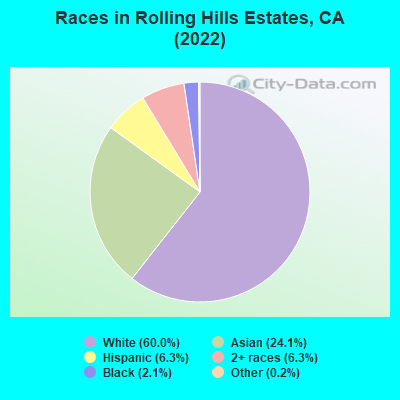
According to 2022 data, the most numerous races in Rolling Hills Estates, CA are Hispanic (850 residents), White alone (4,172 residents), and Asian alone (2,457 residents). 68.9% of Rolling Hills Estates residents speak English at home. 26.2% of Rolling Hills Estates, CA residents are foreign-born (19.0% born in Asia, 3.5% born in Europe, 2.9% born in Latin America), which is about the same as the foreign-born rate of 26.0% across the entire state of California.
Race distribution in Rolling Hills Estates
2000 2022
15,816,790 46.7% White alone 10,966,556 32.4% Hispanic 3,648,860 10.8% Asian alone 2,181,926 6.4% Black alone 903,115 2.7% Two or more races 178,984 0.5% American Indian alone 103,736 0.3% Native Hawaiian and Other 71,681 0.2% Other race alone
15,732,184 40.3% Hispanic 13,160,426 33.7% White alone 5,957,867 15.3% Asian alone 2,025,218 5.2% Black alone 1,663,222 4.3% Two or more races 251,618 0.6% Other race alone 135,777 0.3% Native Hawaiian and Other 103,030 0.3% American Indian alone
Income and house value in Rolling Hills Estates Median household income in 2022 $199,127 White non-Hispanic householders$120,142 Black householders$33,705 American Indian and Alaska Native householders$199,280 Asian householdersover $200,000 Some other race householdersover $200,000 Two or more races householders$178,236 Hispanic or Latino race householdersMedian 2022 house value over $1,000,000 White Non-Hispanic householdersover $1,000,000 Black or African American householders$674,868 American Indian or Alaska Native householders over $1,000,000 Asian householdersover $1,000,000 Two or more races householdersover $1,000,000 Hispanic or Latino householders
Median age by race in Rolling Hills Estates
57.6 Median age for White residents57.6 57.4 52.0 Median age for Black or African American residents63.8 17.2 89.9 Median age for American Indian / Alaska Native residents46.8 Median age for Asian residents43.1 49.4 40.5 Median age for Other race residents44.0 36.6 27.0 Median age for Two or more races residents27.8 23.2 55.4 Median age for White alone residents55.1 55.9 43.1 Median age for Hispanic or Latino residents43.6 41.9
Owner/renter occupied households by race in Rolling Hills Estates
House owners and renters - White residents 1,651 92.2% Owner occupied140 7.8% Renter occupiedHouse owners and renters - Black or African American residents 25 55.5% Owner occupied20 44.5% Renter occupiedHouse owners and renters - American Indian / Alaska Native residents 9 100.0% Owner occupiedHouse owners and renters - Asian residents 854 95.9% Owner occupied36 4.1% Renter occupiedHouse owners and renters - Other race residents 39 100.0% Owner occupiedHouse owners and renters - Two or more races residents 103 100.0% Owner occupiedHouse owners and renters - White alone residents 1,617 92.7% Owner occupied128 7.3% Renter occupiedHouse owners and renters - Hispanic or Latino residents 180 83.6% Owner occupied35 16.4% Renter occupied
Language usage in Rolling Hills Estates
English speakers - Total 68.9% of residents of Rolling Hills Estates speak English at home.
6.4% of residents speak Spanish at home 418 83.4% Speak English very well83 16.6% Speak English less than very well25.3% of residents speak other language at home 1,283 64.7% Speak English very well701 35.3% Speak English less than very well
English speakers - Born in the United States 90.7% of residents of Rolling Hills Estates speak English at home.
2.9% of residents speak Spanish at home 51 92.7% Speak English very well4 7.3% Speak English less than very well6.6% of residents speak other language at home 107 86.3% Speak English very well17 13.7% Speak English less than very well
English speakers - Native, born elsewhere 51.0% of residents of Rolling Hills Estates speak English at home.
4.2% of residents speak Spanish at home 4 100.0% Speak English very well41.7% of residents speak other language at home 40 100.0% Speak English very well
English speakers - Foreign-born 21.2% of residents of Rolling Hills Estates speak English at home.
8.7% of residents speak Spanish at home 113 62.8% Speak English very well67 37.2% Speak English less than very well73.2% of residents speak other language at home 864 57.0% Speak English very well652 43.0% Speak English less than very well
White (Caucasian) - Speak only English Native:
95.6% (3,555)Foreign-born:
31.1% (115)
White (Caucasian) - Speak another language Native:
6.6% (244)Foreign-born:
72.3% (267)
Black or African American - Speak only English Native:
94.0% (128)Foreign-born:
87.5% (17)
Asian - Speak only English Native:
68.4% (603)Foreign-born:
19.1% (271)
Asian - Speak another language Native:
32.4% (285)Foreign-born:
81.8% (1,162)
Other race - Speak another language Native:
75.5% (123)Foreign-born:
98.5% (99)
Two or more races - Speak only English Native:
72.2% (605)Foreign-born:
33.2% (33)
Two or more races - Speak another language Native:
12.3% (103)Foreign-born:
44.8% (45)
White alone - Speak only English Native:
94.4% (3,460)Foreign-born:
27.5% (119)
White alone - Speak another language Native:
5.6% (204)Foreign-born:
72.4% (313)
Hispanic or Latino - Speak only English Native:
52.7% (307)Foreign-born:
4.2% (8)
Hispanic or Latino - Speak another language Native:
48.4% (281)Foreign-born:
95.5% (193)
Foreign-born residents in Rolling Hills Estates 2,134 residents are foreign born (19.0% Asia , 3.5% Europe , 2.9% Latin America ).
This city:
26.2%California:
100.0%
Marital status for residents in Rolling Hills Estates Marital status - White (Caucasian) population 15 years and over
Males 16.7% Never married71.9% Now married0.5% Separated3.4% Widowed7.4% DivorcedFemales 15.3% Never married64.3% Now married0.8% Separated11.0% Widowed8.6% DivorcedWomen who gave birth in the past 12 months Now married:
100.0% (18)Unmarried:
0.0% (0)
Women who did not give birth in the past 12 months Now married:
58.6% (353)Unmarried:
41.4% (249)
Marital status - Black or African American population 15 years and over
Males 0.0% Never married77.4% Now married0.0% Separated0.0% Widowed22.6% DivorcedFemales 25.0% Never married47.1% Now married27.9% Separated0.0% Widowed0.0% DivorcedWomen who did not give birth in the past 12 months Now married:
52.8% (18)Unmarried:
47.2% (16)
Marital status - Asian population 15 years and over
Males 17.6% Never married81.4% Now married0.0% Separated0.5% Widowed0.5% DivorcedFemales 9.7% Never married73.0% Now married0.7% Separated9.8% Widowed6.8% DivorcedWomen who gave birth in the past 12 months Now married:
100.0% (29)Unmarried:
0.0% (0)
Women who did not give birth in the past 12 months Now married:
71.5% (334)Unmarried:
28.5% (133)
Marital status - Other race population 15 years and over
Males 46.4% Never married49.1% Now married4.5% Separated0.0% Widowed0.0% DivorcedFemales 23.4% Never married55.3% Now married0.0% Separated0.0% Widowed21.3% DivorcedWomen who did not give birth in the past 12 months Now married:
39.1% (29)Unmarried:
60.9% (45)
Marital status - Two or more races population 15 years and over
Males 41.6% Never married52.8% Now married0.0% Separated5.6% Widowed0.0% DivorcedFemales 61.7% Never married32.7% Now married0.0% Separated0.0% Widowed5.6% DivorcedWomen who did not give birth in the past 12 months Now married:
19.5% (47)Unmarried:
80.5% (194)
Marital status - White alone, not Hispanic / Latino population 15 years and over
Males 16.5% Never married72.5% Now married0.6% Separated3.8% Widowed6.6% DivorcedFemales 14.9% Never married63.7% Now married0.9% Separated12.3% Widowed8.2% DivorcedWomen who gave birth in the past 12 months Now married:
100.0% (5)Unmarried:
0.0% (0)
Women who did not give birth in the past 12 months Now married:
60.4% (377)Unmarried:
39.6% (248)
Marital status - Hispanic or Latino population 15 years and over
Males 30.1% Never married59.0% Now married1.5% Separated0.0% Widowed9.3% DivorcedFemales 17.9% Never married67.2% Now married0.0% Separated0.0% Widowed14.9% DivorcedWomen who gave birth in the past 12 months Now married:
100.0% (17)Unmarried:
0.0% (0)
Women who did not give birth in the past 12 months Now married:
45.1% (65)Unmarried:
54.9% (79)
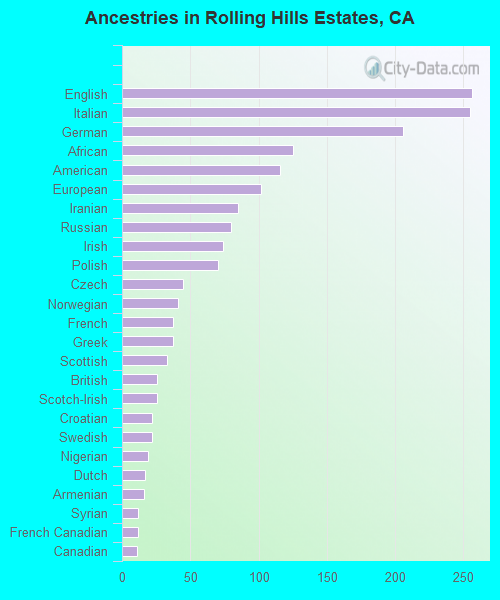
Ancestries in Rolling Hills Estates
245 5.4% English235 5.2% Italian202 4.5% German155 3.4% Iranian128 2.8% American114 2.5% Irish96 2.1% European75 1.7% Dutch65 1.4% Greek55 1.2% Scottish51 1.1% Polish45 1.0% Norwegian41 0.9% British37 0.8% Czech31 0.7% French31 0.7% Russian25 0.6% Jamaican24 0.5% Swedish23 0.5% Eastern European20 0.4% Welsh16 0.4% Armenian16 0.4% Austrian16 0.4% Croatian16 0.4% Hungarian15 0.3% Northern European12 0.3% Lithuanian10 0.2% Romanian9 0.2% Lebanese8 0.2% Canadian6 0.1% Trinidadian and Tobagonian6 0.1% Scotch-Irish5 0.1% Ukrainian4 0.09% French Canadian3 0.07% Danish2 0.04% Assyrian2 0.04% Albanian
Children Nativity (place of birth) in Rolling Hills Estates
Children under 6 years - Living with two parents Both parents native 261 99.9% Native0 0.1% Foreign-bornBoth parents foreign-born 96 85.3% Native17 14.7% Foreign-bornOne native, one foreign-born parent 92 100.0% NativeChildren under 6 years - Living with one parent Native parent 12 100.0% NativeChildren 6 to 17 years - Living with two parents Both parents native 677 98.8% Native8 1.2% Foreign-bornBoth parents foreign-born 169 62.8% Native100 37.2% Foreign-bornOne native, one foreign-born parent 232 91.0% Native23 9.0% Foreign-bornChildren 6 to 17 years - Living with one parent Native parent 13 100.0% NativeForeign-born parent 37 55.6% Native30 44.4% Foreign-born
Grandparents responsible for own grandchildren in Rolling Hills Estates
Grandparents (30 to 59 years) Asian 17 100.0% Responsible for grandchildrenGrandparents (60 years and over) Asian 14 41.7% Responsible for grandchildren19 58.3% Not responsible for grandchildren