Races in Round Lake Beach, Illinois (IL) Detailed Stats
Data:
Races - White alone (%)
Races - White alone (% change since 2000)
Races - Black alone (%)
Races - Black alone (% change since 2000)
Races - American Indian alone (%)
Races - American Indian alone (% change since 2000)
Races - Asian alone (%)
Races - Asian alone (% change since 2000)
Races - Hispanic (%)
Races - Hispanic (% change since 2000)
Races - Native Hawaiian and Other Pacific Islander alone (%)
Races - Native Hawaiian and Other Pacific Islander alone (% change since 2000)
Races - Two or more races(%)
Races - Two or more races(% change since 2000)
Races - Other race alone (%)
Races - Other race alone (% change since 2000)
Racial diversity
Place of birth - Born in state of residence (%)
Place of birth - Born in state of residence (%) - White
Place of birth - Born in state of residence (%) - Black or African American
Place of birth - Born in state of residence (%) - Asian
Place of birth - Born in state of residence (%) - Hispanic or Latino
Place of birth - Born in state of residence (%) - American Indian and Alaska Native
Place of birth - Born in state of residence (%) - Multirace
Place of birth - Born in state of residence (%) - Other Race
Place of birth - Born in other state (%)
Place of birth - Born in other state (%) - White
Place of birth - Born in other state (%) - Black or African American
Place of birth - Born in other state (%) - Asian
Place of birth - Born in other state (%) - Hispanic or Latino
Place of birth - Born in other state (%) - American Indian and Alaska Native
Place of birth - Born in other state (%) - Multirace
Place of birth - Born in other state (%) - Other Race
Place of birth - Native, outside of US (%)
Place of birth - Native, outside of US (%) - White
Place of birth - Native, outside of US (%) - Black or African American
Place of birth - Native, outside of US (%) - Asian
Place of birth - Native, outside of US (%) - Hispanic or Latino
Place of birth - Native, outside of US (%) - American Indian and Alaska Native
Place of birth - Native, outside of US (%) - Multirace
Place of birth - Native, outside of US (%) - Other Race
Place of birth - Foreign born (%)
Place of birth - Foreign born (%) - White
Place of birth - Foreign born (%) - Black or African American
Place of birth - Foreign born (%) - Asian
Place of birth - Foreign born (%) - Hispanic or Latino
Place of birth - Foreign born (%) - American Indian and Alaska Native
Place of birth - Foreign born (%) - Multirace
Place of birth - Foreign born (%) - Other Race
Residents speaking English at home (%)
Residents speaking English at home - Born in the United States (%)
Residents speaking English at home - Native, born elsewhere (%)
Residents speaking English at home - Foreign born (%)
Residents speaking Spanish at home (%)
Residents speaking Spanish at home - Born in the United States (%)
Residents speaking Spanish at home - Native, born elsewhere (%)
Residents speaking Spanish at home - Foreign born (%)
Residents speaking other language at home (%)
Residents speaking other language at home - Born in the United States (%)
Residents speaking other language at home - Native, born elsewhere (%)
Residents speaking other language at home - Foreign born (%)
Marital status - Never married (%)
Marital status - Now married (%)
Marital status - Separated (%)
Marital status - Widowed (%)
Marital status - Divorced (%)
Ancestries Reported - Arab (%)
Ancestries Reported - Czech (%)
Ancestries Reported - Danish (%)
Ancestries Reported - Dutch (%)
Ancestries Reported - English (%)
Ancestries Reported - French (%)
Ancestries Reported - French Canadian (%)
Ancestries Reported - German (%)
Ancestries Reported - Greek (%)
Ancestries Reported - Hungarian (%)
Ancestries Reported - Irish (%)
Ancestries Reported - Italian (%)
Ancestries Reported - Lithuanian (%)
Ancestries Reported - Norwegian (%)
Ancestries Reported - Polish (%)
Ancestries Reported - Portuguese (%)
Ancestries Reported - Russian (%)
Ancestries Reported - Scotch-Irish (%)
Ancestries Reported - Scottish (%)
Ancestries Reported - Slovak (%)
Ancestries Reported - Subsaharan African (%)
Ancestries Reported - Swedish (%)
Ancestries Reported - Swiss (%)
Ancestries Reported - Ukrainian (%)
Ancestries Reported - United States (%)
Ancestries Reported - Welsh (%)
Ancestries Reported - West Indian (%)
Ancestries Reported - Other (%)
Geographical mobility - Same house 1 year ago (%)
Geographical mobility - Same house 1 year ago (%) - White
Geographical mobility - Same house 1 year ago (%) - Black or African American
Geographical mobility - Same house 1 year ago (%) - Asian
Geographical mobility - Same house 1 year ago (%) - Hispanic or Latino
Geographical mobility - Same house 1 year ago (%) - American Indian and Alaska Native
Geographical mobility - Same house 1 year ago (%) - Multirace
Geographical mobility - Same house 1 year ago (%) - Other Race
Geographical mobility - Moved within same county (%)
Geographical mobility - Moved within same county (%) - White
Geographical mobility - Moved within same county (%) - Black or African American
Geographical mobility - Moved within same county (%) - Asian
Geographical mobility - Moved within same county (%) - Hispanic or Latino
Geographical mobility - Moved within same county (%) - American Indian and Alaska Native
Geographical mobility - Moved within same county (%) - Multirace
Geographical mobility - Moved within same county (%) - Other Race
Geographical mobility - Moved from different county within same state (%)
Geographical mobility - Moved from different county within same state (%) - White
Geographical mobility - Moved from different county within same state (%) - Black or African American
Geographical mobility - Moved from different county within same state (%) - Asian
Geographical mobility - Moved from different county within same state (%) - Hispanic or Latino
Geographical mobility - Moved from different county within same state (%) - American Indian and Alaska Native
Geographical mobility - Moved from different county within same state (%) - Multirace
Geographical mobility - Moved from different county within same state (%) - Other Race
Geographical mobility - Moved from different state (%)
Geographical mobility - Moved from different state (%) - White
Geographical mobility - Moved from different state (%) - Black or African American
Geographical mobility - Moved from different state (%) - Asian
Geographical mobility - Moved from different state (%) - Hispanic or Latino
Geographical mobility - Moved from different state (%) - American Indian and Alaska Native
Geographical mobility - Moved from different state (%) - Multirace
Geographical mobility - Moved from different state (%) - Other Race
Geographical mobility - Moved from abroad (%)
Geographical mobility - Moved from abroad (%) - White
Geographical mobility - Moved from abroad (%) - Black or African American
Geographical mobility - Moved from abroad (%) - Asian
Geographical mobility - Moved from abroad (%) - Hispanic or Latino
Geographical mobility - Moved from abroad (%) - American Indian and Alaska Native
Geographical mobility - Moved from abroad (%) - Multirace
Geographical mobility - Moved from abroad (%) - Other Race
Place of birth for the foreign-born population - Ireland (%)
Place of birth for the foreign-born population - Denmark (%)
Place of birth for the foreign-born population - Norway (%)
Place of birth for the foreign-born population - Sweden (%)
Place of birth for the foreign-born population - United Kingdom (%)
Place of birth for the foreign-born population - England (%)
Place of birth for the foreign-born population - Scotland (%)
Place of birth for the foreign-born population - Other Northern Europe (%)
Place of birth for the foreign-born population - Austria (%)
Place of birth for the foreign-born population - Belgium (%)
Place of birth for the foreign-born population - France (%)
Place of birth for the foreign-born population - Germany (%)
Place of birth for the foreign-born population - Netherlands (%)
Place of birth for the foreign-born population - Switzerland (%)
Place of birth for the foreign-born population - Other Western Europe (%)
Place of birth for the foreign-born population - Greece (%)
Place of birth for the foreign-born population - Italy (%)
Place of birth for the foreign-born population - Portugal (%)
Place of birth for the foreign-born population - Spain (%)
Place of birth for the foreign-born population - Other Southern Europe (%)
Place of birth for the foreign-born population - Albania (%)
Place of birth for the foreign-born population - Belarus (%)
Place of birth for the foreign-born population - Bosnia and Herzegovina (%)
Place of birth for the foreign-born population - Bulgaria (%)
Place of birth for the foreign-born population - Croatia (%)
Place of birth for the foreign-born population - Czechoslovakia (%)
Place of birth for the foreign-born population - Hungary (%)
Place of birth for the foreign-born population - Latvia (%)
Place of birth for the foreign-born population - Lithuania (%)
Place of birth for the foreign-born population - North Macedonia (Macedonia) (%)
Place of birth for the foreign-born population - Moldova (%)
Place of birth for the foreign-born population - Poland (%)
Place of birth for the foreign-born population - Romania (%)
Place of birth for the foreign-born population - Russia (%)
Place of birth for the foreign-born population - Serbia (%)
Place of birth for the foreign-born population - Ukraine (%)
Place of birth for the foreign-born population - Other Eastern Europe (%)
Place of birth for the foreign-born population - China (%)
Place of birth for the foreign-born population - Hong Kong (%)
Place of birth for the foreign-born population - Taiwan (%)
Place of birth for the foreign-born population - Japan (%)
Place of birth for the foreign-born population - Korea (%)
Place of birth for the foreign-born population - Other Eastern Asia (%)
Place of birth for the foreign-born population - Afghanistan (%)
Place of birth for the foreign-born population - Bangladesh (%)
Place of birth for the foreign-born population - India (%)
Place of birth for the foreign-born population - Iran (%)
Place of birth for the foreign-born population - Kazakhstan (%)
Place of birth for the foreign-born population - Nepal (%)
Place of birth for the foreign-born population - Pakistan (%)
Place of birth for the foreign-born population - Sri Lanka (%)
Place of birth for the foreign-born population - Uzbekistan (%)
Place of birth for the foreign-born population - Other South Central Asia (%)
Place of birth for the foreign-born population - Burma (%)
Place of birth for the foreign-born population - Cambodia (%)
Place of birth for the foreign-born population - Indonesia (%)
Place of birth for the foreign-born population - Laos (%)
Place of birth for the foreign-born population - Malaysia (%)
Place of birth for the foreign-born population - Philippines (%)
Place of birth for the foreign-born population - Singapore (%)
Place of birth for the foreign-born population - Thailand (%)
Place of birth for the foreign-born population - Vietnam (%)
Place of birth for the foreign-born population - Other South Eastern Asia (%)
Place of birth for the foreign-born population - Armenia (%)
Place of birth for the foreign-born population - Iraq (%)
Place of birth for the foreign-born population - Israel (%)
Place of birth for the foreign-born population - Jordan (%)
Place of birth for the foreign-born population - Kuwait (%)
Place of birth for the foreign-born population - Lebanon (%)
Place of birth for the foreign-born population - Saudi Arabia (%)
Place of birth for the foreign-born population - Syria (%)
Place of birth for the foreign-born population - Turkey (%)
Place of birth for the foreign-born population - Yemen (%)
Place of birth for the foreign-born population - Other Western Asia (%)
Place of birth for the foreign-born population - Eritrea (%)
Place of birth for the foreign-born population - Ethiopia (%)
Place of birth for the foreign-born population - Kenya (%)
Place of birth for the foreign-born population - Somalia (%)
Place of birth for the foreign-born population - Uganda (%)
Place of birth for the foreign-born population - Zimbabwe (%)
Place of birth for the foreign-born population - Other Eastern Africa (%)
Place of birth for the foreign-born population - Cameroon (%)
Place of birth for the foreign-born population - Congo (%)
Place of birth for the foreign-born population - Democratic Republic of Congo (Zaire) (%)
Place of birth for the foreign-born population - Other Middle Africa (%)
Place of birth for the foreign-born population - Egypt (%)
Place of birth for the foreign-born population - Morocco (%)
Place of birth for the foreign-born population - Sudan (%)
Place of birth for the foreign-born population - Other Northern Africa (%)
Place of birth for the foreign-born population - South Africa (%)
Place of birth for the foreign-born population - Other Southern Africa (%)
Place of birth for the foreign-born population - Cabo Verde (%)
Place of birth for the foreign-born population - Ghana (%)
Place of birth for the foreign-born population - Liberia (%)
Place of birth for the foreign-born population - Nigeria (%)
Place of birth for the foreign-born population - Senegal (%)
Place of birth for the foreign-born population - Sierra Leone (%)
Place of birth for the foreign-born population - Other Western Africa (%)
Place of birth for the foreign-born population - Australia (%)
Place of birth for the foreign-born population - New Zealand (%)
Place of birth for the foreign-born population - Fiji (%)
Place of birth for the foreign-born population - Micronesia (%)
Place of birth for the foreign-born population - Bahamas (%)
Place of birth for the foreign-born population - Barbados (%)
Place of birth for the foreign-born population - Cuba (%)
Place of birth for the foreign-born population - Dominica (%)
Place of birth for the foreign-born population - Dominican Republic (%)
Place of birth for the foreign-born population - Grenada (%)
Place of birth for the foreign-born population - Haiti (%)
Place of birth for the foreign-born population - Jamaica (%)
Place of birth for the foreign-born population - St. Vincent and the Grenadines (%)
Place of birth for the foreign-born population - Trinidad and Tobago (%)
Place of birth for the foreign-born population - West Indies (%)
Place of birth for the foreign-born population - Other Caribbean (%)
Place of birth for the foreign-born population - Belize (%)
Place of birth for the foreign-born population - Costa Rica (%)
Place of birth for the foreign-born population - El Salvador (%)
Place of birth for the foreign-born population - Guatemala (%)
Place of birth for the foreign-born population - Honduras (%)
Place of birth for the foreign-born population - Mexico (%)
Place of birth for the foreign-born population - Nicaragua (%)
Place of birth for the foreign-born population - Panama (%)
Place of birth for the foreign-born population - Other Central America (%)
Place of birth for the foreign-born population - Argentina (%)
Place of birth for the foreign-born population - Bolivia (%)
Place of birth for the foreign-born population - Brazil (%)
Place of birth for the foreign-born population - Chile (%)
Place of birth for the foreign-born population - Colombia (%)
Place of birth for the foreign-born population - Ecuador (%)
Place of birth for the foreign-born population - Guyana (%)
Place of birth for the foreign-born population - Peru (%)
Place of birth for the foreign-born population - Uruguay (%)
Place of birth for the foreign-born population - Venezuela (%)
Place of birth for the foreign-born population - Other South America (%)
Place of birth for the foreign-born population - Canada (%)
Place of birth for the foreign-born population - Other Northern America (%)
Place of birth for the foreign-born population - Other (%)
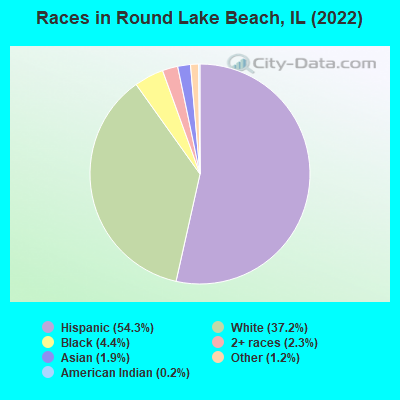
According to 2022 data, the most numerous races in Round Lake Beach, IL are White alone (10,079 residents), Hispanic (14,695 residents), and Black alone (1,188 residents). 50.2% of Round Lake Beach residents speak English at home. 23.4% of Round Lake Beach, IL residents are foreign-born (20.0% born in Latin America), which is 40.3% greater than the foreign-born rate of 14.0% across the entire state of Illinois.
Race distribution in Round Lake Beach
2000 2022
8,424,140 67.8% White alone 1,856,152 14.9% Black alone 1,530,262 12.3% Hispanic 419,916 3.4% Asian alone 153,996 1.2% Two or more races 13,479 0.1% Other race alone 18,232 0.1% American Indian alone 3,116 0.03% Native Hawaiian and Other
7,356,301 58.5% White alone 2,299,726 18.3% Hispanic 1,660,423 13.2% Black alone 747,296 5.9% Asian alone 458,599 3.6% Two or more races 45,386 0.4% Other race alone 10,405 0.08% American Indian alone 3,896 0.03% Native Hawaiian and Other
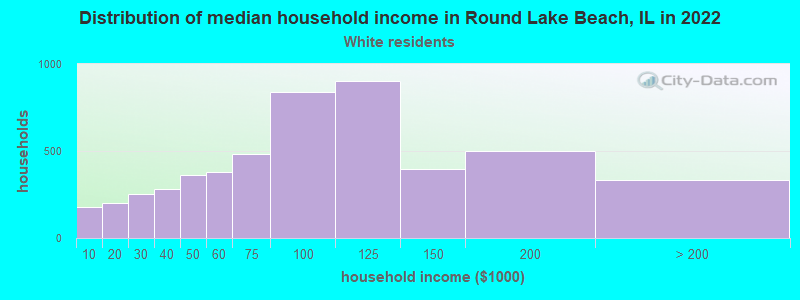
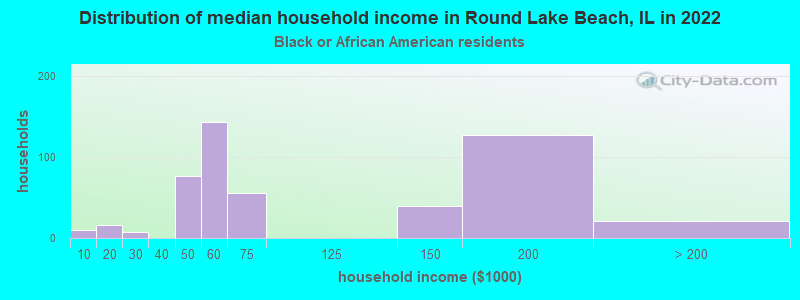
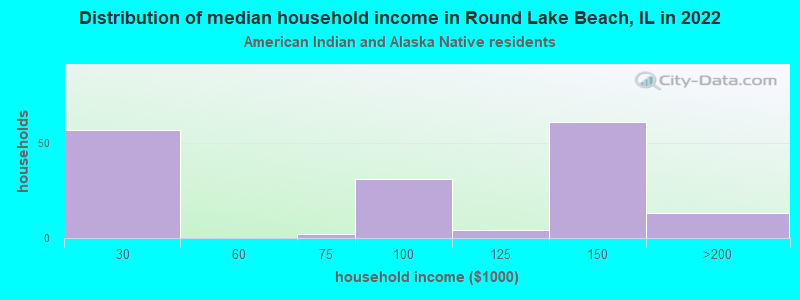
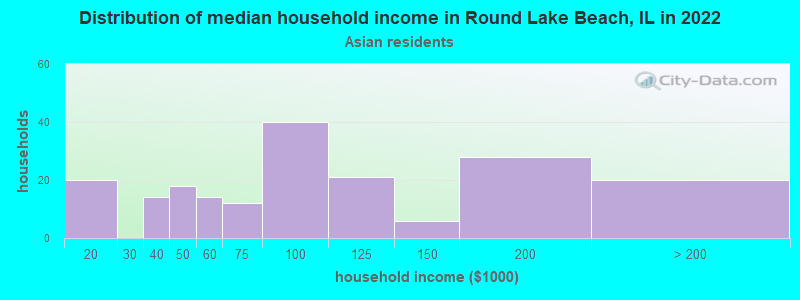
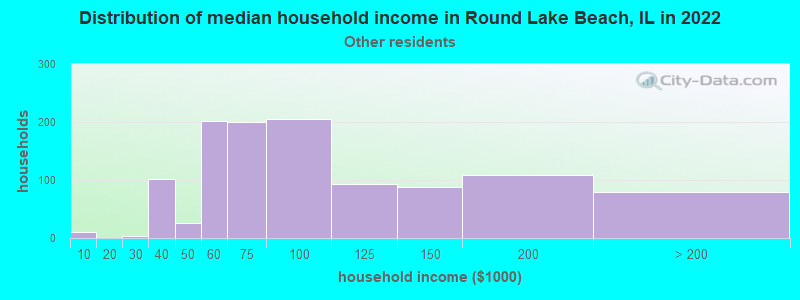
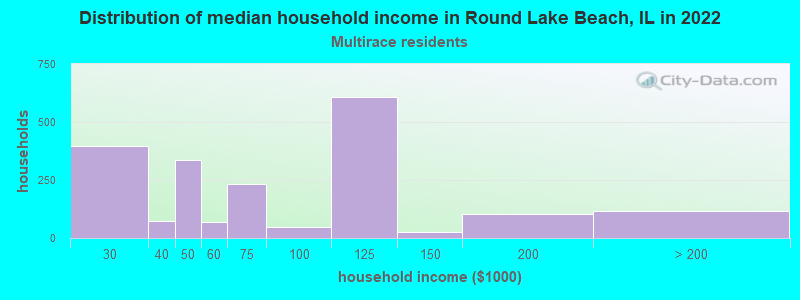
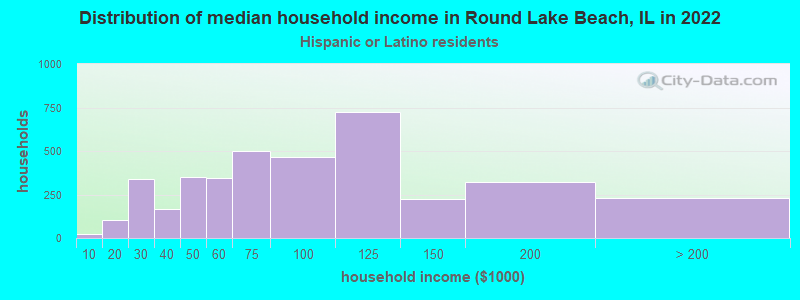
Income and house value in Round Lake Beach Median household income in 2022 $90,730 White non-Hispanic householders$87,281 Asian householders$87,157 Some other race householders$59,314 Two or more races householders$77,418 Hispanic or Latino race householdersMedian 2022 house value $185,301 White Non-Hispanic householders$195,417 Black or African American householders$109,949 American Indian or Alaska Native householders $182,369 Asian householders$165,657 Some other race householders$167,123 Two or more races householders$167,416 Hispanic or Latino householders
Median age by race in Round Lake Beach
37.2 Median age for White residents36.0 38.4 35.6 Median age for Black or African American residents42.8 32.0 43.4 Median age for American Indian / Alaska Native residents46.8 34.4 40.4 Median age for Asian residents33.8 46.0 9.7 Median age for Native Hawaiian / Pacific Islander residents-658,536,584.7 9.1 29.6 Median age for Other race residents29.0 30.9 28.0 Median age for Two or more races residents26.2 31.8 40.2 Median age for White alone residents37.3 43.9 28.0 Median age for Hispanic or Latino residents26.9 29.1
Owner/renter occupied households by race in Round Lake Beach
House owners and renters - White residents 4,034 79.6% Owner occupied1,035 20.4% Renter occupiedHouse owners and renters - Black or African American residents 185 43.2% Owner occupied244 56.8% Renter occupiedHouse owners and renters - American Indian / Alaska Native residents 127 83.2% Owner occupied26 16.8% Renter occupiedHouse owners and renters - Asian residents 160 90.3% Owner occupied17 9.7% Renter occupiedHouse owners and renters - Other race residents 1,192 91.2% Owner occupied115 8.8% Renter occupiedHouse owners and renters - Two or more races residents 1,602 83.9% Owner occupied308 16.1% Renter occupiedHouse owners and renters - White alone residents 3,212 79.4% Owner occupied832 20.6% Renter occupiedHouse owners and renters - Hispanic or Latino residents 3,279 85.6% Owner occupied553 14.4% Renter occupied
Language usage in Round Lake Beach
English speakers - Total 50.2% of residents of Round Lake Beach speak English at home.
45.9% of residents speak Spanish at home 6,742 58.1% Speak English very well4,866 41.9% Speak English less than very well4.2% of residents speak other language at home 746 69.7% Speak English very well325 30.3% Speak English less than very well
English speakers - Born in the United States 77.0% of residents of Round Lake Beach speak English at home.
24.7% of residents speak Spanish at home 583 81.5% Speak English very well132 18.5% Speak English less than very well0.8% of residents speak other language at home 23 100.0% Speak English very well
English speakers - Native, born elsewhere 47.5% of residents of Round Lake Beach speak English at home.
37.1% of residents speak Spanish at home 59 50.0% Speak English very well59 50.0% Speak English less than very well14.5% of residents speak other language at home 16 34.8% Speak English very well30 65.2% Speak English less than very well
English speakers - Foreign-born 6.7% of residents of Round Lake Beach speak English at home.
81.7% of residents speak Spanish at home 1,438 26.6% Speak English very well3,978 73.4% Speak English less than very well11.8% of residents speak other language at home 483 61.6% Speak English very well301 38.4% Speak English less than very well
White (Caucasian) - Speak only English Native:
80.7% (9,332)Foreign-born:
11.7% (215)
White (Caucasian) - Speak another language Native:
14.7% (1,694)Foreign-born:
82.8% (1,522)
Black or African American - Speak only English Native:
99.6% (1,028)Foreign-born:
23.8% (27)
American Indian / Alaska Native - Speak another language Native:
73.3% (296)Foreign-born:
100.0% (146)
Asian - Speak only English Native:
46.5% (69)Foreign-born:
11.7% (38)
Asian - Speak another language Native:
51.5% (76)Foreign-born:
88.0% (287)
Other race - Speak only English Native:
23.4% (604)Foreign-born:
9.0% (159)
Other race - Speak another language Native:
75.1% (1,936)Foreign-born:
89.8% (1,593)
Two or more races - Speak only English Native:
34.2% (1,355)Foreign-born:
1.7% (55)
Two or more races - Speak another language Native:
69.1% (2,739)Foreign-born:
99.0% (3,144)
White alone - Speak only English Native:
96.3% (8,761)Foreign-born:
16.9% (84)
White alone - Speak another language Native:
3.7% (335)Foreign-born:
82.4% (409)
Hispanic or Latino - Speak only English Native:
23.7% (1,879)Foreign-born:
6.0% (343)
Hispanic or Latino - Speak another language Native:
75.5% (5,996)Foreign-born:
93.4% (5,331)
Foreign-born residents in Round Lake Beach 6,349 residents are foreign born (20.0% Latin America ).
This city:
23.4%Illinois:
14.1%
Marital status for residents in Round Lake Beach Marital status - White (Caucasian) population 15 years and over
Males 41.4% Never married43.2% Now married0.6% Separated2.4% Widowed12.4% DivorcedFemales 30.5% Never married49.8% Now married0.9% Separated7.5% Widowed11.3% DivorcedWomen who gave birth in the past 12 months Now married:
74.9% (174)Unmarried:
25.1% (58)
Women who did not give birth in the past 12 months Now married:
42.0% (1,234)Unmarried:
58.0% (1,706)
Marital status - Black or African American population 15 years and over
Males 58.4% Never married21.4% Now married5.9% Separated0.0% Widowed14.2% DivorcedFemales 59.2% Never married7.9% Now married0.0% Separated4.8% Widowed28.2% DivorcedWomen who gave birth in the past 12 months Now married:
0.0% (0)Unmarried:
100.0% (115)
Women who did not give birth in the past 12 months Now married:
15.1% (39)Unmarried:
84.9% (219)
Marital status - American Indian / Alaska Native population 15 years and over
Males 35.4% Never married64.6% Now married0.0% Separated0.0% Widowed0.0% DivorcedFemales 24.5% Never married37.1% Now married0.0% Separated9.9% Widowed28.5% DivorcedWomen who did not give birth in the past 12 months Now married:
44.2% (77)Unmarried:
55.8% (97)
Marital status - Asian population 15 years and over
Males 31.5% Never married68.5% Now married0.0% Separated0.0% Widowed0.0% DivorcedFemales 19.5% Never married73.7% Now married0.0% Separated0.0% Widowed6.8% DivorcedWomen who gave birth in the past 12 months Now married:
100.0% (24)Unmarried:
0.0% (0)
Women who did not give birth in the past 12 months Now married:
65.1% (55)Unmarried:
34.9% (29)
Marital status - Other race population 15 years and over
Males 44.4% Never married47.4% Now married0.0% Separated3.8% Widowed4.4% DivorcedFemales 42.3% Never married45.5% Now married2.8% Separated3.5% Widowed5.9% DivorcedWomen who gave birth in the past 12 months Now married:
0.0% (0)Unmarried:
100.0% (79)
Women who did not give birth in the past 12 months Now married:
46.1% (482)Unmarried:
53.9% (565)
Marital status - Two or more races population 15 years and over
Males 50.8% Never married39.6% Now married3.9% Separated0.0% Widowed5.7% DivorcedFemales 38.8% Never married52.6% Now married0.9% Separated3.4% Widowed4.3% DivorcedWomen who gave birth in the past 12 months Now married:
100.0% (41)Unmarried:
0.0% (0)
Women who did not give birth in the past 12 months Now married:
53.5% (913)Unmarried:
46.5% (793)
Marital status - White alone, not Hispanic / Latino population 15 years and over
Males 40.4% Never married39.1% Now married0.9% Separated3.4% Widowed16.1% DivorcedFemales 26.0% Never married48.4% Now married1.0% Separated10.3% Widowed14.3% DivorcedWomen who gave birth in the past 12 months Now married:
74.4% (143)Unmarried:
25.6% (49)
Women who did not give birth in the past 12 months Now married:
41.6% (785)Unmarried:
58.4% (1,104)
Marital status - Hispanic or Latino population 15 years and over
Males 45.7% Never married47.9% Now married0.4% Separated1.2% Widowed4.8% DivorcedFemales 41.3% Never married50.1% Now married1.1% Separated2.7% Widowed4.7% DivorcedWomen who gave birth in the past 12 months Now married:
43.9% (74)Unmarried:
56.1% (94)
Women who did not give birth in the past 12 months Now married:
46.6% (1,710)Unmarried:
53.4% (1,957)
Ancestries in Round Lake Beach
809 5.1% German657 4.2% Polish512 3.3% American439 2.8% English382 2.4% Irish377 2.4% Italian188 1.2% European68 0.4% Arab44 0.3% Norwegian40 0.3% Lithuanian38 0.2% Hungarian38 0.2% Scandinavian34 0.2% Eastern European33 0.2% Haitian32 0.2% British32 0.2% Russian32 0.2% Yugoslavian30 0.2% Belizean25 0.2% Maltese24 0.2% Welsh20 0.1% French Canadian20 0.1% Kenyan20 0.1% Czech17 0.1% Portuguese16 0.1% Greek16 0.1% Nigerian16 0.1% Swedish15 0.10% Jamaican13 0.08% Brazilian9 0.06% Scotch-Irish9 0.06% Slovak9 0.06% African8 0.05% Croatian7 0.04% Belgian7 0.04% Romanian7 0.04% Danish6 0.04% Austrian2 0.01% Northern European
Geographical mobility in Round Lake Beach Same house 1 year ago 13,582 95.2% White (Caucasian)1,286 100.0% Black or African American400 80.1% American Indian / Alaska Native426 85.4% Asian3,932 86.3% Other race7,142 96.6% Two or more races9,490 95.0% White alone, not Hispanic / Latino13,552 93.1% Hispanic or LatinoMoved within same county 386 2.7% White / Caucasian41 3.4% Black or African American33 6.7% American Indian / Alaska Native48 9.7% Asian25 94.6% Native Hawaiian / Pacific Islander282 6.2% Other race258 3.5% Two or more races276 2.8% White alone, not Hispanic / Latino638 4.4% Hispanic or LatinoMoved within same state 185 1.3% White / Caucasian9 0.8% Black or African American26 5.1% American Indian / Alaska Native10 2.0% Asian273 6.0% Other race15 0.2% Two or more races111 1.1% White alone, not Hispanic / Latino272 1.9% Hispanic or LatinoMoved from different state 41 0.3% White / Caucasian41 8.3% American Indian / Alaska Native53 0.7% Two or more races46 0.5% White alone, not Hispanic / Latino59 0.4% Hispanic or LatinoMoved from abroad 9 0.2% Other race6 0.0% Hispanic or Latino
Children Nativity (place of birth) in Round Lake Beach
Children under 6 years - Living with two parents Both parents native 593 100.0% NativeBoth parents foreign-born 598 100.0% NativeOne native, one foreign-born parent 151 100.0% NativeChildren under 6 years - Living with one parent Native parent 572 100.0% NativeForeign-born parent 181 100.0% NativeChildren 6 to 17 years - Living with two parents Both parents native 1,222 100.0% NativeBoth parents foreign-born 1,227 91.7% Native112 8.3% Foreign-bornOne native, one foreign-born parent 594 100.0% NativeChildren 6 to 17 years - Living with one parent Native parent 848 100.0% NativeForeign-born parent 849 55.3% Native686 44.7% Foreign-born
Grandparents responsible for own grandchildren in Round Lake Beach
Grandparents (30 to 59 years) White / Caucasian 16 28.3% Responsible for grandchildren40 71.7% Not responsible for grandchildrenBlack or African American 11 100.0% Not responsible for grandchildrenOther race 116 100.0% Not responsible for grandchildrenTwo or more races 101 100.0% Not responsible for grandchildrenWhite alone, not Hispanic / Latino 28 100.0% Not responsible for grandchildrenHispanic or Latino 12 5.8% Responsible for grandchildren198 94.2% Not responsible for grandchildrenGrandparents (60 years and over) White / Caucasian 8 9.9% Responsible for grandchildren71 90.1% Not responsible for grandchildrenBlack or African American 77 100.0% Not responsible for grandchildrenOther race 88 100.0% Not responsible for grandchildrenTwo or more races 10 100.0% Not responsible for grandchildrenWhite alone, not Hispanic / Latino 9 45.4% Responsible for grandchildren11 54.6% Not responsible for grandchildrenHispanic or Latino 202 100.0% Not responsible for grandchildren