Races in Rubidoux, California (CA) Detailed Stats
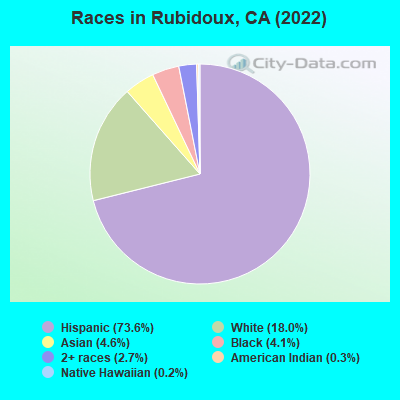
According to 2022 data, the most numerous races in Rubidoux, CA are Hispanic (28,633 residents), White alone (6,989 residents), and Asian alone (1,804 residents). 40.7% of Rubidoux residents speak English at home. 28.5% of Rubidoux, CA residents are foreign-born (26.9% born in Latin America), which is 8.8% greater than the foreign-born rate of 26.0% across the entire state of California.
Race distribution in Rubidoux
2000 2022
15,816,790 46.7% White alone 10,966,556 32.4% Hispanic 3,648,860 10.8% Asian alone 2,181,926 6.4% Black alone 903,115 2.7% Two or more races 178,984 0.5% American Indian alone 103,736 0.3% Native Hawaiian and Other 71,681 0.2% Other race alone
15,732,184 40.3% Hispanic 13,160,426 33.7% White alone 5,957,867 15.3% Asian alone 2,025,218 5.2% Black alone 1,663,222 4.3% Two or more races 251,618 0.6% Other race alone 135,777 0.3% Native Hawaiian and Other 103,030 0.3% American Indian alone
Income and house value in Rubidoux Median household income in 2022 $89,091 White non-Hispanic householders$67,110 Black householders$104,131 American Indian and Alaska Native householders$133,505 Asian householders$50,727 Some other race householders$78,519 Two or more races householders$59,760 Hispanic or Latino race householdersMedian 2022 house value $501,381 White Non-Hispanic householders$375,046 Black or African American householders$483,745 American Indian or Alaska Native householders $608,640 Asian householders$341,573 Some other race householders$442,353 Two or more races householders$345,892 Hispanic or Latino householders
Median age by race in Rubidoux
34.7 Median age for White residents34.7 35.8 39.9 Median age for Black or African American residents40.8 34.0 16.2 Median age for American Indian / Alaska Native residents10.3 18.8 32.8 Median age for Asian residents30.5 36.7 47.5 Median age for Native Hawaiian / Pacific Islander residents31.1 Median age for Other race residents31.1 31.2 25.5 Median age for Two or more races residents31.5 23.2 49.1 Median age for White alone residents48.5 49.6 27.1 Median age for Hispanic or Latino residents27.1 27.2
Owner/renter occupied households by race in Rubidoux
House owners and renters - White residents 2,829 66.8% Owner occupied1,408 33.2% Renter occupiedHouse owners and renters - Black or African American residents 236 49.7% Owner occupied239 50.3% Renter occupiedHouse owners and renters - American Indian / Alaska Native residents 63 37.2% Owner occupied106 62.8% Renter occupiedHouse owners and renters - Asian residents 302 68.9% Owner occupied136 31.1% Renter occupiedHouse owners and renters - Native Hawaiian / Pacific Islander residents 33 100.0% Owner occupiedHouse owners and renters - Other race residents 2,008 52.1% Owner occupied1,849 47.9% Renter occupiedHouse owners and renters - Two or more races residents 800 77.0% Owner occupied239 23.0% Renter occupiedHouse owners and renters - White alone residents 1,793 69.4% Owner occupied791 30.6% Renter occupiedHouse owners and renters - Hispanic or Latino residents 3,654 57.2% Owner occupied2,735 42.8% Renter occupied
Language usage in Rubidoux
English speakers - Total 40.7% of residents of Rubidoux speak English at home.
54.2% of residents speak Spanish at home 11,883 61.4% Speak English very well7,473 38.6% Speak English less than very well3.4% of residents speak other language at home 587 48.6% Speak English very well621 51.4% Speak English less than very well
English speakers - Born in the United States 85.8% of residents of Rubidoux speak English at home.
10.5% of residents speak Spanish at home 341 97.2% Speak English very well10 2.8% Speak English less than very well2.7% of residents speak other language at home 44 49.4% Speak English very well45 50.6% Speak English less than very well
English speakers - Native, born elsewhere 27.6% of residents of Rubidoux speak English at home.
67.5% of residents speak Spanish at home 418 95.9% Speak English very well18 4.1% Speak English less than very well8.2% of residents speak other language at home 49 92.5% Speak English very well4 7.5% Speak English less than very well
English speakers - Foreign-born 6.3% of residents of Rubidoux speak English at home.
77.6% of residents speak Spanish at home 3,085 33.0% Speak English very well6,276 67.0% Speak English less than very well6.6% of residents speak other language at home 270 33.8% Speak English very well528 66.2% Speak English less than very well
White (Caucasian) - Speak only English Native:
75.9% (7,760)Foreign-born:
11.2% (311)
White (Caucasian) - Speak another language Native:
22.4% (2,290)Foreign-born:
86.3% (2,404)
Black or African American - Speak only English Native:
95.6% (1,947)Foreign-born:
72.0% (15)
Black or African American - Speak another language Native:
4.2% (85)Foreign-born:
19.8% (4)
American Indian / Alaska Native - Speak another language Native:
43.9% (255)Foreign-born:
98.1% (155)
Asian - Speak only English Native:
35.1% (360)Foreign-born:
31.6% (315)
Asian - Speak another language Native:
65.8% (674)Foreign-born:
72.0% (717)
Other race - Speak only English Native:
23.6% (1,936)Foreign-born:
0.9% (65)
Other race - Speak another language Native:
75.5% (6,199)Foreign-born:
97.1% (6,810)
Two or more races - Speak another language Native:
35.8% (1,449)Foreign-born:
97.7% (1,361)
White alone - Speak only English Native:
97.5% (6,456)Foreign-born:
60.8% (94)
White alone - Speak another language Native:
2.5% (166)Foreign-born:
32.8% (51)
Hispanic or Latino - Speak only English Native:
35.1% (5,538)Foreign-born:
4.6% (457)
Hispanic or Latino - Speak another language Native:
63.4% (9,998)Foreign-born:
94.8% (9,450)
Foreign-born residents in Rubidoux 11,941 residents are foreign born (26.9% Latin America ).
This city:
28.5%California:
100.0%
Marital status for residents in Rubidoux Marital status - White (Caucasian) population 15 years and over
Males 34.7% Never married51.5% Now married2.1% Separated1.5% Widowed10.1% DivorcedFemales 24.7% Never married53.2% Now married2.1% Separated7.9% Widowed12.1% DivorcedWomen who gave birth in the past 12 months Now married:
80.4% (173)Unmarried:
19.6% (42)
Women who did not give birth in the past 12 months Now married:
51.9% (1,459)Unmarried:
48.1% (1,354)
Marital status - Black or African American population 15 years and over
Males 49.3% Never married23.3% Now married5.0% Separated0.0% Widowed22.5% DivorcedFemales 40.8% Never married26.9% Now married5.1% Separated6.5% Widowed20.7% DivorcedWomen who gave birth in the past 12 months Now married:
76.7% (22)Unmarried:
23.3% (7)
Women who did not give birth in the past 12 months Now married:
35.9% (201)Unmarried:
64.1% (359)
Marital status - American Indian / Alaska Native population 15 years and over
Males 23.6% Never married20.3% Now married0.0% Separated7.3% Widowed48.8% DivorcedFemales 46.0% Never married33.6% Now married0.0% Separated0.0% Widowed20.4% DivorcedWomen who gave birth in the past 12 months Now married:
0.0% (0)Unmarried:
100.0% (57)
Women who did not give birth in the past 12 months Now married:
55.0% (87)Unmarried:
45.0% (72)
Marital status - Asian population 15 years and over
Males 49.5% Never married32.5% Now married2.6% Separated3.2% Widowed12.2% DivorcedFemales 19.3% Never married55.5% Now married4.0% Separated0.0% Widowed21.2% DivorcedWomen who gave birth in the past 12 months Now married:
100.0% (37)Unmarried:
0.0% (0)
Women who did not give birth in the past 12 months Now married:
44.9% (126)Unmarried:
55.1% (155)
Marital status - Native Hawaiian / Pacific Islander population 15 years and over
Males 0.0% Never married100.0% Now married0.0% Separated0.0% Widowed0.0% DivorcedFemales 0.0% Never married100.0% Now married0.0% Separated0.0% Widowed0.0% DivorcedWomen who did not give birth in the past 12 months Now married:
100.0% (26)Unmarried:
0.0% (0)
Marital status - Other race population 15 years and over
Males 45.5% Never married49.6% Now married0.0% Separated0.0% Widowed4.9% DivorcedFemales 29.0% Never married60.7% Now married2.0% Separated2.1% Widowed6.2% DivorcedWomen who gave birth in the past 12 months Now married:
62.6% (232)Unmarried:
37.4% (139)
Women who did not give birth in the past 12 months Now married:
60.1% (2,347)Unmarried:
39.9% (1,559)
Marital status - Two or more races population 15 years and over
Males 54.2% Never married33.1% Now married4.1% Separated0.0% Widowed8.6% DivorcedFemales 41.3% Never married46.8% Now married6.0% Separated0.0% Widowed6.0% DivorcedWomen who gave birth in the past 12 months Now married:
100.0% (128)Unmarried:
0.0% (0)
Women who did not give birth in the past 12 months Now married:
44.4% (556)Unmarried:
55.6% (697)
Marital status - White alone, not Hispanic / Latino population 15 years and over
Males 25.1% Never married52.1% Now married3.5% Separated2.5% Widowed16.9% DivorcedFemales 19.2% Never married48.3% Now married2.3% Separated13.1% Widowed17.0% DivorcedWomen who gave birth in the past 12 months Now married:
100.0% (88)Unmarried:
0.0% (0)
Women who did not give birth in the past 12 months Now married:
47.1% (535)Unmarried:
52.9% (601)
Marital status - Hispanic or Latino population 15 years and over
Males 45.2% Never married48.9% Now married0.3% Separated0.6% Widowed5.1% DivorcedFemales 30.4% Never married58.3% Now married2.1% Separated2.0% Widowed7.1% DivorcedWomen who gave birth in the past 12 months Now married:
59.6% (390)Unmarried:
40.4% (265)
Women who did not give birth in the past 12 months Now married:
57.7% (3,820)Unmarried:
42.3% (2,797)
Ancestries in Rubidoux
584 2.2% American466 1.7% English390 1.5% German267 1.0% European258 1.0% Irish139 0.5% Italian76 0.3% Scottish57 0.2% Norwegian54 0.2% British54 0.2% Northern European51 0.2% Jamaican42 0.2% Turkish36 0.1% Portuguese34 0.1% Polish33 0.1% Swedish30 0.1% Scotch-Irish29 0.1% French Canadian28 0.1% Lebanese25 0.09% Hungarian24 0.09% Canadian18 0.07% Welsh14 0.05% Dutch14 0.05% French12 0.04% Russian8 0.03% Basque8 0.03% Latvian8 0.03% African5 0.02% Slavic5 0.02% Belizean4 0.01% Sudanese
Geographical mobility in Rubidoux Same house 1 year ago 13,124 93.0% White (Caucasian)1,989 87.1% Black or African American457 50.6% American Indian / Alaska Native1,478 85.9% Asian7 8.7% Native Hawaiian / Pacific Islander12,817 78.0% Other race6,200 91.5% Two or more races6,280 90.8% White alone, not Hispanic / Latino23,981 85.1% Hispanic or LatinoMoved within same county 588 4.2% White / Caucasian231 10.1% Black or African American234 25.9% American Indian / Alaska Native168 9.7% Asian21 26.4% Native Hawaiian / Pacific Islander1,621 9.9% Other race135 2.0% Two or more races330 4.8% White alone, not Hispanic / Latino2,142 7.6% Hispanic or LatinoMoved within same state 502 3.6% White / Caucasian27 1.2% Black or African American55 3.2% Asian31 38.8% Native Hawaiian / Pacific Islander937 5.7% Other race564 8.3% Two or more races235 3.4% White alone, not Hispanic / Latino1,506 5.3% Hispanic or LatinoMoved from different state 136 1.0% White / Caucasian37 1.6% Black or African American127 1.8% White alone, not Hispanic / Latino23 0.1% Hispanic or LatinoMoved from abroad 15 0.1% White64 0.9% Two or more races14 0.0% Hispanic or Latino
Children Nativity (place of birth) in Rubidoux
Children under 6 years - Living with two parents Both parents native 956 99.9% Native1 0.1% Foreign-bornBoth parents foreign-born 762 93.5% Native53 6.5% Foreign-bornOne native, one foreign-born parent 217 100.0% NativeChildren under 6 years - Living with one parent Native parent 1,009 93.2% Native74 6.8% Foreign-bornForeign-born parent 248 100.0% NativeChildren 6 to 17 years - Living with two parents Both parents native 1,431 99.4% Native9 0.6% Foreign-bornBoth parents foreign-born 1,772 82.3% Native380 17.7% Foreign-bornOne native, one foreign-born parent 817 100.0% NativeChildren 6 to 17 years - Living with one parent Native parent 1,048 100.0% NativeForeign-born parent 1,416 54.6% Native1,178 45.4% Foreign-born
Grandparents responsible for own grandchildren in Rubidoux
Grandparents (30 to 59 years) White / Caucasian 93 39.1% Responsible for grandchildren145 60.9% Not responsible for grandchildrenBlack or African American 33 62.9% Responsible for grandchildren19 37.1% Not responsible for grandchildrenAmerican Indian / Alaska Native 22 59.5% Responsible for grandchildren15 40.5% Not responsible for grandchildrenAsian 14 32.9% Responsible for grandchildren29 67.1% Not responsible for grandchildrenOther race 153 22.1% Responsible for grandchildren540 77.9% Not responsible for grandchildrenTwo or more races 52 100.0% Responsible for grandchildrenWhite alone, not Hispanic / Latino 87 48.8% Responsible for grandchildren92 51.2% Not responsible for grandchildrenHispanic or Latino 93 13.7% Responsible for grandchildren586 86.3% Not responsible for grandchildrenGrandparents (60 years and over) White / Caucasian 48 24.4% Responsible for grandchildren147 75.6% Not responsible for grandchildrenBlack or African American 74 100.0% Responsible for grandchildrenAmerican Indian / Alaska Native 4 12.1% Responsible for grandchildren29 87.9% Not responsible for grandchildrenAsian 47 100.0% Not responsible for grandchildrenOther race 245 51.3% Responsible for grandchildren232 48.7% Not responsible for grandchildrenWhite alone, not Hispanic / Latino 45 40.7% Responsible for grandchildren66 59.3% Not responsible for grandchildrenHispanic or Latino 186 37.7% Responsible for grandchildren308 62.3% Not responsible for grandchildren