Races in Sacramento, California (CA) Detailed Stats
Data:
Races - White alone (%)
Races - White alone (% change since 2000)
Races - Black alone (%)
Races - Black alone (% change since 2000)
Races - American Indian alone (%)
Races - American Indian alone (% change since 2000)
Races - Asian alone (%)
Races - Asian alone (% change since 2000)
Races - Hispanic (%)
Races - Hispanic (% change since 2000)
Races - Native Hawaiian and Other Pacific Islander alone (%)
Races - Native Hawaiian and Other Pacific Islander alone (% change since 2000)
Races - Two or more races(%)
Races - Two or more races(% change since 2000)
Races - Other race alone (%)
Races - Other race alone (% change since 2000)
Racial diversity
Place of birth - Born in state of residence (%)
Place of birth - Born in state of residence (%) - White
Place of birth - Born in state of residence (%) - Black or African American
Place of birth - Born in state of residence (%) - Asian
Place of birth - Born in state of residence (%) - Hispanic or Latino
Place of birth - Born in state of residence (%) - American Indian and Alaska Native
Place of birth - Born in state of residence (%) - Multirace
Place of birth - Born in state of residence (%) - Other Race
Place of birth - Born in other state (%)
Place of birth - Born in other state (%) - White
Place of birth - Born in other state (%) - Black or African American
Place of birth - Born in other state (%) - Asian
Place of birth - Born in other state (%) - Hispanic or Latino
Place of birth - Born in other state (%) - American Indian and Alaska Native
Place of birth - Born in other state (%) - Multirace
Place of birth - Born in other state (%) - Other Race
Place of birth - Native, outside of US (%)
Place of birth - Native, outside of US (%) - White
Place of birth - Native, outside of US (%) - Black or African American
Place of birth - Native, outside of US (%) - Asian
Place of birth - Native, outside of US (%) - Hispanic or Latino
Place of birth - Native, outside of US (%) - American Indian and Alaska Native
Place of birth - Native, outside of US (%) - Multirace
Place of birth - Native, outside of US (%) - Other Race
Place of birth - Foreign born (%)
Place of birth - Foreign born (%) - White
Place of birth - Foreign born (%) - Black or African American
Place of birth - Foreign born (%) - Asian
Place of birth - Foreign born (%) - Hispanic or Latino
Place of birth - Foreign born (%) - American Indian and Alaska Native
Place of birth - Foreign born (%) - Multirace
Place of birth - Foreign born (%) - Other Race
Residents speaking English at home (%)
Residents speaking English at home - Born in the United States (%)
Residents speaking English at home - Native, born elsewhere (%)
Residents speaking English at home - Foreign born (%)
Residents speaking Spanish at home (%)
Residents speaking Spanish at home - Born in the United States (%)
Residents speaking Spanish at home - Native, born elsewhere (%)
Residents speaking Spanish at home - Foreign born (%)
Residents speaking other language at home (%)
Residents speaking other language at home - Born in the United States (%)
Residents speaking other language at home - Native, born elsewhere (%)
Residents speaking other language at home - Foreign born (%)
Marital status - Never married (%)
Marital status - Now married (%)
Marital status - Separated (%)
Marital status - Widowed (%)
Marital status - Divorced (%)
Ancestries Reported - Arab (%)
Ancestries Reported - Czech (%)
Ancestries Reported - Danish (%)
Ancestries Reported - Dutch (%)
Ancestries Reported - English (%)
Ancestries Reported - French (%)
Ancestries Reported - French Canadian (%)
Ancestries Reported - German (%)
Ancestries Reported - Greek (%)
Ancestries Reported - Hungarian (%)
Ancestries Reported - Irish (%)
Ancestries Reported - Italian (%)
Ancestries Reported - Lithuanian (%)
Ancestries Reported - Norwegian (%)
Ancestries Reported - Polish (%)
Ancestries Reported - Portuguese (%)
Ancestries Reported - Russian (%)
Ancestries Reported - Scotch-Irish (%)
Ancestries Reported - Scottish (%)
Ancestries Reported - Slovak (%)
Ancestries Reported - Subsaharan African (%)
Ancestries Reported - Swedish (%)
Ancestries Reported - Swiss (%)
Ancestries Reported - Ukrainian (%)
Ancestries Reported - United States (%)
Ancestries Reported - Welsh (%)
Ancestries Reported - West Indian (%)
Ancestries Reported - Other (%)
Geographical mobility - Same house 1 year ago (%)
Geographical mobility - Same house 1 year ago (%) - White
Geographical mobility - Same house 1 year ago (%) - Black or African American
Geographical mobility - Same house 1 year ago (%) - Asian
Geographical mobility - Same house 1 year ago (%) - Hispanic or Latino
Geographical mobility - Same house 1 year ago (%) - American Indian and Alaska Native
Geographical mobility - Same house 1 year ago (%) - Multirace
Geographical mobility - Same house 1 year ago (%) - Other Race
Geographical mobility - Moved within same county (%)
Geographical mobility - Moved within same county (%) - White
Geographical mobility - Moved within same county (%) - Black or African American
Geographical mobility - Moved within same county (%) - Asian
Geographical mobility - Moved within same county (%) - Hispanic or Latino
Geographical mobility - Moved within same county (%) - American Indian and Alaska Native
Geographical mobility - Moved within same county (%) - Multirace
Geographical mobility - Moved within same county (%) - Other Race
Geographical mobility - Moved from different county within same state (%)
Geographical mobility - Moved from different county within same state (%) - White
Geographical mobility - Moved from different county within same state (%) - Black or African American
Geographical mobility - Moved from different county within same state (%) - Asian
Geographical mobility - Moved from different county within same state (%) - Hispanic or Latino
Geographical mobility - Moved from different county within same state (%) - American Indian and Alaska Native
Geographical mobility - Moved from different county within same state (%) - Multirace
Geographical mobility - Moved from different county within same state (%) - Other Race
Geographical mobility - Moved from different state (%)
Geographical mobility - Moved from different state (%) - White
Geographical mobility - Moved from different state (%) - Black or African American
Geographical mobility - Moved from different state (%) - Asian
Geographical mobility - Moved from different state (%) - Hispanic or Latino
Geographical mobility - Moved from different state (%) - American Indian and Alaska Native
Geographical mobility - Moved from different state (%) - Multirace
Geographical mobility - Moved from different state (%) - Other Race
Geographical mobility - Moved from abroad (%)
Geographical mobility - Moved from abroad (%) - White
Geographical mobility - Moved from abroad (%) - Black or African American
Geographical mobility - Moved from abroad (%) - Asian
Geographical mobility - Moved from abroad (%) - Hispanic or Latino
Geographical mobility - Moved from abroad (%) - American Indian and Alaska Native
Geographical mobility - Moved from abroad (%) - Multirace
Geographical mobility - Moved from abroad (%) - Other Race
Place of birth for the foreign-born population - Ireland (%)
Place of birth for the foreign-born population - Denmark (%)
Place of birth for the foreign-born population - Norway (%)
Place of birth for the foreign-born population - Sweden (%)
Place of birth for the foreign-born population - United Kingdom (%)
Place of birth for the foreign-born population - England (%)
Place of birth for the foreign-born population - Scotland (%)
Place of birth for the foreign-born population - Other Northern Europe (%)
Place of birth for the foreign-born population - Austria (%)
Place of birth for the foreign-born population - Belgium (%)
Place of birth for the foreign-born population - France (%)
Place of birth for the foreign-born population - Germany (%)
Place of birth for the foreign-born population - Netherlands (%)
Place of birth for the foreign-born population - Switzerland (%)
Place of birth for the foreign-born population - Other Western Europe (%)
Place of birth for the foreign-born population - Greece (%)
Place of birth for the foreign-born population - Italy (%)
Place of birth for the foreign-born population - Portugal (%)
Place of birth for the foreign-born population - Spain (%)
Place of birth for the foreign-born population - Other Southern Europe (%)
Place of birth for the foreign-born population - Albania (%)
Place of birth for the foreign-born population - Belarus (%)
Place of birth for the foreign-born population - Bosnia and Herzegovina (%)
Place of birth for the foreign-born population - Bulgaria (%)
Place of birth for the foreign-born population - Croatia (%)
Place of birth for the foreign-born population - Czechoslovakia (%)
Place of birth for the foreign-born population - Hungary (%)
Place of birth for the foreign-born population - Latvia (%)
Place of birth for the foreign-born population - Lithuania (%)
Place of birth for the foreign-born population - North Macedonia (Macedonia) (%)
Place of birth for the foreign-born population - Moldova (%)
Place of birth for the foreign-born population - Poland (%)
Place of birth for the foreign-born population - Romania (%)
Place of birth for the foreign-born population - Russia (%)
Place of birth for the foreign-born population - Serbia (%)
Place of birth for the foreign-born population - Ukraine (%)
Place of birth for the foreign-born population - Other Eastern Europe (%)
Place of birth for the foreign-born population - China (%)
Place of birth for the foreign-born population - Hong Kong (%)
Place of birth for the foreign-born population - Taiwan (%)
Place of birth for the foreign-born population - Japan (%)
Place of birth for the foreign-born population - Korea (%)
Place of birth for the foreign-born population - Other Eastern Asia (%)
Place of birth for the foreign-born population - Afghanistan (%)
Place of birth for the foreign-born population - Bangladesh (%)
Place of birth for the foreign-born population - India (%)
Place of birth for the foreign-born population - Iran (%)
Place of birth for the foreign-born population - Kazakhstan (%)
Place of birth for the foreign-born population - Nepal (%)
Place of birth for the foreign-born population - Pakistan (%)
Place of birth for the foreign-born population - Sri Lanka (%)
Place of birth for the foreign-born population - Uzbekistan (%)
Place of birth for the foreign-born population - Other South Central Asia (%)
Place of birth for the foreign-born population - Burma (%)
Place of birth for the foreign-born population - Cambodia (%)
Place of birth for the foreign-born population - Indonesia (%)
Place of birth for the foreign-born population - Laos (%)
Place of birth for the foreign-born population - Malaysia (%)
Place of birth for the foreign-born population - Philippines (%)
Place of birth for the foreign-born population - Singapore (%)
Place of birth for the foreign-born population - Thailand (%)
Place of birth for the foreign-born population - Vietnam (%)
Place of birth for the foreign-born population - Other South Eastern Asia (%)
Place of birth for the foreign-born population - Armenia (%)
Place of birth for the foreign-born population - Iraq (%)
Place of birth for the foreign-born population - Israel (%)
Place of birth for the foreign-born population - Jordan (%)
Place of birth for the foreign-born population - Kuwait (%)
Place of birth for the foreign-born population - Lebanon (%)
Place of birth for the foreign-born population - Saudi Arabia (%)
Place of birth for the foreign-born population - Syria (%)
Place of birth for the foreign-born population - Turkey (%)
Place of birth for the foreign-born population - Yemen (%)
Place of birth for the foreign-born population - Other Western Asia (%)
Place of birth for the foreign-born population - Eritrea (%)
Place of birth for the foreign-born population - Ethiopia (%)
Place of birth for the foreign-born population - Kenya (%)
Place of birth for the foreign-born population - Somalia (%)
Place of birth for the foreign-born population - Uganda (%)
Place of birth for the foreign-born population - Zimbabwe (%)
Place of birth for the foreign-born population - Other Eastern Africa (%)
Place of birth for the foreign-born population - Cameroon (%)
Place of birth for the foreign-born population - Congo (%)
Place of birth for the foreign-born population - Democratic Republic of Congo (Zaire) (%)
Place of birth for the foreign-born population - Other Middle Africa (%)
Place of birth for the foreign-born population - Egypt (%)
Place of birth for the foreign-born population - Morocco (%)
Place of birth for the foreign-born population - Sudan (%)
Place of birth for the foreign-born population - Other Northern Africa (%)
Place of birth for the foreign-born population - South Africa (%)
Place of birth for the foreign-born population - Other Southern Africa (%)
Place of birth for the foreign-born population - Cabo Verde (%)
Place of birth for the foreign-born population - Ghana (%)
Place of birth for the foreign-born population - Liberia (%)
Place of birth for the foreign-born population - Nigeria (%)
Place of birth for the foreign-born population - Senegal (%)
Place of birth for the foreign-born population - Sierra Leone (%)
Place of birth for the foreign-born population - Other Western Africa (%)
Place of birth for the foreign-born population - Australia (%)
Place of birth for the foreign-born population - New Zealand (%)
Place of birth for the foreign-born population - Fiji (%)
Place of birth for the foreign-born population - Micronesia (%)
Place of birth for the foreign-born population - Bahamas (%)
Place of birth for the foreign-born population - Barbados (%)
Place of birth for the foreign-born population - Cuba (%)
Place of birth for the foreign-born population - Dominica (%)
Place of birth for the foreign-born population - Dominican Republic (%)
Place of birth for the foreign-born population - Grenada (%)
Place of birth for the foreign-born population - Haiti (%)
Place of birth for the foreign-born population - Jamaica (%)
Place of birth for the foreign-born population - St. Vincent and the Grenadines (%)
Place of birth for the foreign-born population - Trinidad and Tobago (%)
Place of birth for the foreign-born population - West Indies (%)
Place of birth for the foreign-born population - Other Caribbean (%)
Place of birth for the foreign-born population - Belize (%)
Place of birth for the foreign-born population - Costa Rica (%)
Place of birth for the foreign-born population - El Salvador (%)
Place of birth for the foreign-born population - Guatemala (%)
Place of birth for the foreign-born population - Honduras (%)
Place of birth for the foreign-born population - Mexico (%)
Place of birth for the foreign-born population - Nicaragua (%)
Place of birth for the foreign-born population - Panama (%)
Place of birth for the foreign-born population - Other Central America (%)
Place of birth for the foreign-born population - Argentina (%)
Place of birth for the foreign-born population - Bolivia (%)
Place of birth for the foreign-born population - Brazil (%)
Place of birth for the foreign-born population - Chile (%)
Place of birth for the foreign-born population - Colombia (%)
Place of birth for the foreign-born population - Ecuador (%)
Place of birth for the foreign-born population - Guyana (%)
Place of birth for the foreign-born population - Peru (%)
Place of birth for the foreign-born population - Uruguay (%)
Place of birth for the foreign-born population - Venezuela (%)
Place of birth for the foreign-born population - Other South America (%)
Place of birth for the foreign-born population - Canada (%)
Place of birth for the foreign-born population - Other Northern America (%)
Place of birth for the foreign-born population - Other (%)
Latest news about races in Sacramento, CA collected exclusively by city-data.com from local newspapers, TV, and radio stations
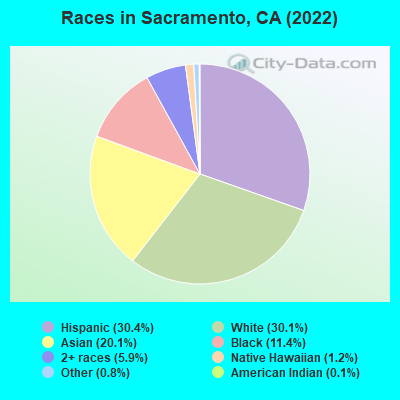
According to 2022 data, the most numerous races in Sacramento, CA are Hispanic (161,733 residents), White alone (155,931 residents), and Asian alone (97,644 residents). 62.6% of Sacramento residents speak English at home. 22.1% of Sacramento, CA residents are foreign-born (10.7% born in Asia, 8.0% born in Latin America), which is 17.8% less than the foreign-born rate of 26.0% across the entire state of California.
Race distribution in Sacramento
2000 2022
164,974 40.5% White alone 87,974 21.6% Hispanic 66,598 16.4% Asian alone 61,136 15.0% Black alone 18,056 4.4% Two or more races 3,637 0.9% Native Hawaiian and Other 3,149 0.8% American Indian alone 1,494 0.4% Other race alone
161,733 31.4% Hispanic 155,931 30.3% White alone 97,644 19.0% Asian alone 56,043 10.9% Black alone 32,346 6.3% Two or more races 9,240 1.8% Native Hawaiian and Other 2,375 0.5% American Indian alone 1,716 0.3% Other race alone
2000 2022
15,816,790 46.7% White alone 10,966,556 32.4% Hispanic 3,648,860 10.8% Asian alone 2,181,926 6.4% Black alone 903,115 2.7% Two or more races 178,984 0.5% American Indian alone 103,736 0.3% Native Hawaiian and Other 71,681 0.2% Other race alone
15,732,184 40.3% Hispanic 13,160,426 33.7% White alone 5,957,867 15.3% Asian alone 2,025,218 5.2% Black alone 1,663,222 4.3% Two or more races 251,618 0.6% Other race alone 135,777 0.3% Native Hawaiian and Other 103,030 0.3% American Indian alone
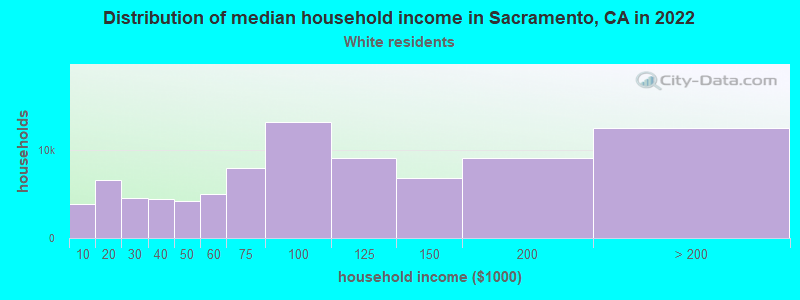
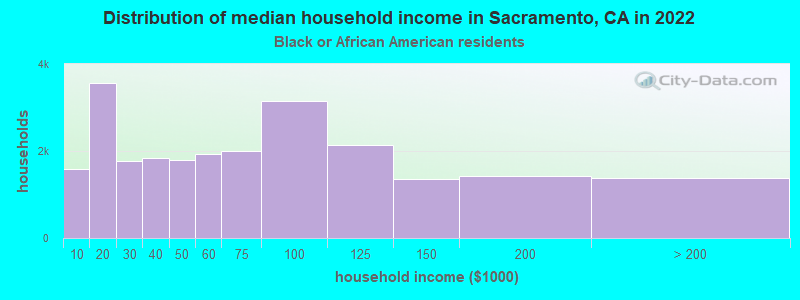
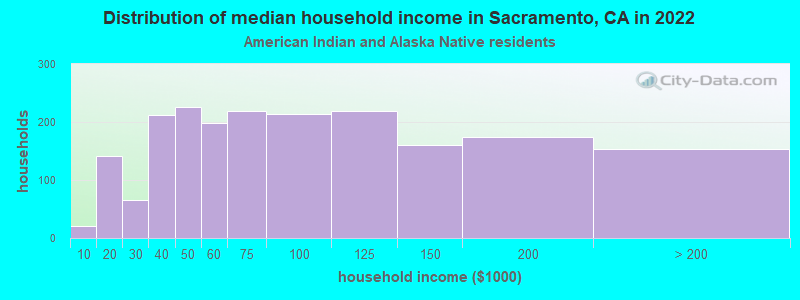
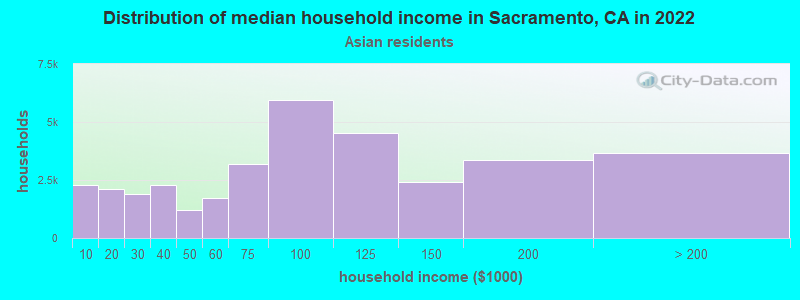
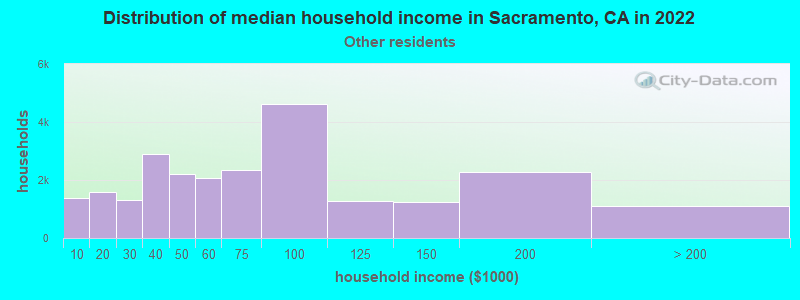
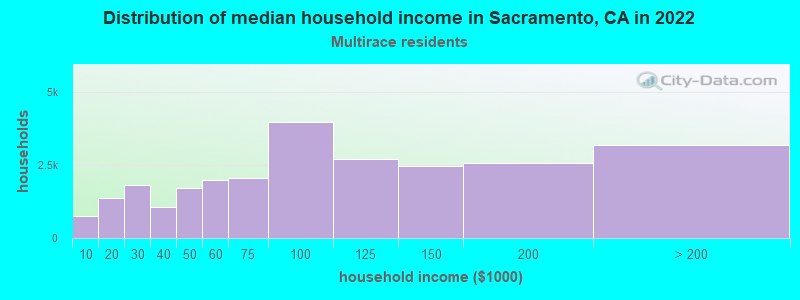
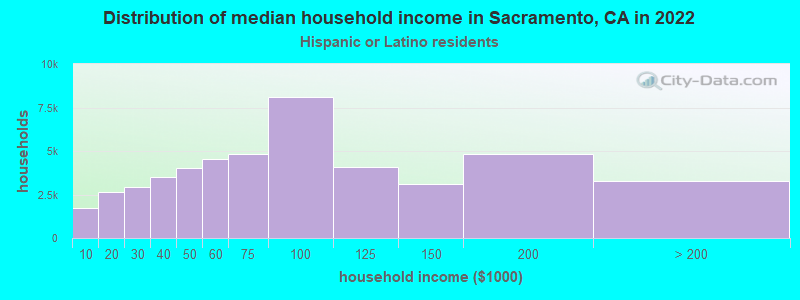
Income and house value in Sacramento Median household income in 2022 $95,170 White non-Hispanic householders$57,944 Black householders$60,116 American Indian and Alaska Native householders$97,373 Asian householders$88,647 Native Hawaiian and other Pacific Islander householders$65,848 Some other race householders$83,313 Two or more races householders$76,207 Hispanic or Latino race householdersMedian 2022 house value $510,380 White Non-Hispanic householders$370,727 Black or African American householders$403,121 American Indian or Alaska Native householders $507,860 Asian householders$394,122 Native Hawaiian and other Pacific Islander householders$341,213 Some other race householders$404,200 Two or more races householders$357,050 Hispanic or Latino householders
Median age by race in Sacramento
41.1 Median age for White residents40.6 42.0 36.0 Median age for Black or African American residents29.8 38.9 32.5 Median age for American Indian / Alaska Native residents21.6 37.4 37.1 Median age for Asian residents35.3 39.5 33.8 Median age for Native Hawaiian / Pacific Islander residents32.8 34.2 29.2 Median age for Other race residents29.2 29.1 29.6 Median age for Two or more races residents23.3 36.7 43.6 Median age for White alone residents42.4 44.7 29.0 Median age for Hispanic or Latino residents29.0 28.9
Owner/renter occupied households by race in Sacramento
House owners and renters - White residents 46,936 55.4% Owner occupied37,760 44.6% Renter occupiedHouse owners and renters - Black or African American residents 9,200 36.3% Owner occupied16,176 63.7% Renter occupiedHouse owners and renters - American Indian / Alaska Native residents 1,026 37.8% Owner occupied1,688 62.2% Renter occupiedHouse owners and renters - Asian residents 19,270 59.0% Owner occupied13,376 41.0% Renter occupiedHouse owners and renters - Native Hawaiian / Pacific Islander residents 1,222 53.1% Owner occupied1,078 46.9% Renter occupiedHouse owners and renters - Other race residents 10,376 39.7% Owner occupied15,788 60.3% Renter occupiedHouse owners and renters - Two or more races residents 15,610 41.9% Owner occupied21,670 58.1% Renter occupiedHouse owners and renters - White alone residents 42,057 55.9% Owner occupied33,130 44.1% Renter occupiedHouse owners and renters - Hispanic or Latino residents 20,010 40.8% Owner occupied29,088 59.2% Renter occupied
Language usage in Sacramento
English speakers - Total 62.6% of residents of Sacramento speak English at home.
18.1% of residents speak Spanish at home 57,695 67.8% Speak English very well27,421 32.2% Speak English less than very well19.6% of residents speak other language at home 52,306 56.5% Speak English very well40,196 43.5% Speak English less than very well
English speakers - Born in the United States 89.4% of residents of Sacramento speak English at home.
5.6% of residents speak Spanish at home 3,835 90.4% Speak English very well406 9.6% Speak English less than very well5.0% of residents speak other language at home 3,144 82.7% Speak English very well658 17.3% Speak English less than very well
English speakers - Native, born elsewhere 51.7% of residents of Sacramento speak English at home.
18.9% of residents speak Spanish at home 1,053 76.5% Speak English very well324 23.5% Speak English less than very well28.8% of residents speak other language at home 1,508 71.9% Speak English very well590 28.1% Speak English less than very well
English speakers - Foreign-born 9.7% of residents of Sacramento speak English at home.
33.1% of residents speak Spanish at home 14,300 39.4% Speak English very well22,039 60.6% Speak English less than very well57.7% of residents speak other language at home 29,280 46.2% Speak English very well34,109 53.8% Speak English less than very well
White (Caucasian) - Speak only English Native:
94.4% (152,513)Foreign-born:
15.9% (2,626)
White (Caucasian) - Speak another language Native:
8.4% (13,616)Foreign-born:
83.4% (13,806)
Black or African American - Speak only English Native:
96.8% (50,077)Foreign-born:
18.6% (533)
Black or African American - Speak another language Native:
3.2% (1,632)Foreign-born:
81.2% (2,323)
American Indian / Alaska Native - Speak only English Native:
66.9% (2,612)Foreign-born:
3.0% (21)
American Indian / Alaska Native - Speak another language Native:
28.9% (1,131)Foreign-born:
97.5% (685)
Asian - Speak only English Native:
50.2% (22,971)Foreign-born:
10.5% (5,109)
Asian - Speak another language Native:
49.3% (22,570)Foreign-born:
89.4% (43,509)
Native Hawaiian / Pacific Islander - Speak only English Native:
37.7% (1,013)Foreign-born:
0.5% (32)
Native Hawaiian / Pacific Islander - Speak another language Native:
58.2% (1,567)Foreign-born:
96.6% (5,586)
Other race - Speak only English Native:
43.3% (25,314)Foreign-born:
3.4% (868)
Other race - Speak another language Native:
58.3% (34,072)Foreign-born:
96.0% (24,600)
Two or more races - Speak only English Native:
66.5% (58,079)Foreign-born:
4.4% (629)
Two or more races - Speak another language Native:
29.0% (25,357)Foreign-born:
100.0% (14,168)
White alone - Speak only English Native:
96.3% (133,113)Foreign-born:
16.7% (1,945)
White alone - Speak another language Native:
3.6% (5,018)Foreign-born:
83.6% (9,712)
Hispanic or Latino - Speak only English Native:
57.1% (65,284)Foreign-born:
5.6% (2,040)
Hispanic or Latino - Speak another language Native:
44.1% (50,346)Foreign-born:
94.4% (34,557)
Foreign-born residents in Sacramento 112,782 residents are foreign born (10.7% Asia , 8.0% Latin America ).
This city:
22.1%California:
100.0%
Marital status for residents in Sacramento Marital status - White (Caucasian) population 15 years and over
Males 37.3% Never married46.1% Now married2.0% Separated2.2% Widowed12.4% DivorcedFemales 34.9% Never married39.9% Now married2.7% Separated7.4% Widowed15.1% DivorcedWomen who gave birth in the past 12 months Now married:
66.7% (1,500)Unmarried:
33.3% (747)
Women who did not give birth in the past 12 months Now married:
38.4% (15,801)Unmarried:
61.6% (25,319)
Marital status - Black or African American population 15 years and over
Males 46.0% Never married31.2% Now married5.6% Separated2.0% Widowed15.2% DivorcedFemales 57.0% Never married15.4% Now married1.4% Separated5.5% Widowed20.7% DivorcedWomen who gave birth in the past 12 months Now married:
61.8% (291)Unmarried:
38.2% (180)
Women who did not give birth in the past 12 months Now married:
11.1% (1,628)Unmarried:
88.9% (13,089)
Marital status - American Indian / Alaska Native population 15 years and over
Males 55.0% Never married31.0% Now married1.0% Separated2.3% Widowed10.7% DivorcedFemales 35.3% Never married25.6% Now married4.3% Separated5.2% Widowed29.6% DivorcedWomen who gave birth in the past 12 months Now married:
31.6% (9)Unmarried:
68.4% (19)
Women who did not give birth in the past 12 months Now married:
29.5% (392)Unmarried:
70.5% (937)
Marital status - Asian population 15 years and over
Males 41.7% Never married48.7% Now married0.7% Separated1.6% Widowed7.3% DivorcedFemales 31.8% Never married50.9% Now married0.5% Separated8.1% Widowed8.7% DivorcedWomen who gave birth in the past 12 months Now married:
95.4% (954)Unmarried:
4.6% (46)
Women who did not give birth in the past 12 months Now married:
43.0% (10,176)Unmarried:
57.0% (13,464)
Marital status - Native Hawaiian / Pacific Islander population 15 years and over
Males 29.2% Never married63.8% Now married1.0% Separated0.0% Widowed6.0% DivorcedFemales 20.0% Never married47.0% Now married9.4% Separated9.6% Widowed14.0% DivorcedWomen who gave birth in the past 12 months Now married:
65.9% (105)Unmarried:
34.1% (55)
Women who did not give birth in the past 12 months Now married:
56.2% (1,254)Unmarried:
43.8% (976)
Marital status - Other race population 15 years and over
Males 51.1% Never married39.8% Now married1.6% Separated0.6% Widowed6.9% DivorcedFemales 42.6% Never married36.6% Now married3.1% Separated5.5% Widowed12.2% DivorcedWomen who gave birth in the past 12 months Now married:
69.7% (951)Unmarried:
30.3% (413)
Women who did not give birth in the past 12 months Now married:
35.3% (9,073)Unmarried:
64.7% (16,645)
Marital status - Two or more races population 15 years and over
Males 61.4% Never married26.4% Now married0.5% Separated1.1% Widowed10.7% DivorcedFemales 61.7% Never married24.3% Now married2.5% Separated2.3% Widowed9.1% DivorcedWomen who gave birth in the past 12 months Now married:
41.7% (606)Unmarried:
58.3% (848)
Women who did not give birth in the past 12 months Now married:
24.9% (9,190)Unmarried:
75.1% (27,714)
Marital status - White alone, not Hispanic / Latino population 15 years and over
Males 34.8% Never married47.1% Now married2.1% Separated2.2% Widowed13.8% DivorcedFemales 33.2% Never married40.0% Now married1.5% Separated8.0% Widowed17.3% DivorcedWomen who gave birth in the past 12 months Now married:
60.1% (1,079)Unmarried:
39.9% (715)
Women who did not give birth in the past 12 months Now married:
38.3% (13,767)Unmarried:
61.7% (22,153)
Marital status - Hispanic or Latino population 15 years and over
Males 49.5% Never married40.1% Now married1.6% Separated1.1% Widowed7.7% DivorcedFemales 44.6% Never married35.7% Now married4.1% Separated4.8% Widowed10.8% DivorcedWomen who gave birth in the past 12 months Now married:
71.3% (1,793)Unmarried:
28.7% (720)
Women who did not give birth in the past 12 months Now married:
34.1% (14,668)Unmarried:
65.9% (28,288)
Ancestries in Sacramento
6,567 2.2% European5,704 1.9% German5,381 1.8% English5,109 1.7% Irish4,909 1.6% American4,250 1.4% Italian2,204 0.7% Russian1,953 0.7% Afghan1,912 0.6% Ukrainian1,431 0.5% Portuguese1,192 0.4% African1,152 0.4% Polish1,071 0.4% Scottish1,009 0.3% Norwegian948 0.3% Romanian933 0.3% British904 0.3% Ethiopian724 0.2% Eastern European694 0.2% Liberian681 0.2% Northern European659 0.2% Greek599 0.2% Nigerian585 0.2% French553 0.2% Swedish542 0.2% Iranian530 0.2% Dutch503 0.2% Arab460 0.2% Danish453 0.2% Scotch-Irish437 0.1% Iraqi427 0.1% Jordanian393 0.1% Egyptian366 0.1% Scandinavian359 0.1% Hungarian356 0.1% Palestinian318 0.1% French Canadian260 0.09% Jamaican249 0.08% Yugoslavian241 0.08% Syrian223 0.07% Slavic186 0.06% Brazilian161 0.05% Welsh158 0.05% Croatian157 0.05% Armenian156 0.05% Lithuanian152 0.05% Kenyan150 0.05% Haitian138 0.05% Swiss130 0.04% Cape Verdean126 0.04% Australian124 0.04% Canadian113 0.04% Ghanaian105 0.04% Czech99 0.03% Basque87 0.03% Bulgarian87 0.03% Turkish78 0.03% Lebanese76 0.03% Austrian76 0.03% Belgian70 0.02% Celtic67 0.02% Serbian65 0.02% Moroccan56 0.02% South African55 0.02% Belizean52 0.02% Finnish32 0.01% Israeli31 0.01% Trinidadian and Tobagonian27 0.01% Slovene25 0.01% Macedonian24 0.01% Cajun22 0.01% Icelander22 0.01% Czechoslovakian22 0.01% Pennsylvania German21 0.01% West Indian17 0.01% Maltese15 0.01% German Russian
Geographical mobility in Sacramento Same house 1 year ago 149,736 82.4% White (Caucasian)47,550 82.0% Black or African American3,713 72.8% American Indian / Alaska Native86,612 88.4% Asian7,491 85.7% Native Hawaiian / Pacific Islander69,746 79.0% Other race91,166 90.1% Two or more races127,469 83.4% White alone, not Hispanic / Latino122,641 84.4% Hispanic or LatinoMoved within same county 18,984 10.4% White / Caucasian5,842 10.1% Black or African American905 17.7% American Indian / Alaska Native6,523 6.7% Asian726 8.3% Native Hawaiian / Pacific Islander10,655 12.1% Other race7,045 7.0% Two or more races13,644 8.9% White alone, not Hispanic / Latino14,003 9.6% Hispanic or LatinoMoved within same state 10,238 5.6% White / Caucasian3,786 6.5% Black or African American163 3.2% American Indian / Alaska Native2,041 2.1% Asian210 2.4% Native Hawaiian / Pacific Islander5,513 6.2% Other race2,385 2.4% Two or more races7,927 5.2% White alone, not Hispanic / Latino6,476 4.5% Hispanic or LatinoMoved from different state 2,208 1.2% White / Caucasian399 0.7% Black or African American77 1.5% American Indian / Alaska Native1,203 1.2% Asian56 0.6% Native Hawaiian / Pacific Islander286 0.3% Other race706 0.7% Two or more races2,848 1.9% White alone, not Hispanic / Latino866 0.6% Hispanic or LatinoMoved from abroad 270 0.1% White150 0.3% Black or African American1,541 1.6% Asian234 2.7% Native Hawaiian / Pacific Islander603 0.7% Other race241 0.2% Two or more races609 0.4% White alone, not Hispanic / Latino317 0.2% Hispanic or Latino
Children Nativity (place of birth) in Sacramento
Children under 6 years - Living with two parents Both parents native 13,297 100.0% NativeBoth parents foreign-born 4,756 98.7% Native60 1.3% Foreign-bornOne native, one foreign-born parent 3,261 100.0% NativeChildren under 6 years - Living with one parent Native parent 10,699 100.0% Native5 0.0% Foreign-bornForeign-born parent 2,038 85.4% Native349 14.6% Foreign-bornChildren 6 to 17 years - Living with two parents Both parents native 18,188 100.0% NativeBoth parents foreign-born 13,246 85.8% Native2,192 14.2% Foreign-bornOne native, one foreign-born parent 5,900 100.0% NativeChildren 6 to 17 years - Living with one parent Native parent 23,603 100.0% NativeForeign-born parent 6,836 53.4% Native5,977 46.6% Foreign-born
Place of birth for residents in Sacramento 54,339 Asia41,506 Americas40,584 Latin America38,795 Central America25,625 South Eastern Asia14,179 Eastern Asia12,141 China12,089 South Central Asia7,560 Europe6,365 Oceania4,838 Eastern Europe3,011 Africa2,217 Western Asia1,125 Western Africa1,113 South America1,062 Western Europe1,035 Northern Europe997 Eastern Africa921 Northern America675 Caribbean618 Southern Europe511 Northern Africa153 Australia and New Zealand Subregion127 Southern Africa90 Middle Africa34,780 Mexico9,685 China8,244 Philippines7,454 India7,286 Vietnam5,964 Laos5,540 Fiji3,166 Thailand2,376 Pakistan2,070 El Salvador1,637 Ukraine1,324 Hong Kong1,131 Taiwan1,067 Afghanistan1,048 Korea973 Russia964 Iraq943 Japan921 Canada850 Guatemala610 Romania586 Germany525 Nicaragua524 Moldova505 Ethiopia499 Iran419 Nigeria382 Syria378 United Kingdom378 Cambodia347 England334 Liberia315 Nepal294 Cuba257 Bosnia and Herzegovina242 Belarus240 Colombia227 Peru227 Poland220 Kenya219 Jordan217 Honduras216 Indonesia210 Burma208 Egypt200 Eritrea196 France182 Greece181 Saudi Arabia177 Italy172 Brazil156 Jamaica152 Argentina150 Costa Rica147 Uzbekistan134 Portugal133 Netherlands128 Israel127 South Africa123 Ecuador123 Kazakhstan122 Malaysia120 Haiti117 Ireland110 Panama106 Spain105 Ghana89 Belize86 Lebanon85 Sierra Leone83 Morocco83 Australia70 Scotland70 New Zealand69 Yemen68 Chile66 Bulgaria66 Austria65 Dominican Republic64 Bangladesh63 Sweden62 Venezuela58 Cameroon58 Turkey49 Serbia47 Sudan46 Cabo Verde43 Denmark42 Switzerland36 Croatia36 Belgium34 Azores Islands34 Singapore33 Lithuania27 Armenia24 Bolivia23 Micronesia22 Kuwait21 Guyana21 Czechoslovakia18 Trinidad and Tobago18 Hungary16 Sri Lanka16 North Macedonia (Macedonia)15 Senegal13 Democratic Republic of Congo (Zaire)6 Uganda6 Latvia5 Norway5 Uruguay4 Somalia
Grandparents responsible for own grandchildren in Sacramento
Grandparents (30 to 59 years) White / Caucasian 511 37.9% Responsible for grandchildren837 62.1% Not responsible for grandchildrenBlack or African American 162 41.7% Responsible for grandchildren227 58.3% Not responsible for grandchildrenAmerican Indian / Alaska Native 22 42.4% Responsible for grandchildren30 57.6% Not responsible for grandchildrenAsian 142 25.4% Responsible for grandchildren418 74.6% Not responsible for grandchildrenNative Hawaiian / Pacific Islander 437 100.0% Not responsible for grandchildrenOther race 344 37.9% Responsible for grandchildren562 62.1% Not responsible for grandchildrenTwo or more races 164 11.7% Responsible for grandchildren1,235 88.3% Not responsible for grandchildrenWhite alone, not Hispanic / Latino 388 36.1% Responsible for grandchildren687 63.9% Not responsible for grandchildrenHispanic or Latino 585 32.0% Responsible for grandchildren1,245 68.0% Not responsible for grandchildrenGrandparents (60 years and over) White / Caucasian 274 11.9% Responsible for grandchildren2,029 88.1% Not responsible for grandchildrenBlack or African American 281 36.2% Responsible for grandchildren496 63.8% Not responsible for grandchildrenAmerican Indian / Alaska Native 53 100.0% Not responsible for grandchildrenAsian 281 11.0% Responsible for grandchildren2,270 89.0% Not responsible for grandchildrenNative Hawaiian / Pacific Islander 72 43.5% Responsible for grandchildren94 56.5% Not responsible for grandchildrenOther race 178 20.8% Responsible for grandchildren680 79.2% Not responsible for grandchildrenTwo or more races 230 20.6% Responsible for grandchildren886 79.4% Not responsible for grandchildrenWhite alone, not Hispanic / Latino 236 13.2% Responsible for grandchildren1,547 86.8% Not responsible for grandchildrenHispanic or Latino 249 11.7% Responsible for grandchildren1,876 88.3% Not responsible for grandchildren
Zip codes: 95811 , 95814 , 95815 , 95816 , 95817 , 95818 , 95819 , 95822 , 95833 , 95834 , 95835 , 95837 .