Races in Safety Harbor, Florida (FL) Detailed Stats
Ancestries, Foreign-born residents, place of birth
Settings
X


Recent posts about races in Safety Harbor, Florida on our local forum with over 2,400,000 registered users:
 | Thinking about a house in Safety Harbor. (7 replies) |
| Safety Harbor vs. East Lake vs. Palm Harbor (27 replies) |
| Updated house in Countryside or Fixer in Safety Harbor? (13 replies) |
| House insurance ranges- Seminole/Safety Harbor/Palm Harbor (20 replies) |
| 2019 Train Noise in Safety Harbor? (9 replies) |
| New Port Richey, Palm Harbor or Dunedin (68 replies) |
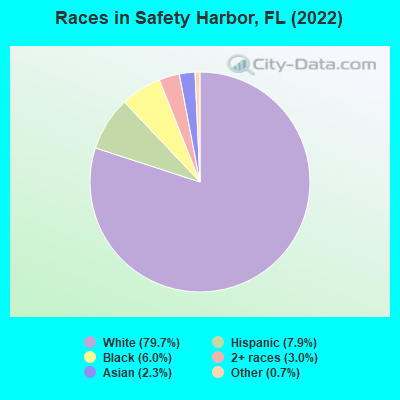
According to 2022 data, the most numerous races in Safety Harbor, FL are White alone (13,649 residents), Hispanic (1,354 residents), and Black alone (1,029 residents). 92.0% of Safety Harbor residents speak English at home. 9.3% of Safety Harbor, FL residents are foreign-born (4.6% born in Latin America, 2.3% born in Asia), which is 125.5% less than the foreign-born rate of 21.0% across the entire state of Florida.
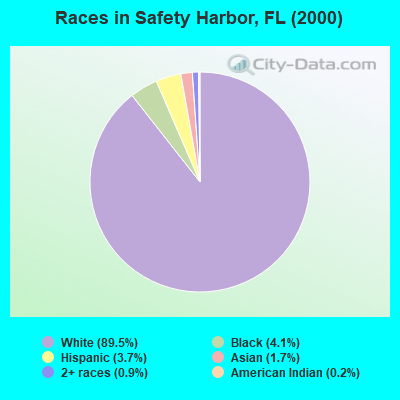
Race distribution in Safety Harbor
2000
2022

- 15,39089.5%White alone
- 6984.1%Black alone
- 6283.7%Hispanic
- 2861.7%Asian alone
- 1560.9%Two or more races
- 310.2%American Indian alone
- 90.05%Other race alone
- 50.03%Native Hawaiian and Other
Pacific Islander alone
-
- 13,64979.7%White alone
- 1,3547.9%Hispanic
- 1,0296.0%Black alone
- 5213.0%Two or more races
- 3902.3%Asian alone
- 1200.7%Other race alone
- 110.06%American Indian alone
2000
2022
-
- 10,458,50965.4%White alone
- 2,682,71516.8%Hispanic
- 2,264,26814.2%Black alone
- 261,6931.6%Asian alone
- 236,9541.5%Two or more races
- 42,3580.3%American Indian alone
- 28,9940.2%Other race alone
- 6,8870.04%Native Hawaiian and Other
Pacific Islander alone

-
- 11,309,40350.8%White alone
- 6,025,03927.1%Hispanic
- 3,241,01514.6%Black alone
- 861,6303.9%Two or more races
- 623,6922.8%Asian alone
- 152,0540.7%Other race alone
- 22,5040.1%American Indian alone
- 9,4860.04%Native Hawaiian and Other
Pacific Islander alone

Income and house value in Safety Harbor
- Median household income in 2022
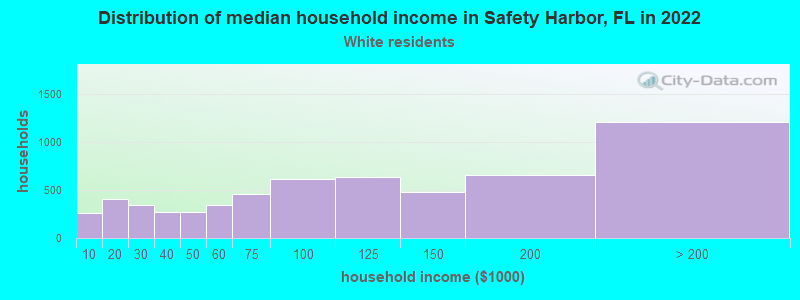
- $97,344White non-Hispanic householders
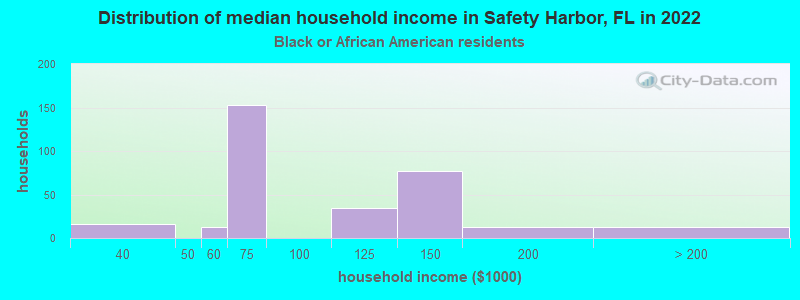
- $64,025Black householders
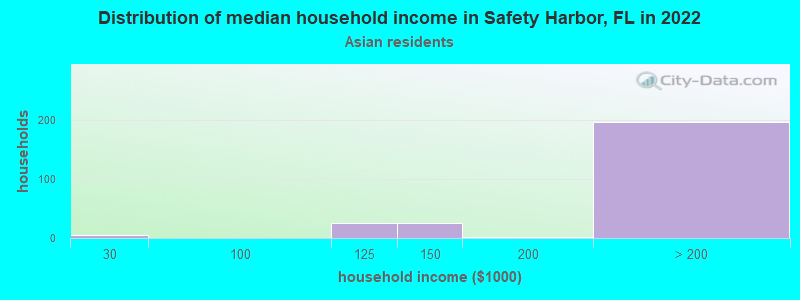
- over $200,000Asian householders
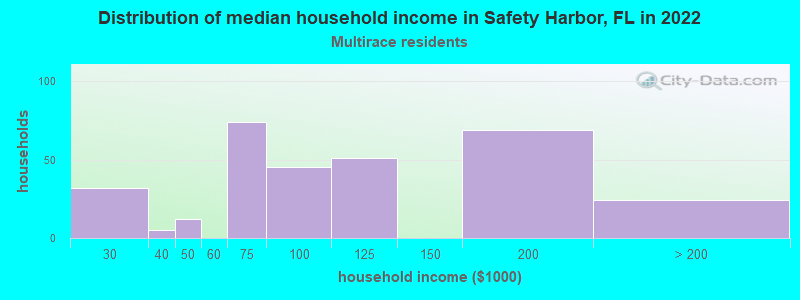
- $85,282Two or more races householders
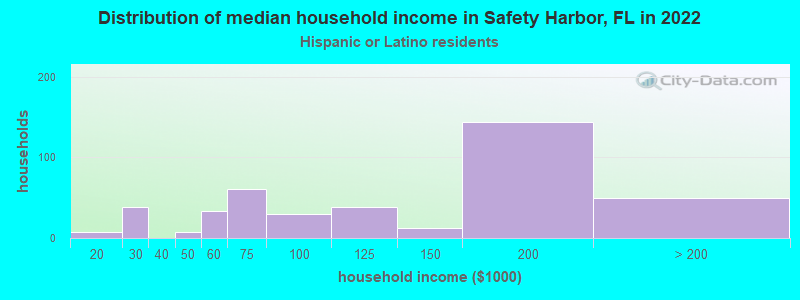
- $124,969Hispanic or Latino race householders
- Median 2022 house value
- $537,771White Non-Hispanic householders
- $274,825Black or African American householders
- $391,646Asian householders
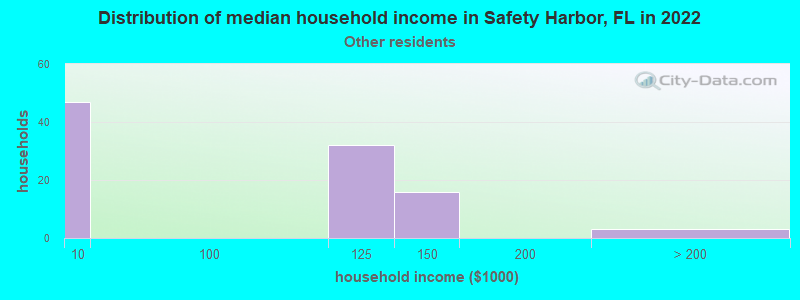
- $635,187Some other race householders
- $742,504Two or more races householders
- $688,252Hispanic or Latino householders
Household income for White non-Hispanic householders
Household income for Black householders
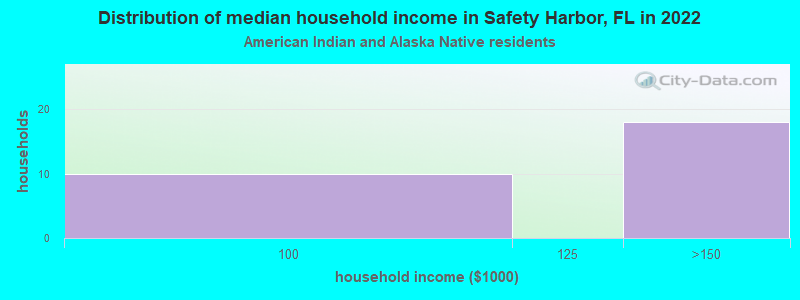
Household income for American Indian and Alaska Native householders
Household income for Asian householders
Household income for Some other race householders
Household income for Two or more races householders
Household income for Hispanic or Latino race householders
Median age by race in Safety Harbor
- 47.8Median age for White residents
- 45.2Males
- 50.1Females
- 53.1Median age for Black or African American residents
- 54.6Males
- 49.1Females
- 7.1Median age for American Indian / Alaska Native residents
- -535,303,776.1Males
- 6.9Females
- 44.7Median age for Asian residents
- 56.8Males
- 38.4Females
- -556,089,743.0Median age for Native Hawaiian / Pacific Islander residents
- -663,446,054.1Males
- -373,522,458.3Females
- 56.2Median age for Other race residents
- 27.5Males
- 60.5Females
- 50.3Median age for Two or more races residents
- 48.0Males
- 52.5Females
- 48.8Median age for White alone residents
- 46.3Males
- 50.0Females
- 36.4Median age for Hispanic or Latino residents
- 35.8Males
- 47.6Females
Owner/renter occupied households by race in Safety Harbor
- House owners and renters - White residents
- 4,83982.0%Owner occupied
- 1,06018.0%Renter occupied
- House owners and renters - Black or African American residents
- 24079.7%Owner occupied
- 6120.3%Renter occupied
- House owners and renters - American Indian / Alaska Native residents
- 830.8%Owner occupied
- 1769.2%Renter occupied
- House owners and renters - Asian residents
- 211100.0%Owner occupied
- House owners and renters - Other race residents
- 3148.6%Owner occupied
- 3351.4%Renter occupied
- House owners and renters - Two or more races residents
- 21670.2%Owner occupied
- 9229.8%Renter occupied
- House owners and renters - White alone residents
- 4,69281.2%Owner occupied
- 1,08818.8%Renter occupied
- House owners and renters - Hispanic or Latino residents
- 32180.4%Owner occupied
- 7819.6%Renter occupied
Language usage in Safety Harbor
- English speakers - Total
- 92.0% of residents of Safety Harbor speak English at home.
- 4.1% of residents speak Spanish at home
- 38357.8%Speak English very well
- 28042.2%Speak English less than very well
- 3.5% of residents speak other language at home
- 48885.6%Speak English very well
- 8214.4%Speak English less than very well
- English speakers - Born in the United States
- 96.7% of residents of Safety Harbor speak English at home.
- 2.9% of residents speak Spanish at home
- 22180.4%Speak English very well
- 5419.6%Speak English less than very well
- 0.5% of residents speak other language at home
- 43100.0%Speak English very well
- English speakers - Native, born elsewhere
- 37.0% of residents of Safety Harbor speak English at home.
- 38.7% of residents speak Spanish at home
- 7665.5%Speak English very well
- 4034.5%Speak English less than very well
- 17.7% of residents speak other language at home
- 53100.0%Speak English very well
- English speakers - Foreign-born
- 56.9% of residents of Safety Harbor speak English at home.
- 14.0% of residents speak Spanish at home
- 6127.7%Speak English very well
- 15972.3%Speak English less than very well
- 26.1% of residents speak other language at home
- 32980.2%Speak English very well
- 8119.8%Speak English less than very well
White (Caucasian) - Speak only English
| Native: | 98.2% (12,435) |
| Foreign-born: | 54.2% (276) |
White (Caucasian) - Speak another language
| Native: | 2.2% (282) |
| Foreign-born: | 46.2% (235) |
Black or African American - Speak only English
| Native: | 93.7% (653) |
| Foreign-born: | 100.0% (322) |
American Indian / Alaska Native - Speak only English
| Native: | 77.0% (34) |
| Foreign-born: | 61.4% (24) |
Asian - Speak only English
| Native: | 97.9% (97) |
| Foreign-born: | 48.1% (133) |
Other race - Speak only English
| Native: | 100.0% (100) |
| Foreign-born: | 67.7% (77) |
Two or more races - Speak another language
| Native: | 35.3% (268) |
| Foreign-born: | 99.3% (279) |
White alone - Speak only English
| Native: | 98.1% (12,026) |
| Foreign-born: | 59.0% (283) |
White alone - Speak another language
| Native: | 2.0% (243) |
| Foreign-born: | 38.6% (186) |
Hispanic or Latino - Speak only English
| Native: | 65.6% (672) |
| Foreign-born: | 21.4% (63) |
Hispanic or Latino - Speak another language
| Native: | 33.3% (340) |
| Foreign-born: | 70.4% (206) |
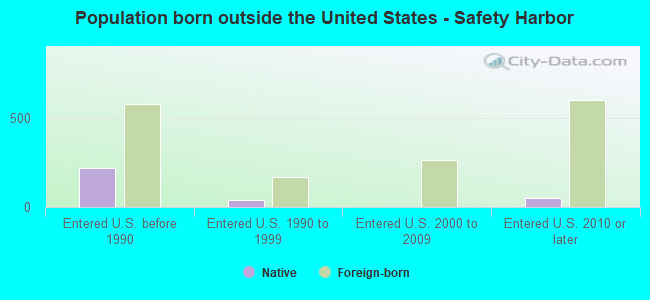
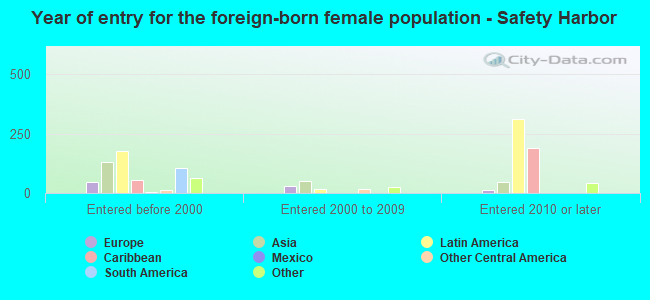
Foreign-born residents in Safety Harbor
1,594 residents are foreign born (4.6% Latin America, 2.3% Asia).
| This city: | 9.3% |
| Florida: | 21.1% |

Marital status for residents in Safety Harbor
Marital status - White (Caucasian) population 15 years and over
- Males
- 27.3%Never married
- 57.3%Now married
- 0.0%Separated
- 3.5%Widowed
- 11.9%Divorced
- Females
- 22.9%Never married
- 49.4%Now married
- 0.8%Separated
- 13.5%Widowed
- 13.4%Divorced
Women who gave birth in the past 12 months
| Now married: | 100.0% (285) |
| Unmarried: | 0.0% (0) |
Women who did not give birth in the past 12 months
| Now married: | 35.7% (838) |
| Unmarried: | 64.3% (1,512) |
Marital status - Black or African American population 15 years and over
- Males
- 25.2%Never married
- 43.0%Now married
- 0.0%Separated
- 2.3%Widowed
- 29.6%Divorced
- Females
- 52.3%Never married
- 28.0%Now married
- 0.1%Separated
- 12.5%Widowed
- 7.1%Divorced
Women who did not give birth in the past 12 months
| Now married: | 32.3% (139) |
| Unmarried: | 67.7% (291) |
Marital status - American Indian / Alaska Native population 15 years and over
- Males
- 0.0%Never married
- 100.0%Now married
- 0.0%Separated
- 0.0%Widowed
- 0.0%Divorced
- Females
- 0.0%Never married
- 0.0%Now married
- 0.0%Separated
- 100.0%Widowed
- 0.0%Divorced
Marital status - Asian population 15 years and over
- Males
- 0.0%Never married
- 100.0%Now married
- 0.0%Separated
- 0.0%Widowed
- 0.0%Divorced
- Females
- 58.6%Never married
- 41.4%Now married
- 0.0%Separated
- 0.0%Widowed
- 0.0%Divorced
Women who gave birth in the past 12 months
| Now married: | 0.0% (0) |
| Unmarried: | 100.0% (29) |
Women who did not give birth in the past 12 months
| Now married: | 55.0% (69) |
| Unmarried: | 45.0% (56) |
Marital status - Other race population 15 years and over
- Males
- 61.7%Never married
- 38.3%Now married
- 0.0%Separated
- 0.0%Widowed
- 0.0%Divorced
- Females
- 10.8%Never married
- 89.2%Now married
- 0.0%Separated
- 0.0%Widowed
- 0.0%Divorced
Women who did not give birth in the past 12 months
| Now married: | 0.0% (0) |
| Unmarried: | 100.0% (6) |
Marital status - Two or more races population 15 years and over
- Males
- 18.0%Never married
- 66.6%Now married
- 0.0%Separated
- 0.0%Widowed
- 15.4%Divorced
- Females
- 42.9%Never married
- 39.4%Now married
- 0.0%Separated
- 8.7%Widowed
- 9.1%Divorced
Women who did not give birth in the past 12 months
| Now married: | 21.5% (41) |
| Unmarried: | 78.5% (150) |
Marital status - White alone, not Hispanic / Latino population 15 years and over
- Males
- 27.4%Never married
- 56.4%Now married
- 0.0%Separated
- 3.5%Widowed
- 12.7%Divorced
- Females
- 22.6%Never married
- 49.8%Now married
- 0.8%Separated
- 13.8%Widowed
- 12.9%Divorced
Women who gave birth in the past 12 months
| Now married: | 100.0% (298) |
| Unmarried: | 0.0% (0) |
Women who did not give birth in the past 12 months
| Now married: | 36.0% (852) |
| Unmarried: | 64.0% (1,516) |
Marital status - Hispanic or Latino population 15 years and over
- Males
- 32.6%Never married
- 60.3%Now married
- 0.0%Separated
- 1.6%Widowed
- 5.4%Divorced
- Females
- 32.2%Never married
- 25.7%Now married
- 0.3%Separated
- 21.3%Widowed
- 20.4%Divorced
Women who did not give birth in the past 12 months
| Now married: | 22.4% (41) |
| Unmarried: | 77.6% (141) |
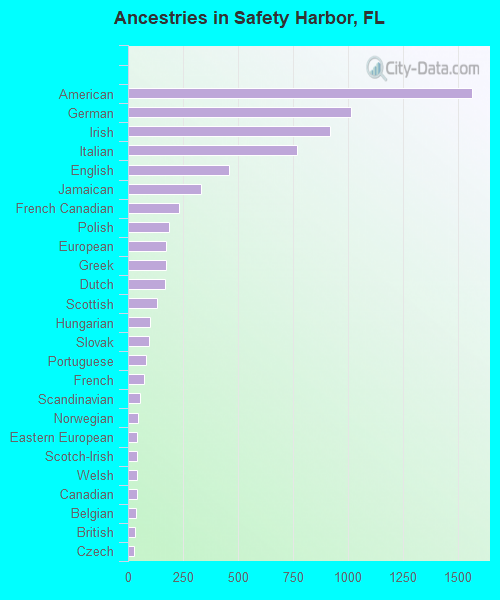
Ancestries in Safety Harbor

- 1,56318.2%American
- 1,01611.8%German
- 91910.7%Irish
- 7678.9%Italian
- 4575.3%English
- 3343.9%Jamaican
- 2312.7%French Canadian
- 1872.2%Polish
- 1752.0%European
- 1742.0%Greek
- 1682.0%Dutch
- 1301.5%Scottish
- 991.2%Hungarian
- 941.1%Slovak
- 821.0%Portuguese
- 710.8%French
- 550.6%Scandinavian
- 450.5%Norwegian
- 430.5%Eastern European
- 420.5%Scotch-Irish
- 420.5%Welsh
- 400.5%Canadian
- 360.4%Belgian
- 300.3%British
- 290.3%Czech
- 270.3%Turkish
- 220.3%Austrian
- 220.3%Brazilian
- 140.2%Swiss
- 130.2%Lebanese
- 110.1%Swedish
- 90.1%Trinidadian and Tobagonian
- 80.09%Yugoslavian
- 50.06%Serbian
- 30.03%Croatian
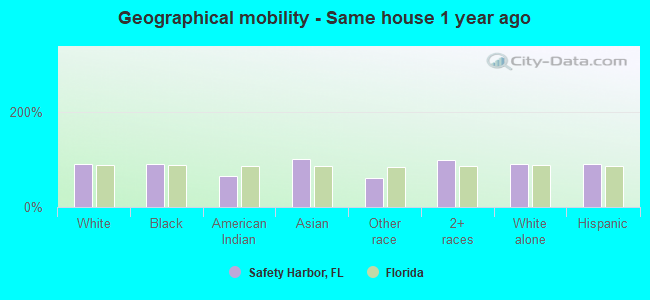
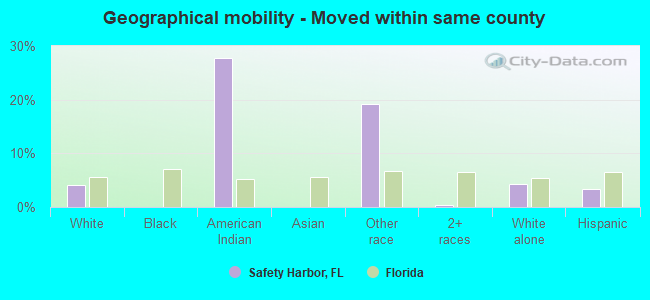
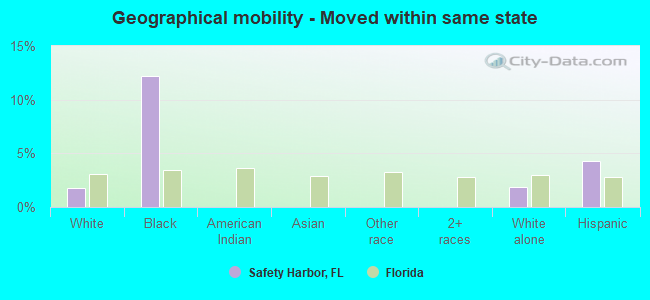
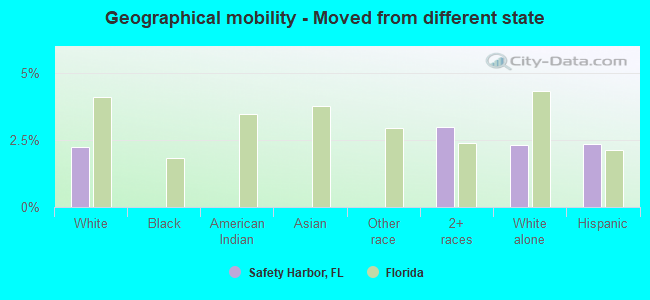
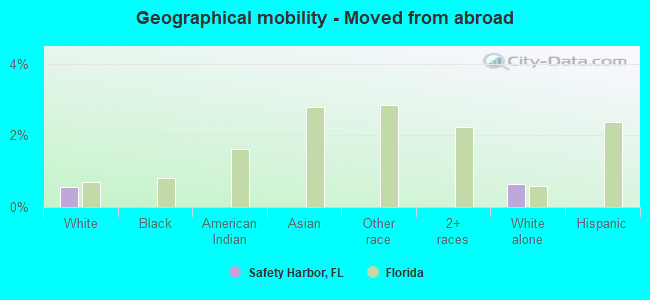
Geographical mobility in Safety Harbor

- Same house 1 year ago
- 12,36290.8%White (Caucasian)
- 95990.4%Black or African American
- 5466.2%American Indian / Alaska Native
- 394100.0%Asian
- 12961.5%Other race
- 1,10199.1%Two or more races
- 11,96490.4%White alone, not Hispanic / Latino
- 1,22591.0%Hispanic or Latino
-
- Moved within same county
- 5514.0%White / Caucasian
- 10.1%Black or African American
- 2227.7%American Indian / Alaska Native
- 4019.2%Other race
- 50.4%Two or more races
- 5684.3%White alone, not Hispanic / Latino
- 463.4%Hispanic or Latino
-
- Moved within same state
- 2401.8%White / Caucasian
- 13012.2%Black or African American
- 2431.8%White alone, not Hispanic / Latino
- 584.3%Hispanic or Latino
-
- Moved from different state
- 3042.2%White / Caucasian
- 333.0%Two or more races
- 3052.3%White alone, not Hispanic / Latino
- 322.4%Hispanic or Latino
-
- Moved from abroad
- 770.6%White
- 860.6%White alone, not Hispanic / Latino
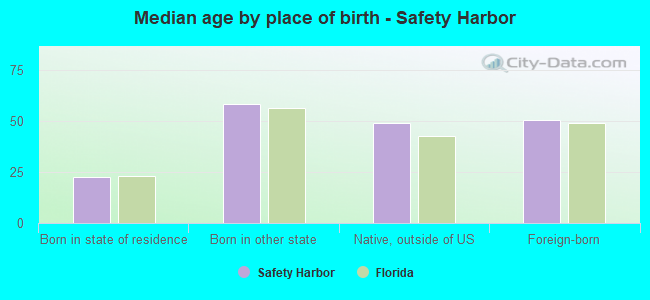
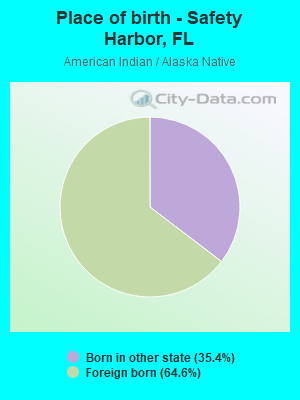
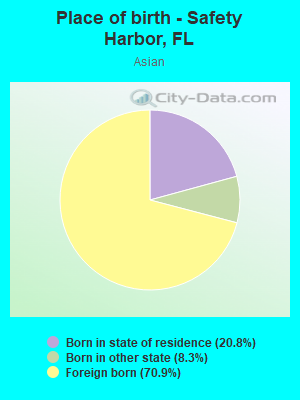
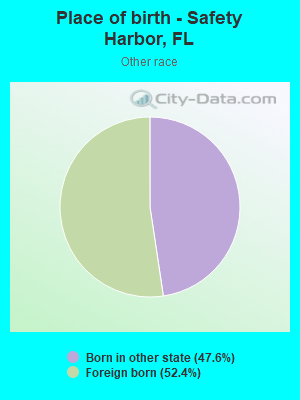
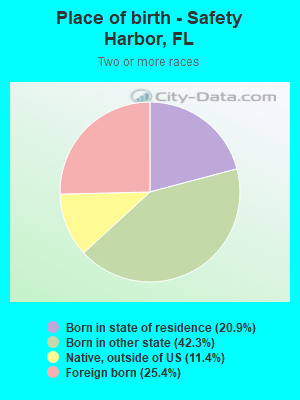
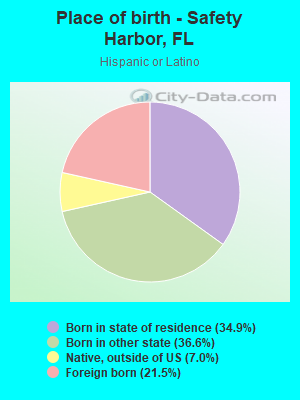
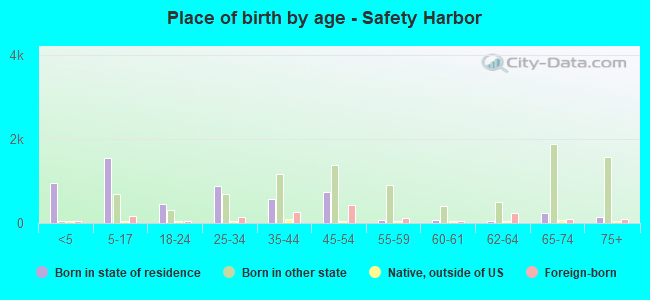
Children Nativity (place of birth) in Safety Harbor
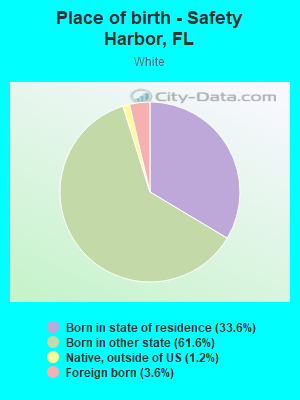
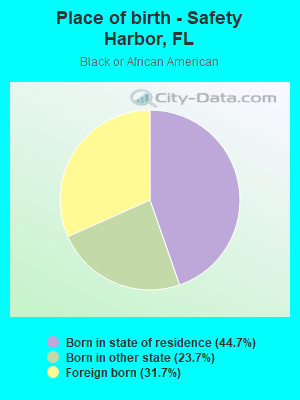
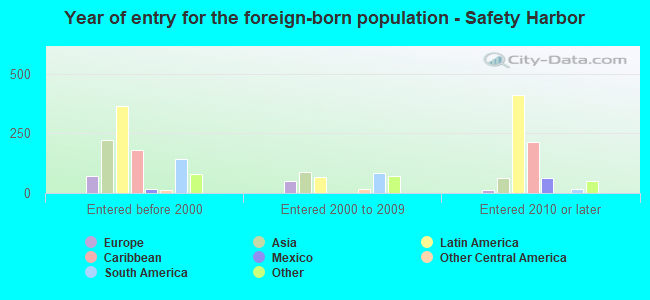
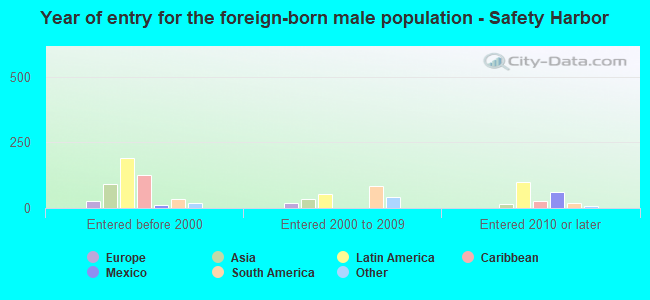
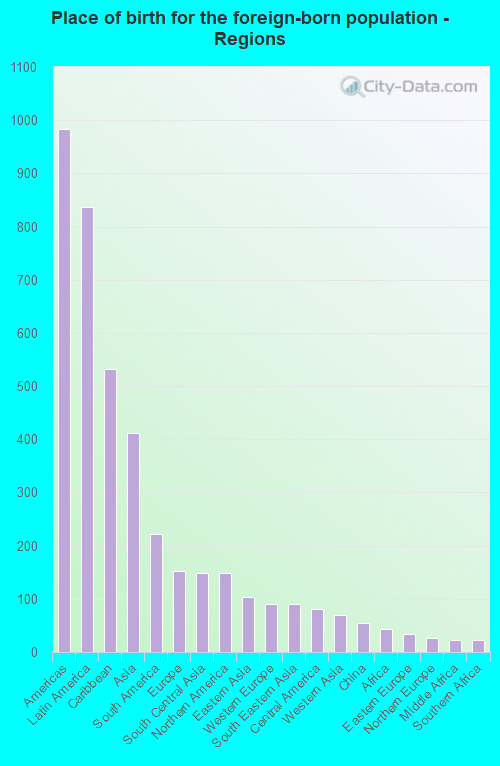
Place of birth for residents in Safety Harbor
![Place of birth for the foreign-born population - Regions]()
- 984Americas
- 836Latin America
- 533Caribbean
- 412Asia
- 222South America
- 152Europe
- 149South Central Asia
- 148Northern America
- 103Eastern Asia
- 90Western Europe
- 90South Eastern Asia
- 80Central America
- 69Western Asia
- 55China
- 44Africa
- 34Eastern Europe
- 27Northern Europe
- 22Middle Africa
- 22Southern Africa
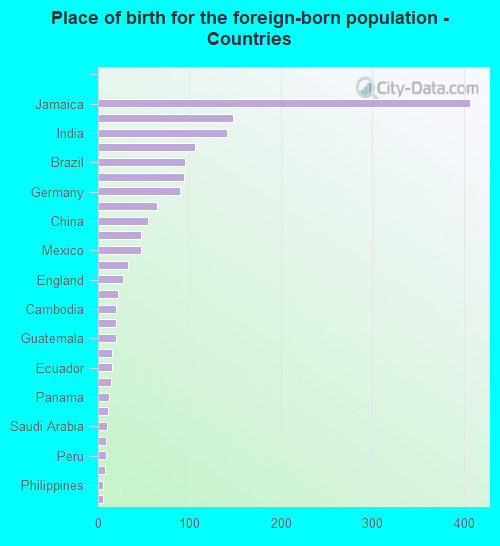
![Place of birth for the foreign-born population - Countries]()
- 407Jamaica
- 148Canada
- 141India
- 106Cuba
- 95Brazil
- 94Argentina
- 90Germany
- 64Vietnam
- 55China
- 47Japan
- 47Mexico
- 33Kuwait
- 27England
- 22South Africa
- 20Cambodia
- 20Trinidad and Tobago
- 20Guatemala
- 15Turkey
- 15Ecuador
- 14Bosnia and Herzegovina
- 12Panama
- 11Ukraine
- 10Saudi Arabia
- 9Israel
- 9Peru
- 8Nepal
- 6Philippines
- 6Venezuela
Grandparents responsible for own grandchildren in Safety Harbor
Zip codes: 34695.