Races in Salt River, Arizona (AZ) Detailed Stats
Ancestries, Foreign-born residents, place of birth
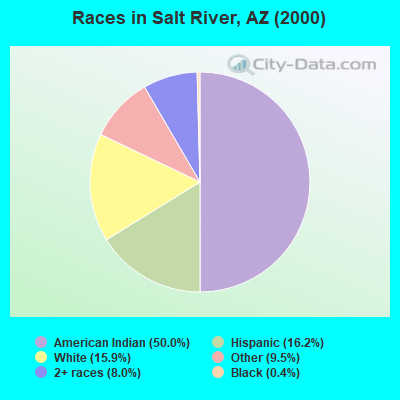
Race distribution in Salt River

- 3,61350.0%American Indian alone
- 1,17016.2%Hispanic
- 1,14615.9%White alone
- 6849.5%Other race alone
- 5778.0%Two or more races
- 270.4%Black alone
- 70.10%Asian alone
- 30.04%Native Hawaiian and Other
Pacific Islander alone
2000
2022
-
- 3,274,25863.8%White alone
- 1,295,61725.3%Hispanic
- 233,3704.5%American Indian alone
- 149,9412.9%Black alone
- 89,3151.7%Asian alone
- 76,3721.5%Two or more races
- 6,1200.1%Other race alone
- 5,6390.1%Native Hawaiian and Other
Pacific Islander alone

-
- 3,814,58751.8%White alone
- 2,388,52032.5%Hispanic
- 322,4594.4%Black alone
- 284,9943.9%Two or more races
- 257,0203.5%Asian alone
- 241,6883.3%American Indian alone
- 36,0420.5%Other race alone
- 13,8870.2%Native Hawaiian and Other
Pacific Islander alone

Income and house value in Salt River
- Median household income in 2022
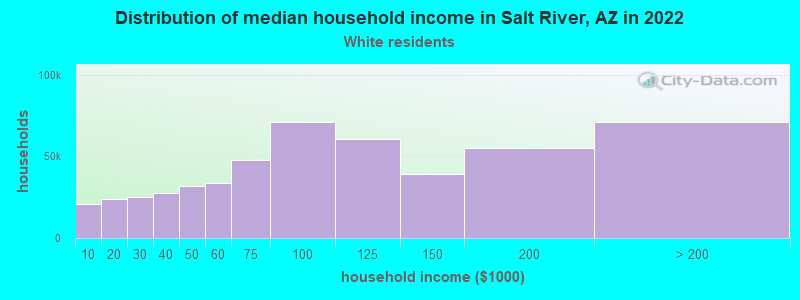
- $39,816White non-Hispanic householders
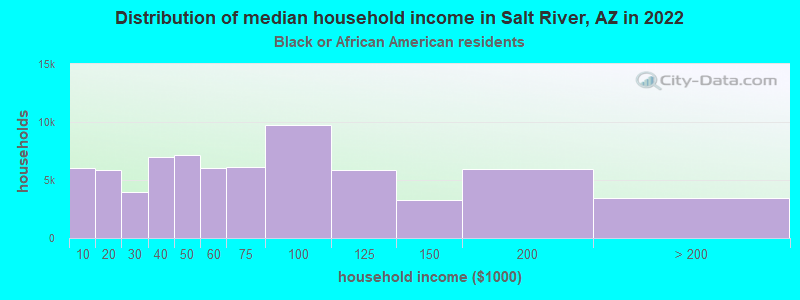
- $57,585Black householders
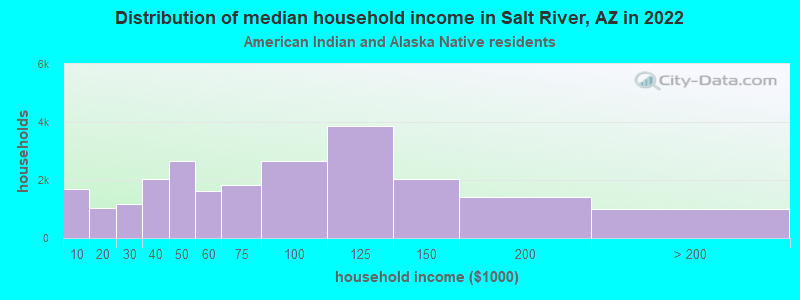
- $61,488American Indian and Alaska Native householders
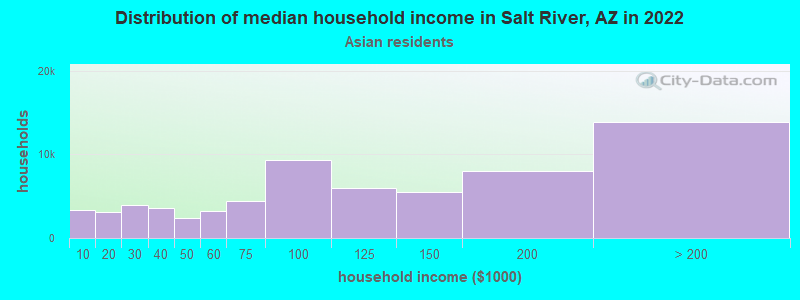
- $94,555Asian householders
- over $200,000Native Hawaiian and other Pacific Islander householders
- $60,839Some other race householders
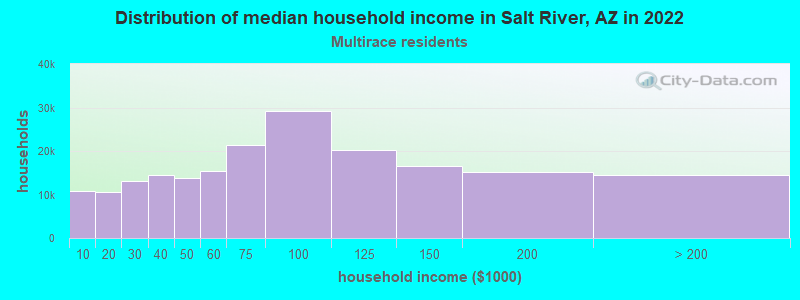
- $58,649Two or more races householders
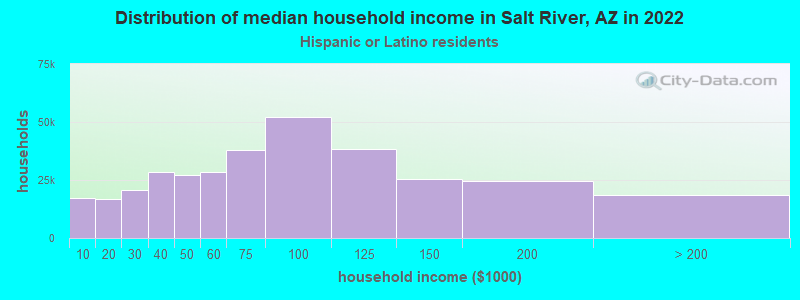
- $58,428Hispanic or Latino race householders
- Median 2022 house value
- $414,213White Non-Hispanic householders
- $265,465American Indian or Alaska Native householders
- $441,091Asian householders
- $276,142Native Hawaiian and other Pacific Islander householders
- $272,460Some other race householders
- $321,061Two or more races householders
- $352,726Hispanic or Latino householders
Household income for White non-Hispanic householders
Household income for Black householders
Household income for American Indian and Alaska Native householders
Household income for Asian householders
Household income for Native Hawaiian and other Pacific Islander householders

Household income for Two or more races householders
Household income for Hispanic or Latino race householders
Zip code: 85256