Races in San Marcos, California (CA) Detailed Stats
Data:
Races - White alone (%)
Races - White alone (% change since 2000)
Races - Black alone (%)
Races - Black alone (% change since 2000)
Races - American Indian alone (%)
Races - American Indian alone (% change since 2000)
Races - Asian alone (%)
Races - Asian alone (% change since 2000)
Races - Hispanic (%)
Races - Hispanic (% change since 2000)
Races - Native Hawaiian and Other Pacific Islander alone (%)
Races - Native Hawaiian and Other Pacific Islander alone (% change since 2000)
Races - Two or more races(%)
Races - Two or more races(% change since 2000)
Races - Other race alone (%)
Races - Other race alone (% change since 2000)
Racial diversity
Place of birth - Born in state of residence (%)
Place of birth - Born in state of residence (%) - White
Place of birth - Born in state of residence (%) - Black or African American
Place of birth - Born in state of residence (%) - Asian
Place of birth - Born in state of residence (%) - Hispanic or Latino
Place of birth - Born in state of residence (%) - American Indian and Alaska Native
Place of birth - Born in state of residence (%) - Multirace
Place of birth - Born in state of residence (%) - Other Race
Place of birth - Born in other state (%)
Place of birth - Born in other state (%) - White
Place of birth - Born in other state (%) - Black or African American
Place of birth - Born in other state (%) - Asian
Place of birth - Born in other state (%) - Hispanic or Latino
Place of birth - Born in other state (%) - American Indian and Alaska Native
Place of birth - Born in other state (%) - Multirace
Place of birth - Born in other state (%) - Other Race
Place of birth - Native, outside of US (%)
Place of birth - Native, outside of US (%) - White
Place of birth - Native, outside of US (%) - Black or African American
Place of birth - Native, outside of US (%) - Asian
Place of birth - Native, outside of US (%) - Hispanic or Latino
Place of birth - Native, outside of US (%) - American Indian and Alaska Native
Place of birth - Native, outside of US (%) - Multirace
Place of birth - Native, outside of US (%) - Other Race
Place of birth - Foreign born (%)
Place of birth - Foreign born (%) - White
Place of birth - Foreign born (%) - Black or African American
Place of birth - Foreign born (%) - Asian
Place of birth - Foreign born (%) - Hispanic or Latino
Place of birth - Foreign born (%) - American Indian and Alaska Native
Place of birth - Foreign born (%) - Multirace
Place of birth - Foreign born (%) - Other Race
Residents speaking English at home (%)
Residents speaking English at home - Born in the United States (%)
Residents speaking English at home - Native, born elsewhere (%)
Residents speaking English at home - Foreign born (%)
Residents speaking Spanish at home (%)
Residents speaking Spanish at home - Born in the United States (%)
Residents speaking Spanish at home - Native, born elsewhere (%)
Residents speaking Spanish at home - Foreign born (%)
Residents speaking other language at home (%)
Residents speaking other language at home - Born in the United States (%)
Residents speaking other language at home - Native, born elsewhere (%)
Residents speaking other language at home - Foreign born (%)
Marital status - Never married (%)
Marital status - Now married (%)
Marital status - Separated (%)
Marital status - Widowed (%)
Marital status - Divorced (%)
Ancestries Reported - Arab (%)
Ancestries Reported - Czech (%)
Ancestries Reported - Danish (%)
Ancestries Reported - Dutch (%)
Ancestries Reported - English (%)
Ancestries Reported - French (%)
Ancestries Reported - French Canadian (%)
Ancestries Reported - German (%)
Ancestries Reported - Greek (%)
Ancestries Reported - Hungarian (%)
Ancestries Reported - Irish (%)
Ancestries Reported - Italian (%)
Ancestries Reported - Lithuanian (%)
Ancestries Reported - Norwegian (%)
Ancestries Reported - Polish (%)
Ancestries Reported - Portuguese (%)
Ancestries Reported - Russian (%)
Ancestries Reported - Scotch-Irish (%)
Ancestries Reported - Scottish (%)
Ancestries Reported - Slovak (%)
Ancestries Reported - Subsaharan African (%)
Ancestries Reported - Swedish (%)
Ancestries Reported - Swiss (%)
Ancestries Reported - Ukrainian (%)
Ancestries Reported - United States (%)
Ancestries Reported - Welsh (%)
Ancestries Reported - West Indian (%)
Ancestries Reported - Other (%)
Geographical mobility - Same house 1 year ago (%)
Geographical mobility - Same house 1 year ago (%) - White
Geographical mobility - Same house 1 year ago (%) - Black or African American
Geographical mobility - Same house 1 year ago (%) - Asian
Geographical mobility - Same house 1 year ago (%) - Hispanic or Latino
Geographical mobility - Same house 1 year ago (%) - American Indian and Alaska Native
Geographical mobility - Same house 1 year ago (%) - Multirace
Geographical mobility - Same house 1 year ago (%) - Other Race
Geographical mobility - Moved within same county (%)
Geographical mobility - Moved within same county (%) - White
Geographical mobility - Moved within same county (%) - Black or African American
Geographical mobility - Moved within same county (%) - Asian
Geographical mobility - Moved within same county (%) - Hispanic or Latino
Geographical mobility - Moved within same county (%) - American Indian and Alaska Native
Geographical mobility - Moved within same county (%) - Multirace
Geographical mobility - Moved within same county (%) - Other Race
Geographical mobility - Moved from different county within same state (%)
Geographical mobility - Moved from different county within same state (%) - White
Geographical mobility - Moved from different county within same state (%) - Black or African American
Geographical mobility - Moved from different county within same state (%) - Asian
Geographical mobility - Moved from different county within same state (%) - Hispanic or Latino
Geographical mobility - Moved from different county within same state (%) - American Indian and Alaska Native
Geographical mobility - Moved from different county within same state (%) - Multirace
Geographical mobility - Moved from different county within same state (%) - Other Race
Geographical mobility - Moved from different state (%)
Geographical mobility - Moved from different state (%) - White
Geographical mobility - Moved from different state (%) - Black or African American
Geographical mobility - Moved from different state (%) - Asian
Geographical mobility - Moved from different state (%) - Hispanic or Latino
Geographical mobility - Moved from different state (%) - American Indian and Alaska Native
Geographical mobility - Moved from different state (%) - Multirace
Geographical mobility - Moved from different state (%) - Other Race
Geographical mobility - Moved from abroad (%)
Geographical mobility - Moved from abroad (%) - White
Geographical mobility - Moved from abroad (%) - Black or African American
Geographical mobility - Moved from abroad (%) - Asian
Geographical mobility - Moved from abroad (%) - Hispanic or Latino
Geographical mobility - Moved from abroad (%) - American Indian and Alaska Native
Geographical mobility - Moved from abroad (%) - Multirace
Geographical mobility - Moved from abroad (%) - Other Race
Place of birth for the foreign-born population - Ireland (%)
Place of birth for the foreign-born population - Denmark (%)
Place of birth for the foreign-born population - Norway (%)
Place of birth for the foreign-born population - Sweden (%)
Place of birth for the foreign-born population - United Kingdom (%)
Place of birth for the foreign-born population - England (%)
Place of birth for the foreign-born population - Scotland (%)
Place of birth for the foreign-born population - Other Northern Europe (%)
Place of birth for the foreign-born population - Austria (%)
Place of birth for the foreign-born population - Belgium (%)
Place of birth for the foreign-born population - France (%)
Place of birth for the foreign-born population - Germany (%)
Place of birth for the foreign-born population - Netherlands (%)
Place of birth for the foreign-born population - Switzerland (%)
Place of birth for the foreign-born population - Other Western Europe (%)
Place of birth for the foreign-born population - Greece (%)
Place of birth for the foreign-born population - Italy (%)
Place of birth for the foreign-born population - Portugal (%)
Place of birth for the foreign-born population - Spain (%)
Place of birth for the foreign-born population - Other Southern Europe (%)
Place of birth for the foreign-born population - Albania (%)
Place of birth for the foreign-born population - Belarus (%)
Place of birth for the foreign-born population - Bosnia and Herzegovina (%)
Place of birth for the foreign-born population - Bulgaria (%)
Place of birth for the foreign-born population - Croatia (%)
Place of birth for the foreign-born population - Czechoslovakia (%)
Place of birth for the foreign-born population - Hungary (%)
Place of birth for the foreign-born population - Latvia (%)
Place of birth for the foreign-born population - Lithuania (%)
Place of birth for the foreign-born population - North Macedonia (Macedonia) (%)
Place of birth for the foreign-born population - Moldova (%)
Place of birth for the foreign-born population - Poland (%)
Place of birth for the foreign-born population - Romania (%)
Place of birth for the foreign-born population - Russia (%)
Place of birth for the foreign-born population - Serbia (%)
Place of birth for the foreign-born population - Ukraine (%)
Place of birth for the foreign-born population - Other Eastern Europe (%)
Place of birth for the foreign-born population - China (%)
Place of birth for the foreign-born population - Hong Kong (%)
Place of birth for the foreign-born population - Taiwan (%)
Place of birth for the foreign-born population - Japan (%)
Place of birth for the foreign-born population - Korea (%)
Place of birth for the foreign-born population - Other Eastern Asia (%)
Place of birth for the foreign-born population - Afghanistan (%)
Place of birth for the foreign-born population - Bangladesh (%)
Place of birth for the foreign-born population - India (%)
Place of birth for the foreign-born population - Iran (%)
Place of birth for the foreign-born population - Kazakhstan (%)
Place of birth for the foreign-born population - Nepal (%)
Place of birth for the foreign-born population - Pakistan (%)
Place of birth for the foreign-born population - Sri Lanka (%)
Place of birth for the foreign-born population - Uzbekistan (%)
Place of birth for the foreign-born population - Other South Central Asia (%)
Place of birth for the foreign-born population - Burma (%)
Place of birth for the foreign-born population - Cambodia (%)
Place of birth for the foreign-born population - Indonesia (%)
Place of birth for the foreign-born population - Laos (%)
Place of birth for the foreign-born population - Malaysia (%)
Place of birth for the foreign-born population - Philippines (%)
Place of birth for the foreign-born population - Singapore (%)
Place of birth for the foreign-born population - Thailand (%)
Place of birth for the foreign-born population - Vietnam (%)
Place of birth for the foreign-born population - Other South Eastern Asia (%)
Place of birth for the foreign-born population - Armenia (%)
Place of birth for the foreign-born population - Iraq (%)
Place of birth for the foreign-born population - Israel (%)
Place of birth for the foreign-born population - Jordan (%)
Place of birth for the foreign-born population - Kuwait (%)
Place of birth for the foreign-born population - Lebanon (%)
Place of birth for the foreign-born population - Saudi Arabia (%)
Place of birth for the foreign-born population - Syria (%)
Place of birth for the foreign-born population - Turkey (%)
Place of birth for the foreign-born population - Yemen (%)
Place of birth for the foreign-born population - Other Western Asia (%)
Place of birth for the foreign-born population - Eritrea (%)
Place of birth for the foreign-born population - Ethiopia (%)
Place of birth for the foreign-born population - Kenya (%)
Place of birth for the foreign-born population - Somalia (%)
Place of birth for the foreign-born population - Uganda (%)
Place of birth for the foreign-born population - Zimbabwe (%)
Place of birth for the foreign-born population - Other Eastern Africa (%)
Place of birth for the foreign-born population - Cameroon (%)
Place of birth for the foreign-born population - Congo (%)
Place of birth for the foreign-born population - Democratic Republic of Congo (Zaire) (%)
Place of birth for the foreign-born population - Other Middle Africa (%)
Place of birth for the foreign-born population - Egypt (%)
Place of birth for the foreign-born population - Morocco (%)
Place of birth for the foreign-born population - Sudan (%)
Place of birth for the foreign-born population - Other Northern Africa (%)
Place of birth for the foreign-born population - South Africa (%)
Place of birth for the foreign-born population - Other Southern Africa (%)
Place of birth for the foreign-born population - Cabo Verde (%)
Place of birth for the foreign-born population - Ghana (%)
Place of birth for the foreign-born population - Liberia (%)
Place of birth for the foreign-born population - Nigeria (%)
Place of birth for the foreign-born population - Senegal (%)
Place of birth for the foreign-born population - Sierra Leone (%)
Place of birth for the foreign-born population - Other Western Africa (%)
Place of birth for the foreign-born population - Australia (%)
Place of birth for the foreign-born population - New Zealand (%)
Place of birth for the foreign-born population - Fiji (%)
Place of birth for the foreign-born population - Micronesia (%)
Place of birth for the foreign-born population - Bahamas (%)
Place of birth for the foreign-born population - Barbados (%)
Place of birth for the foreign-born population - Cuba (%)
Place of birth for the foreign-born population - Dominica (%)
Place of birth for the foreign-born population - Dominican Republic (%)
Place of birth for the foreign-born population - Grenada (%)
Place of birth for the foreign-born population - Haiti (%)
Place of birth for the foreign-born population - Jamaica (%)
Place of birth for the foreign-born population - St. Vincent and the Grenadines (%)
Place of birth for the foreign-born population - Trinidad and Tobago (%)
Place of birth for the foreign-born population - West Indies (%)
Place of birth for the foreign-born population - Other Caribbean (%)
Place of birth for the foreign-born population - Belize (%)
Place of birth for the foreign-born population - Costa Rica (%)
Place of birth for the foreign-born population - El Salvador (%)
Place of birth for the foreign-born population - Guatemala (%)
Place of birth for the foreign-born population - Honduras (%)
Place of birth for the foreign-born population - Mexico (%)
Place of birth for the foreign-born population - Nicaragua (%)
Place of birth for the foreign-born population - Panama (%)
Place of birth for the foreign-born population - Other Central America (%)
Place of birth for the foreign-born population - Argentina (%)
Place of birth for the foreign-born population - Bolivia (%)
Place of birth for the foreign-born population - Brazil (%)
Place of birth for the foreign-born population - Chile (%)
Place of birth for the foreign-born population - Colombia (%)
Place of birth for the foreign-born population - Ecuador (%)
Place of birth for the foreign-born population - Guyana (%)
Place of birth for the foreign-born population - Peru (%)
Place of birth for the foreign-born population - Uruguay (%)
Place of birth for the foreign-born population - Venezuela (%)
Place of birth for the foreign-born population - Other South America (%)
Place of birth for the foreign-born population - Canada (%)
Place of birth for the foreign-born population - Other Northern America (%)
Place of birth for the foreign-born population - Other (%)
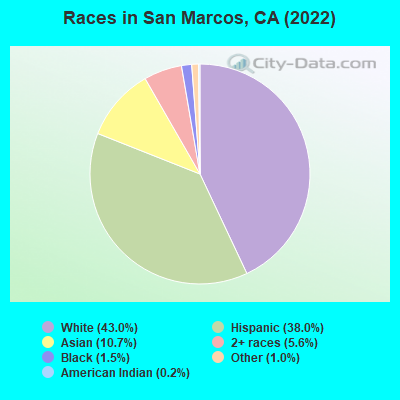
According to 2022 data, the most numerous races in San Marcos, CA are Hispanic (39,568 residents), White alone (39,014 residents), and Asian alone (9,630 residents). 63.5% of San Marcos residents speak English at home. 24.1% of San Marcos, CA residents are foreign-born (15.4% born in Latin America, 6.6% born in Asia), which is 8.1% less than the foreign-born rate of 26.0% across the entire state of California.
Race distribution in San Marcos
2000 2022
29,617 53.9% White alone 20,271 36.9% Hispanic 2,503 4.6% Asian alone 1,212 2.2% Two or more races 1,001 1.8% Black alone 214 0.4% American Indian alone 119 0.2% Native Hawaiian and Other 40 0.07% Other race alone
39,568 41.1% Hispanic 39,014 40.6% White alone 9,630 10.0% Asian alone 4,624 4.8% Two or more races 2,180 2.3% Black alone 410 0.4% Native Hawaiian and Other 254 0.3% Other race alone 329 0.3% American Indian alone
2000 2022
15,816,790 46.7% White alone 10,966,556 32.4% Hispanic 3,648,860 10.8% Asian alone 2,181,926 6.4% Black alone 903,115 2.7% Two or more races 178,984 0.5% American Indian alone 103,736 0.3% Native Hawaiian and Other 71,681 0.2% Other race alone
15,732,184 40.3% Hispanic 13,160,426 33.7% White alone 5,957,867 15.3% Asian alone 2,025,218 5.2% Black alone 1,663,222 4.3% Two or more races 251,618 0.6% Other race alone 135,777 0.3% Native Hawaiian and Other 103,030 0.3% American Indian alone
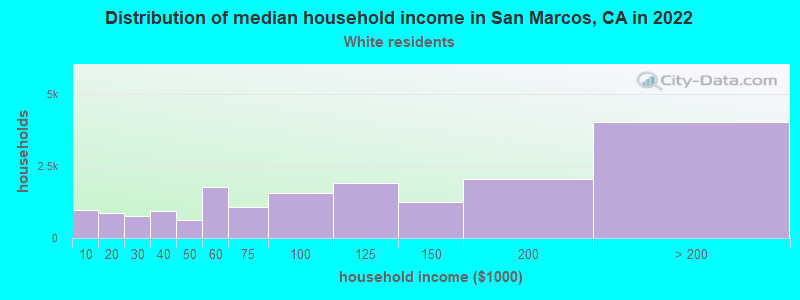
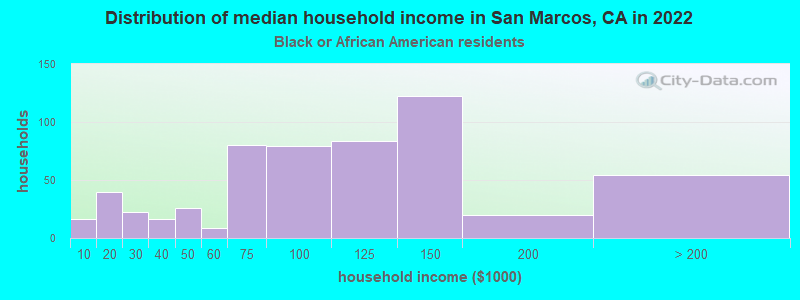
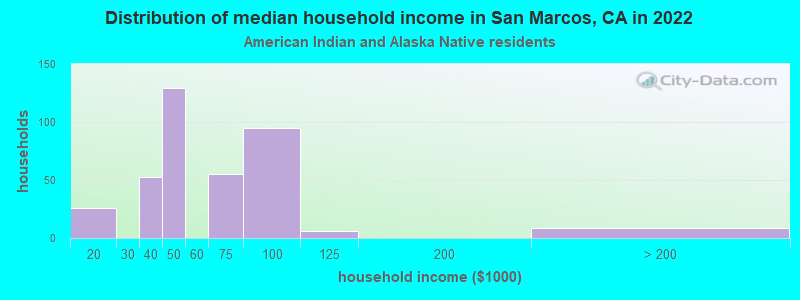
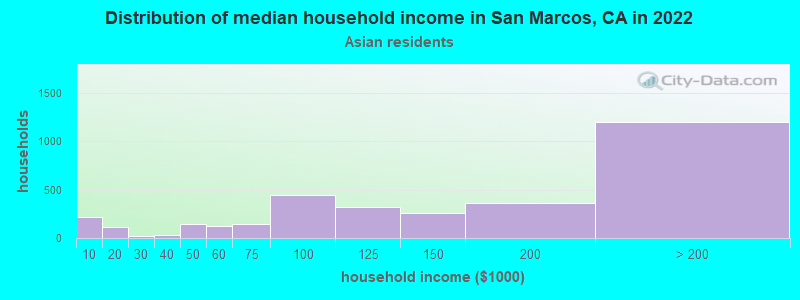
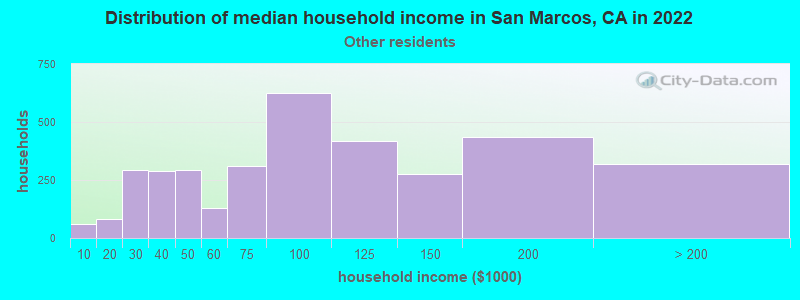
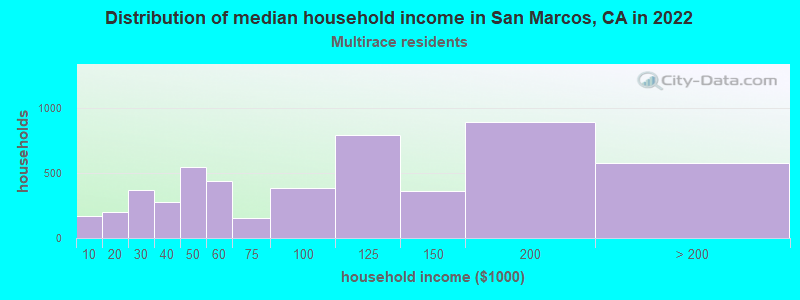
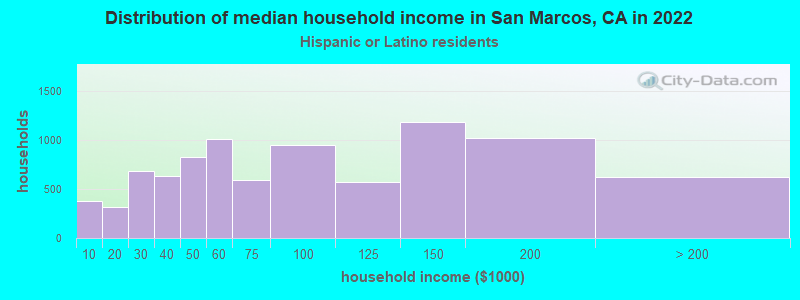
Income and house value in San Marcos Median household income in 2022 $107,322 White non-Hispanic householders$127,053 Black householdersover $200,000 American Indian and Alaska Native householders$172,841 Asian householders$114,257 Native Hawaiian and other Pacific Islander householders$128,984 Some other race householders$116,332 Two or more races householders$82,940 Hispanic or Latino race householdersMedian 2022 house value $757,651 White Non-Hispanic householders$905,222 Black or African American householders$698,263 American Indian or Alaska Native householders $827,838 Asian householdersover $1,000,000 Native Hawaiian and other Pacific Islander householders$613,679 Some other race householders$771,689 Two or more races householders$643,554 Hispanic or Latino householders
Median age by race in San Marcos
39.7 Median age for White residents39.3 39.8 39.4 Median age for Black or African American residents48.2 30.6 29.7 Median age for American Indian / Alaska Native residents39.8 Median age for Asian residents40.4 38.3 48.1 Median age for Native Hawaiian / Pacific Islander residents41.1 54.7 40.4 Median age for Other race residents34.8 43.4 25.0 Median age for Two or more races residents24.1 25.2 45.5 Median age for White alone residents44.5 48.1 28.2 Median age for Hispanic or Latino residents28.8 27.6
Owner/renter occupied households by race in San Marcos
House owners and renters - White residents 14,496 66.5% Owner occupied7,299 33.5% Renter occupiedHouse owners and renters - Black or African American residents 377 58.6% Owner occupied266 41.4% Renter occupiedHouse owners and renters - American Indian / Alaska Native residents 82 26.4% Owner occupied229 73.6% Renter occupiedHouse owners and renters - Asian residents 2,480 76.3% Owner occupied772 23.7% Renter occupiedHouse owners and renters - Native Hawaiian / Pacific Islander residents 82 39.7% Owner occupied124 60.3% Renter occupiedHouse owners and renters - Other race residents 469 32.6% Owner occupied970 67.4% Renter occupiedHouse owners and renters - Two or more races residents 2,590 71.6% Owner occupied1,028 28.4% Renter occupiedHouse owners and renters - White alone residents 13,218 76.3% Owner occupied4,107 23.7% Renter occupiedHouse owners and renters - Hispanic or Latino residents 3,520 38.1% Owner occupied5,717 61.9% Renter occupied
Language usage in San Marcos
English speakers - Total 63.5% of residents of San Marcos speak English at home.
26.9% of residents speak Spanish at home 14,689 60.9% Speak English very well9,449 39.1% Speak English less than very well9.6% of residents speak other language at home 5,390 62.8% Speak English very well3,187 37.2% Speak English less than very well
English speakers - Born in the United States 91.5% of residents of San Marcos speak English at home.
5.2% of residents speak Spanish at home 777 76.9% Speak English very well233 23.1% Speak English less than very well3.2% of residents speak other language at home 540 88.4% Speak English very well71 11.6% Speak English less than very well
English speakers - Native, born elsewhere 57.6% of residents of San Marcos speak English at home.
25.5% of residents speak Spanish at home 316 88.5% Speak English very well41 11.5% Speak English less than very well17.0% of residents speak other language at home 149 62.3% Speak English very well90 37.7% Speak English less than very well
English speakers - Foreign-born 18.0% of residents of San Marcos speak English at home.
54.8% of residents speak Spanish at home 4,102 33.1% Speak English very well8,276 66.9% Speak English less than very well27.3% of residents speak other language at home 3,415 55.5% Speak English very well2,742 44.5% Speak English less than very well
White (Caucasian) - Speak only English Native:
90.1% (44,571)Foreign-born:
33.4% (2,835)
White (Caucasian) - Speak another language Native:
11.5% (5,688)Foreign-born:
71.3% (6,059)
Black or African American - Speak only English Native:
92.9% (2,057)Foreign-born:
36.4% (65)
Black or African American - Speak another language Native:
7.2% (159)Foreign-born:
58.3% (103)
American Indian / Alaska Native - Speak another language Native:
17.5% (140)Foreign-born:
100.0% (200)
Asian - Speak only English Native:
74.7% (2,347)Foreign-born:
23.6% (1,304)
Asian - Speak another language Native:
26.4% (830)Foreign-born:
77.7% (4,294)
Native Hawaiian / Pacific Islander - Speak another language Native:
38.6% (111)Foreign-born:
96.4% (162)
Other race - Speak only English Native:
59.2% (2,141)Foreign-born:
19.9% (507)
Other race - Speak another language Native:
44.5% (1,611)Foreign-born:
84.4% (2,147)
Two or more races - Speak only English Native:
68.6% (7,634)Foreign-born:
19.0% (748)
Two or more races - Speak another language Native:
23.2% (2,580)Foreign-born:
73.4% (2,893)
White alone - Speak only English Native:
95.4% (37,131)Foreign-born:
26.2% (707)
White alone - Speak another language Native:
4.6% (1,800)Foreign-born:
73.9% (1,997)
Hispanic or Latino - Speak only English Native:
61.2% (13,437)Foreign-born:
28.4% (3,539)
Hispanic or Latino - Speak another language Native:
40.4% (8,874)Foreign-born:
77.6% (9,650)
Foreign-born residents in San Marcos 23,136 residents are foreign born (15.4% Latin America , 6.6% Asia ).
This city:
24.1%California:
100.0%
Marital status for residents in San Marcos Marital status - White (Caucasian) population 15 years and over
Males 35.0% Never married51.8% Now married2.2% Separated4.2% Widowed6.8% DivorcedFemales 32.2% Never married45.2% Now married2.5% Separated7.9% Widowed12.1% DivorcedWomen who gave birth in the past 12 months Now married:
82.5% (423)Unmarried:
17.5% (90)
Women who did not give birth in the past 12 months Now married:
46.2% (6,276)Unmarried:
53.8% (7,316)
Marital status - Black or African American population 15 years and over
Males 32.7% Never married61.6% Now married0.0% Separated0.0% Widowed5.7% DivorcedFemales 41.4% Never married44.8% Now married0.0% Separated7.3% Widowed6.6% DivorcedWomen who did not give birth in the past 12 months Now married:
35.1% (189)Unmarried:
64.9% (348)
Marital status - American Indian / Alaska Native population 15 years and over
Males 35.3% Never married53.0% Now married0.0% Separated0.0% Widowed11.7% DivorcedFemales 45.0% Never married28.5% Now married0.0% Separated8.9% Widowed17.6% DivorcedWomen who gave birth in the past 12 months Now married:
50.0% (34)Unmarried:
50.0% (34)
Women who did not give birth in the past 12 months Now married:
21.2% (53)Unmarried:
78.8% (198)
Marital status - Asian population 15 years and over
Males 31.4% Never married63.5% Now married0.6% Separated2.7% Widowed1.9% DivorcedFemales 25.6% Never married57.2% Now married2.2% Separated8.6% Widowed6.4% DivorcedWomen who gave birth in the past 12 months Now married:
100.0% (175)Unmarried:
0.0% (0)
Women who did not give birth in the past 12 months Now married:
57.4% (1,498)Unmarried:
42.6% (1,114)
Marital status - Native Hawaiian / Pacific Islander population 15 years and over
Males 39.4% Never married26.5% Now married0.0% Separated24.1% Widowed10.0% DivorcedFemales 0.0% Never married79.3% Now married20.7% Separated0.0% Widowed0.0% DivorcedWomen who did not give birth in the past 12 months Now married:
100.0% (74)Unmarried:
0.0% (0)
Marital status - Other race population 15 years and over
Males 41.1% Never married48.2% Now married2.2% Separated1.0% Widowed7.6% DivorcedFemales 38.1% Never married50.6% Now married0.3% Separated3.5% Widowed7.5% DivorcedWomen who gave birth in the past 12 months Now married:
75.9% (62)Unmarried:
24.1% (20)
Women who did not give birth in the past 12 months Now married:
47.3% (760)Unmarried:
52.7% (847)
Marital status - Two or more races population 15 years and over
Males 50.9% Never married40.3% Now married3.6% Separated1.7% Widowed3.5% DivorcedFemales 27.6% Never married42.2% Now married0.0% Separated8.9% Widowed21.3% DivorcedWomen who gave birth in the past 12 months Now married:
0.0% (0)Unmarried:
100.0% (60)
Women who did not give birth in the past 12 months Now married:
41.9% (1,406)Unmarried:
58.1% (1,947)
Marital status - White alone, not Hispanic / Latino population 15 years and over
Males 28.4% Never married56.9% Now married0.0% Separated5.1% Widowed9.6% DivorcedFemales 20.7% Never married49.6% Now married3.5% Separated11.6% Widowed14.6% DivorcedWomen who gave birth in the past 12 months Now married:
100.0% (423)Unmarried:
0.0% (0)
Women who did not give birth in the past 12 months Now married:
57.5% (4,527)Unmarried:
42.5% (3,345)
Marital status - Hispanic or Latino population 15 years and over
Males 46.9% Never married41.5% Now married5.2% Separated2.3% Widowed4.1% DivorcedFemales 48.4% Never married40.1% Now married1.2% Separated2.5% Widowed7.9% DivorcedWomen who gave birth in the past 12 months Now married:
43.1% (88)Unmarried:
56.9% (116)
Women who did not give birth in the past 12 months Now married:
37.1% (4,054)Unmarried:
62.9% (6,875)
Ancestries in San Marcos
2,253 4.0% American1,651 2.9% German1,552 2.7% European1,529 2.7% English1,418 2.5% Irish888 1.6% Italian604 1.1% Polish589 1.0% Iranian304 0.5% Russian293 0.5% Scottish256 0.5% Dutch251 0.4% Swedish242 0.4% Norwegian232 0.4% Romanian179 0.3% Egyptian170 0.3% Portuguese167 0.3% Eastern European134 0.2% Hungarian128 0.2% Brazilian127 0.2% Lebanese121 0.2% British112 0.2% Greek91 0.2% Serbian84 0.1% French75 0.1% Scotch-Irish71 0.1% French Canadian63 0.1% Lithuanian58 0.1% African57 0.1% Scandinavian48 0.08% Canadian45 0.08% Czech35 0.06% Syrian34 0.06% Yugoslavian33 0.06% Austrian33 0.06% Northern European33 0.06% Welsh32 0.06% Ukrainian26 0.05% Jamaican25 0.04% Palestinian25 0.04% Slavic23 0.04% Slovak23 0.04% Slovene22 0.04% Croatian21 0.04% Maltese20 0.04% West Indian18 0.03% Armenian18 0.03% Danish16 0.03% Czechoslovakian16 0.03% Finnish13 0.02% Latvian11 0.02% Ethiopian11 0.02% Turkish10 0.02% Bulgarian10 0.02% Israeli7 0.01% Guyanese7 0.01% Swiss
Geographical mobility in San Marcos Same house 1 year ago 55,417 93.0% White (Caucasian)2,233 90.8% Black or African American662 65.5% American Indian / Alaska Native8,668 87.4% Asian410 89.5% Native Hawaiian / Pacific Islander4,939 83.8% Other race13,982 89.0% Two or more races34,650 88.7% White alone, not Hispanic / Latino33,810 88.1% Hispanic or LatinoMoved within same county 3,499 5.9% White / Caucasian123 5.0% Black or African American276 27.3% American Indian / Alaska Native977 9.9% Asian44 9.5% Native Hawaiian / Pacific Islander722 12.3% Other race1,378 8.8% Two or more races3,243 8.3% White alone, not Hispanic / Latino3,340 8.7% Hispanic or LatinoMoved within same state 288 0.5% White / Caucasian40 1.6% Black or African American21 2.1% American Indian / Alaska Native119 1.2% Asian24 0.4% Other race308 2.0% Two or more races672 1.7% White alone, not Hispanic / Latino416 1.1% Hispanic or LatinoMoved from different state 387 0.6% White / Caucasian96 3.9% Black or African American172 1.7% Asian26 0.4% Other race45 0.3% Two or more races405 1.0% White alone, not Hispanic / Latino106 0.3% Hispanic or LatinoMoved from abroad 62 0.1% White32 0.3% Asian103 0.3% White alone, not Hispanic / Latino490 1.3% Hispanic or Latino
Children Nativity (place of birth) in San Marcos
Children under 6 years - Living with two parents Both parents native 2,664 100.0% NativeBoth parents foreign-born 856 100.0% NativeOne native, one foreign-born parent 487 100.0% NativeChildren under 6 years - Living with one parent Native parent 830 99.8% Native2 0.2% Foreign-bornForeign-born parent 975 88.2% Native131 11.8% Foreign-bornChildren 6 to 17 years - Living with two parents Both parents native 7,657 100.0% NativeBoth parents foreign-born 2,410 80.9% Native568 19.1% Foreign-bornOne native, one foreign-born parent 1,949 100.0% NativeChildren 6 to 17 years - Living with one parent Native parent 3,359 100.0% NativeForeign-born parent 2,561 50.0% Native2,559 50.0% Foreign-born
Place of birth for residents in San Marcos 15,211 Americas14,922 Latin America14,276 Central America6,407 Asia3,379 South Eastern Asia1,465 Eastern Asia1,299 South Central Asia1,284 Europe823 China704 Eastern Europe484 South America324 Northern Europe288 Northern America238 Western Asia198 Western Europe162 Caribbean131 Africa102 Oceania88 Northern Africa56 Southern Europe26 Eastern Africa19 Australia and New Zealand Subregion17 Western Africa13,616 Mexico2,005 Philippines1,096 Vietnam578 India544 Iran497 China326 Korea316 Japan288 Canada207 Colombia203 El Salvador193 Taiwan172 Brazil164 Honduras132 Hong Kong123 Poland119 Russia112 Sweden106 Panama102 Nicaragua99 Laos89 England88 Romania80 Germany79 United Kingdom75 Ukraine72 Hungary71 Cuba71 Lithuania71 Thailand69 Egypt60 Pakistan57 Venezuela56 Lebanon53 Bangladesh48 Jamaica46 Austria45 Costa Rica42 Iraq41 Malaysia41 Trinidad and Tobago37 Guatemala36 Serbia35 France35 Indonesia35 Afghanistan35 Syria35 Turkey33 Italy29 Burma27 Norway26 Kazakhstan26 Ethiopia25 Netherlands23 Ecuador19 Australia18 Sudan17 Moldova17 Ghana16 Ireland15 Argentina14 Portugal12 Saudi Arabia11 Switzerland10 Croatia9 Spain8 Latvia8 Peru5 Belarus
Grandparents responsible for own grandchildren in San Marcos
Grandparents (30 to 59 years) White / Caucasian 133 35.1% Responsible for grandchildren247 64.9% Not responsible for grandchildrenBlack or African American 20 100.0% Not responsible for grandchildrenAmerican Indian / Alaska Native 94 100.0% Not responsible for grandchildrenAsian 72 100.0% Not responsible for grandchildrenNative Hawaiian / Pacific Islander 27 100.0% Not responsible for grandchildrenOther race 92 42.5% Responsible for grandchildren125 57.5% Not responsible for grandchildrenWhite alone, not Hispanic / Latino 33 23.2% Responsible for grandchildren108 76.8% Not responsible for grandchildrenHispanic or Latino 210 35.5% Responsible for grandchildren381 64.5% Not responsible for grandchildrenGrandparents (60 years and over) White / Caucasian 47 6.3% Responsible for grandchildren707 93.7% Not responsible for grandchildrenBlack or African American 79 100.0% Not responsible for grandchildrenAmerican Indian / Alaska Native 7 5.6% Responsible for grandchildren112 94.4% Not responsible for grandchildrenAsian 189 100.0% Not responsible for grandchildrenOther race 94 100.0% Not responsible for grandchildrenWhite alone, not Hispanic / Latino 47 9.0% Responsible for grandchildren473 91.0% Not responsible for grandchildrenHispanic or Latino 27 4.0% Responsible for grandchildren649 96.0% Not responsible for grandchildren