Races in Sandusky, Ohio (OH) Detailed Stats
Data:
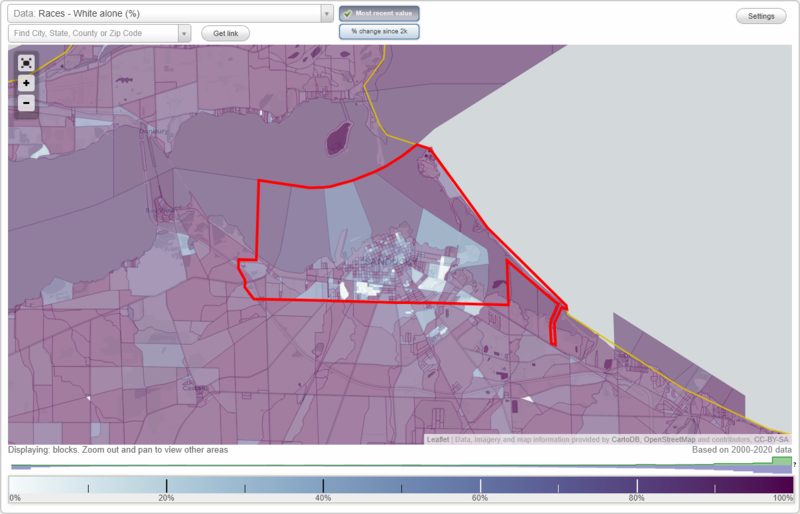
Races - White alone (%)
Races - White alone (% change since 2000)
Races - Black alone (%)
Races - Black alone (% change since 2000)
Races - American Indian alone (%)
Races - American Indian alone (% change since 2000)
Races - Asian alone (%)
Races - Asian alone (% change since 2000)
Races - Hispanic (%)
Races - Hispanic (% change since 2000)
Races - Native Hawaiian and Other Pacific Islander alone (%)
Races - Native Hawaiian and Other Pacific Islander alone (% change since 2000)
Races - Two or more races(%)
Races - Two or more races(% change since 2000)
Races - Other race alone (%)
Races - Other race alone (% change since 2000)
Racial diversity
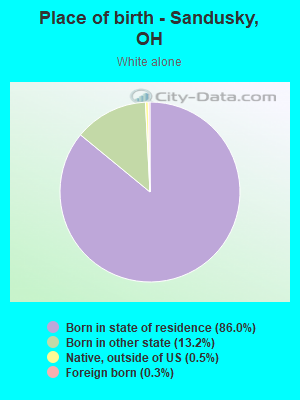
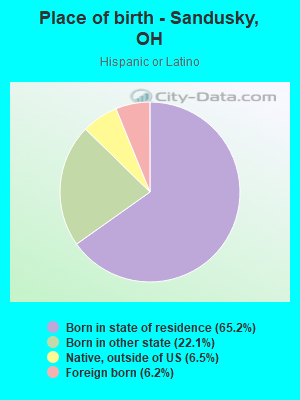
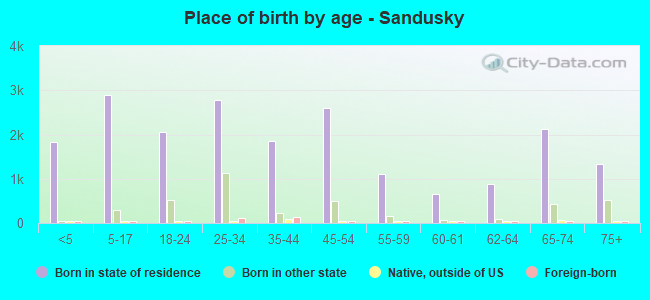
Place of birth - Born in state of residence (%)
Place of birth - Born in state of residence (%) - White
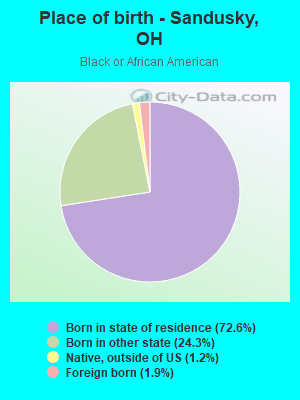
Place of birth - Born in state of residence (%) - Black or African American
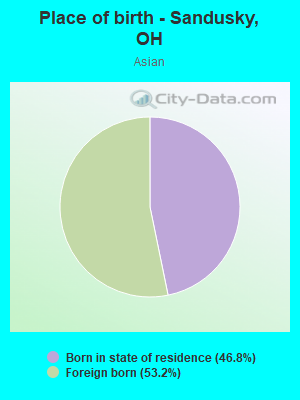
Place of birth - Born in state of residence (%) - Asian
Place of birth - Born in state of residence (%) - Hispanic or Latino
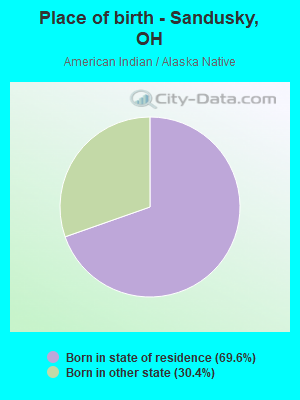
Place of birth - Born in state of residence (%) - American Indian and Alaska Native
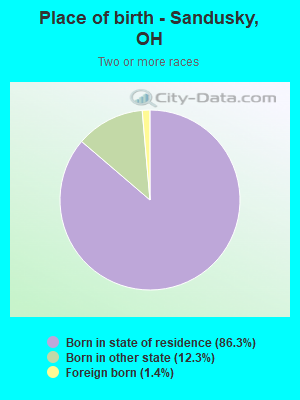
Place of birth - Born in state of residence (%) - Multirace
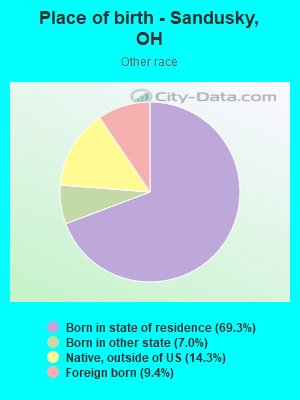
Place of birth - Born in state of residence (%) - Other Race
Place of birth - Born in other state (%)
Place of birth - Born in other state (%) - White
Place of birth - Born in other state (%) - Black or African American
Place of birth - Born in other state (%) - Asian
Place of birth - Born in other state (%) - Hispanic or Latino
Place of birth - Born in other state (%) - American Indian and Alaska Native
Place of birth - Born in other state (%) - Multirace
Place of birth - Born in other state (%) - Other Race
Place of birth - Native, outside of US (%)
Place of birth - Native, outside of US (%) - White
Place of birth - Native, outside of US (%) - Black or African American
Place of birth - Native, outside of US (%) - Asian
Place of birth - Native, outside of US (%) - Hispanic or Latino
Place of birth - Native, outside of US (%) - American Indian and Alaska Native
Place of birth - Native, outside of US (%) - Multirace
Place of birth - Native, outside of US (%) - Other Race
Place of birth - Foreign born (%)
Place of birth - Foreign born (%) - White
Place of birth - Foreign born (%) - Black or African American
Place of birth - Foreign born (%) - Asian
Place of birth - Foreign born (%) - Hispanic or Latino
Place of birth - Foreign born (%) - American Indian and Alaska Native
Place of birth - Foreign born (%) - Multirace
Place of birth - Foreign born (%) - Other Race
Residents speaking English at home (%)
Residents speaking English at home - Born in the United States (%)
Residents speaking English at home - Native, born elsewhere (%)
Residents speaking English at home - Foreign born (%)
Residents speaking Spanish at home (%)
Residents speaking Spanish at home - Born in the United States (%)
Residents speaking Spanish at home - Native, born elsewhere (%)
Residents speaking Spanish at home - Foreign born (%)
Residents speaking other language at home (%)
Residents speaking other language at home - Born in the United States (%)
Residents speaking other language at home - Native, born elsewhere (%)
Residents speaking other language at home - Foreign born (%)
Marital status - Never married (%)
Marital status - Now married (%)
Marital status - Separated (%)
Marital status - Widowed (%)
Marital status - Divorced (%)
Ancestries Reported - Arab (%)
Ancestries Reported - Czech (%)
Ancestries Reported - Danish (%)
Ancestries Reported - Dutch (%)
Ancestries Reported - English (%)
Ancestries Reported - French (%)
Ancestries Reported - French Canadian (%)
Ancestries Reported - German (%)
Ancestries Reported - Greek (%)
Ancestries Reported - Hungarian (%)
Ancestries Reported - Irish (%)
Ancestries Reported - Italian (%)
Ancestries Reported - Lithuanian (%)
Ancestries Reported - Norwegian (%)
Ancestries Reported - Polish (%)
Ancestries Reported - Portuguese (%)
Ancestries Reported - Russian (%)
Ancestries Reported - Scotch-Irish (%)
Ancestries Reported - Scottish (%)
Ancestries Reported - Slovak (%)
Ancestries Reported - Subsaharan African (%)
Ancestries Reported - Swedish (%)
Ancestries Reported - Swiss (%)
Ancestries Reported - Ukrainian (%)
Ancestries Reported - United States (%)
Ancestries Reported - Welsh (%)
Ancestries Reported - West Indian (%)
Ancestries Reported - Other (%)
Geographical mobility - Same house 1 year ago (%)
Geographical mobility - Same house 1 year ago (%) - White
Geographical mobility - Same house 1 year ago (%) - Black or African American
Geographical mobility - Same house 1 year ago (%) - Asian
Geographical mobility - Same house 1 year ago (%) - Hispanic or Latino
Geographical mobility - Same house 1 year ago (%) - American Indian and Alaska Native
Geographical mobility - Same house 1 year ago (%) - Multirace
Geographical mobility - Same house 1 year ago (%) - Other Race
Geographical mobility - Moved within same county (%)
Geographical mobility - Moved within same county (%) - White
Geographical mobility - Moved within same county (%) - Black or African American
Geographical mobility - Moved within same county (%) - Asian
Geographical mobility - Moved within same county (%) - Hispanic or Latino
Geographical mobility - Moved within same county (%) - American Indian and Alaska Native
Geographical mobility - Moved within same county (%) - Multirace
Geographical mobility - Moved within same county (%) - Other Race
Geographical mobility - Moved from different county within same state (%)
Geographical mobility - Moved from different county within same state (%) - White
Geographical mobility - Moved from different county within same state (%) - Black or African American
Geographical mobility - Moved from different county within same state (%) - Asian
Geographical mobility - Moved from different county within same state (%) - Hispanic or Latino
Geographical mobility - Moved from different county within same state (%) - American Indian and Alaska Native
Geographical mobility - Moved from different county within same state (%) - Multirace
Geographical mobility - Moved from different county within same state (%) - Other Race
Geographical mobility - Moved from different state (%)
Geographical mobility - Moved from different state (%) - White
Geographical mobility - Moved from different state (%) - Black or African American
Geographical mobility - Moved from different state (%) - Asian
Geographical mobility - Moved from different state (%) - Hispanic or Latino
Geographical mobility - Moved from different state (%) - American Indian and Alaska Native
Geographical mobility - Moved from different state (%) - Multirace
Geographical mobility - Moved from different state (%) - Other Race
Geographical mobility - Moved from abroad (%)
Geographical mobility - Moved from abroad (%) - White
Geographical mobility - Moved from abroad (%) - Black or African American
Geographical mobility - Moved from abroad (%) - Asian
Geographical mobility - Moved from abroad (%) - Hispanic or Latino
Geographical mobility - Moved from abroad (%) - American Indian and Alaska Native
Geographical mobility - Moved from abroad (%) - Multirace
Geographical mobility - Moved from abroad (%) - Other Race
Place of birth for the foreign-born population - Ireland (%)
Place of birth for the foreign-born population - Denmark (%)
Place of birth for the foreign-born population - Norway (%)
Place of birth for the foreign-born population - Sweden (%)
Place of birth for the foreign-born population - United Kingdom (%)
Place of birth for the foreign-born population - England (%)
Place of birth for the foreign-born population - Scotland (%)
Place of birth for the foreign-born population - Other Northern Europe (%)
Place of birth for the foreign-born population - Austria (%)
Place of birth for the foreign-born population - Belgium (%)
Place of birth for the foreign-born population - France (%)
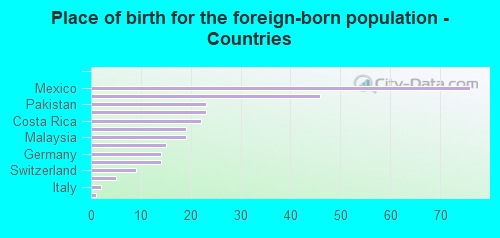
Place of birth for the foreign-born population - Germany (%)
Place of birth for the foreign-born population - Netherlands (%)
Place of birth for the foreign-born population - Switzerland (%)
Place of birth for the foreign-born population - Other Western Europe (%)
Place of birth for the foreign-born population - Greece (%)
Place of birth for the foreign-born population - Italy (%)
Place of birth for the foreign-born population - Portugal (%)
Place of birth for the foreign-born population - Spain (%)
Place of birth for the foreign-born population - Other Southern Europe (%)
Place of birth for the foreign-born population - Albania (%)
Place of birth for the foreign-born population - Belarus (%)
Place of birth for the foreign-born population - Bosnia and Herzegovina (%)
Place of birth for the foreign-born population - Bulgaria (%)
Place of birth for the foreign-born population - Croatia (%)
Place of birth for the foreign-born population - Czechoslovakia (%)
Place of birth for the foreign-born population - Hungary (%)
Place of birth for the foreign-born population - Latvia (%)
Place of birth for the foreign-born population - Lithuania (%)
Place of birth for the foreign-born population - North Macedonia (Macedonia) (%)
Place of birth for the foreign-born population - Moldova (%)
Place of birth for the foreign-born population - Poland (%)
Place of birth for the foreign-born population - Romania (%)
Place of birth for the foreign-born population - Russia (%)
Place of birth for the foreign-born population - Serbia (%)
Place of birth for the foreign-born population - Ukraine (%)
Place of birth for the foreign-born population - Other Eastern Europe (%)
Place of birth for the foreign-born population - China (%)
Place of birth for the foreign-born population - Hong Kong (%)
Place of birth for the foreign-born population - Taiwan (%)
Place of birth for the foreign-born population - Japan (%)
Place of birth for the foreign-born population - Korea (%)
Place of birth for the foreign-born population - Other Eastern Asia (%)
Place of birth for the foreign-born population - Afghanistan (%)
Place of birth for the foreign-born population - Bangladesh (%)
Place of birth for the foreign-born population - India (%)
Place of birth for the foreign-born population - Iran (%)
Place of birth for the foreign-born population - Kazakhstan (%)
Place of birth for the foreign-born population - Nepal (%)
Place of birth for the foreign-born population - Pakistan (%)
Place of birth for the foreign-born population - Sri Lanka (%)
Place of birth for the foreign-born population - Uzbekistan (%)
Place of birth for the foreign-born population - Other South Central Asia (%)
Place of birth for the foreign-born population - Burma (%)
Place of birth for the foreign-born population - Cambodia (%)
Place of birth for the foreign-born population - Indonesia (%)
Place of birth for the foreign-born population - Laos (%)
Place of birth for the foreign-born population - Malaysia (%)
Place of birth for the foreign-born population - Philippines (%)
Place of birth for the foreign-born population - Singapore (%)
Place of birth for the foreign-born population - Thailand (%)
Place of birth for the foreign-born population - Vietnam (%)
Place of birth for the foreign-born population - Other South Eastern Asia (%)
Place of birth for the foreign-born population - Armenia (%)
Place of birth for the foreign-born population - Iraq (%)
Place of birth for the foreign-born population - Israel (%)
Place of birth for the foreign-born population - Jordan (%)
Place of birth for the foreign-born population - Kuwait (%)
Place of birth for the foreign-born population - Lebanon (%)
Place of birth for the foreign-born population - Saudi Arabia (%)
Place of birth for the foreign-born population - Syria (%)
Place of birth for the foreign-born population - Turkey (%)
Place of birth for the foreign-born population - Yemen (%)
Place of birth for the foreign-born population - Other Western Asia (%)
Place of birth for the foreign-born population - Eritrea (%)
Place of birth for the foreign-born population - Ethiopia (%)
Place of birth for the foreign-born population - Kenya (%)
Place of birth for the foreign-born population - Somalia (%)
Place of birth for the foreign-born population - Uganda (%)
Place of birth for the foreign-born population - Zimbabwe (%)
Place of birth for the foreign-born population - Other Eastern Africa (%)
Place of birth for the foreign-born population - Cameroon (%)
Place of birth for the foreign-born population - Congo (%)
Place of birth for the foreign-born population - Democratic Republic of Congo (Zaire) (%)
Place of birth for the foreign-born population - Other Middle Africa (%)
Place of birth for the foreign-born population - Egypt (%)
Place of birth for the foreign-born population - Morocco (%)
Place of birth for the foreign-born population - Sudan (%)
Place of birth for the foreign-born population - Other Northern Africa (%)
Place of birth for the foreign-born population - South Africa (%)
Place of birth for the foreign-born population - Other Southern Africa (%)
Place of birth for the foreign-born population - Cabo Verde (%)
Place of birth for the foreign-born population - Ghana (%)
Place of birth for the foreign-born population - Liberia (%)
Place of birth for the foreign-born population - Nigeria (%)
Place of birth for the foreign-born population - Senegal (%)
Place of birth for the foreign-born population - Sierra Leone (%)
Place of birth for the foreign-born population - Other Western Africa (%)
Place of birth for the foreign-born population - Australia (%)
Place of birth for the foreign-born population - New Zealand (%)
Place of birth for the foreign-born population - Fiji (%)
Place of birth for the foreign-born population - Micronesia (%)
Place of birth for the foreign-born population - Bahamas (%)
Place of birth for the foreign-born population - Barbados (%)
Place of birth for the foreign-born population - Cuba (%)
Place of birth for the foreign-born population - Dominica (%)
Place of birth for the foreign-born population - Dominican Republic (%)
Place of birth for the foreign-born population - Grenada (%)
Place of birth for the foreign-born population - Haiti (%)
Place of birth for the foreign-born population - Jamaica (%)
Place of birth for the foreign-born population - St. Vincent and the Grenadines (%)
Place of birth for the foreign-born population - Trinidad and Tobago (%)
Place of birth for the foreign-born population - West Indies (%)
Place of birth for the foreign-born population - Other Caribbean (%)
Place of birth for the foreign-born population - Belize (%)
Place of birth for the foreign-born population - Costa Rica (%)
Place of birth for the foreign-born population - El Salvador (%)
Place of birth for the foreign-born population - Guatemala (%)
Place of birth for the foreign-born population - Honduras (%)
Place of birth for the foreign-born population - Mexico (%)
Place of birth for the foreign-born population - Nicaragua (%)
Place of birth for the foreign-born population - Panama (%)
Place of birth for the foreign-born population - Other Central America (%)
Place of birth for the foreign-born population - Argentina (%)
Place of birth for the foreign-born population - Bolivia (%)
Place of birth for the foreign-born population - Brazil (%)
Place of birth for the foreign-born population - Chile (%)
Place of birth for the foreign-born population - Colombia (%)
Place of birth for the foreign-born population - Ecuador (%)
Place of birth for the foreign-born population - Guyana (%)
Place of birth for the foreign-born population - Peru (%)
Place of birth for the foreign-born population - Uruguay (%)
Place of birth for the foreign-born population - Venezuela (%)
Place of birth for the foreign-born population - Other South America (%)
Place of birth for the foreign-born population - Canada (%)
Place of birth for the foreign-born population - Other Northern America (%)
Place of birth for the foreign-born population - Other (%)
Latest news about races in Sandusky, OH collected exclusively by city-data.com from local newspapers, TV, and radio stations
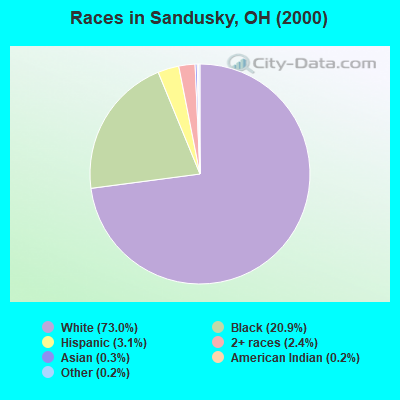
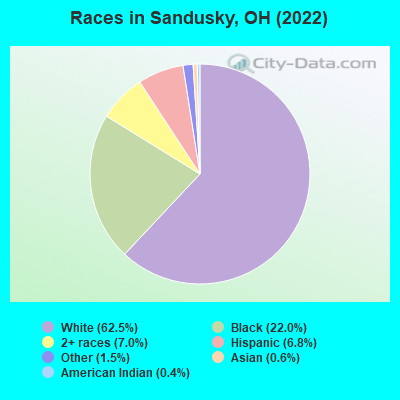
According to 2022 data, the most numerous races in Sandusky, OH are White alone (15,575 residents), Black alone (5,494 residents), and Two or more races (1,746 residents). 95.8% of Sandusky residents speak English at home. 1.3% of Sandusky, OH residents are foreign-born , which is 206.8% less than the foreign-born rate of 4.0% across the entire state of Ohio.
Race distribution in Sandusky
2000 2022
9,538,111 84.0% White alone 1,290,662 11.4% Black alone 217,123 1.9% Hispanic 137,770 1.2% Two or more races 131,670 1.2% Asian alone 21,985 0.2% American Indian alone 13,483 0.1% Other race alone 2,336 0.02% Native Hawaiian and Other
8,948,793 76.1% White alone 1,401,403 11.9% Black alone 529,291 4.5% Two or more races 517,232 4.4% Hispanic 293,387 2.5% Asian alone 52,805 0.4% Other race alone 9,785 0.08% American Indian alone 3,362 0.03% Native Hawaiian and Other
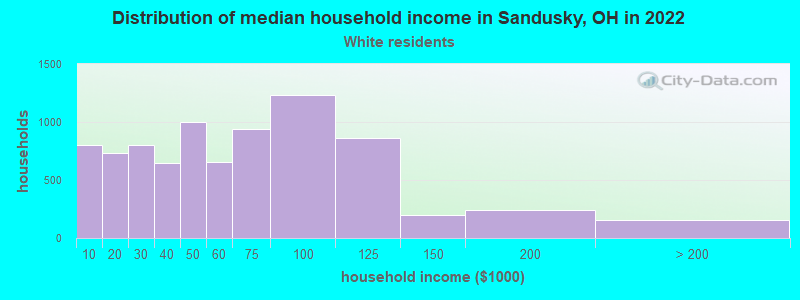
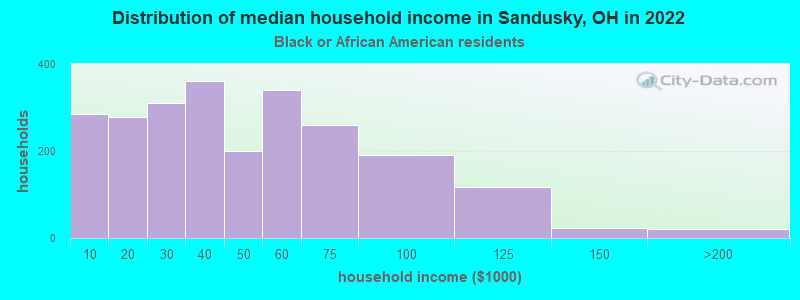
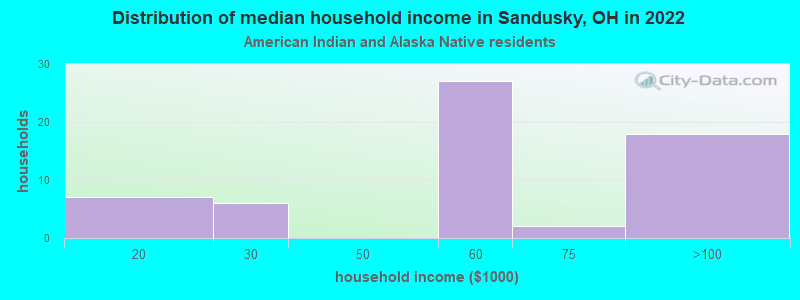
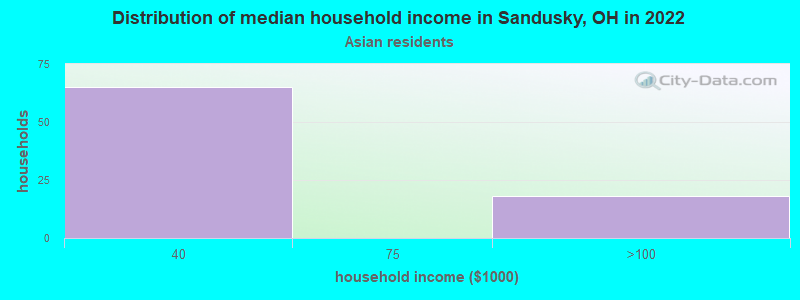
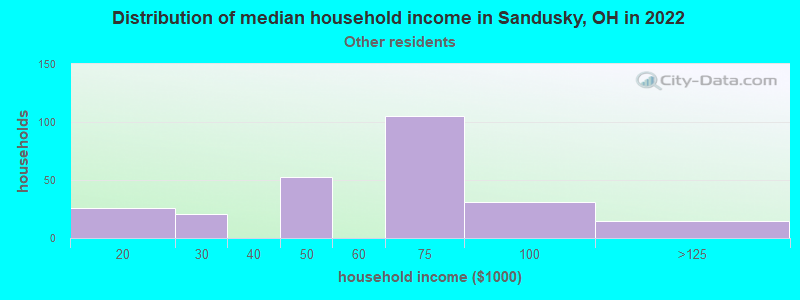
Income and house value in Sandusky Median household income in 2022 $49,143 White non-Hispanic householders$38,156 Black householders$53,903 American Indian and Alaska Native householders$68,265 Some other race householders$50,093 Two or more races householders$53,552 Hispanic or Latino race householdersMedian 2022 house value $103,403 White Non-Hispanic householders$97,689 Black or African American householders$74,831 American Indian or Alaska Native householders $107,485 Asian householders$129,254 Native Hawaiian and other Pacific Islander householders$98,369 Some other race householders$101,635 Two or more races householders$110,887 Hispanic or Latino householders
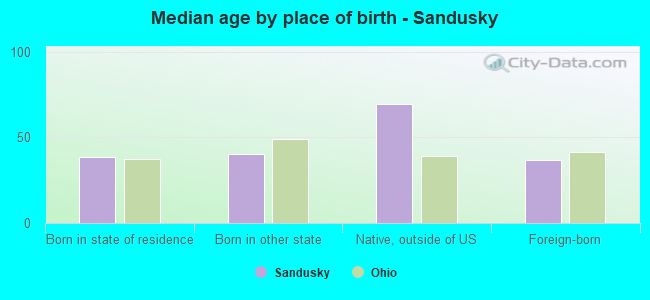
Median age by race in Sandusky
46.1 Median age for White residents44.2 47.8 49.9 Median age for Black or African American residents38.5 50.3 30.3 Median age for American Indian / Alaska Native residents0.0 34.2 40.2 Median age for Asian residents-674,486,802.8 30.2 -666,666,666.0 Median age for Native Hawaiian / Pacific Islander residents-666,666,666.0 -666,666,666.0 27.9 Median age for Other race residents22.7 32.6 18.9 Median age for Two or more races residents14.5 27.3 46.1 Median age for White alone residents44.1 48.9 28.6 Median age for Hispanic or Latino residents24.9 24.0
Owner/renter occupied households by race in Sandusky
House owners and renters - White residents 4,992 60.7% Owner occupied3,231 39.3% Renter occupiedHouse owners and renters - Black or African American residents 506 30.1% Owner occupied1,175 69.9% Renter occupiedHouse owners and renters - American Indian / Alaska Native residents 14 17.1% Owner occupied70 82.9% Renter occupiedHouse owners and renters - Asian residents 21 24.6% Owner occupied64 75.4% Renter occupiedHouse owners and renters - Other race residents 67 25.8% Owner occupied194 74.2% Renter occupiedHouse owners and renters - Two or more races residents 419 64.5% Owner occupied230 35.5% Renter occupiedHouse owners and renters - White alone residents 4,927 60.3% Owner occupied3,238 39.7% Renter occupiedHouse owners and renters - Hispanic or Latino residents 311 49.5% Owner occupied317 50.5% Renter occupied
Language usage in Sandusky
English speakers - Total 95.8% of residents of Sandusky speak English at home.
2.4% of residents speak Spanish at home 427 77.9% Speak English very well121 22.1% Speak English less than very well1.6% of residents speak other language at home 182 48.7% Speak English very well192 51.3% Speak English less than very well
English speakers - Born in the United States 95.3% of residents of Sandusky speak English at home.
4.3% of residents speak Spanish at home 119 67.2% Speak English very well58 32.8% Speak English less than very well0.5% of residents speak other language at home 22 100.0% Speak English very well
English speakers - Native, born elsewhere 67.3% of residents of Sandusky speak English at home.
30.6% of residents speak Spanish at home 75 100.0% Speak English very well
English speakers - Foreign-born 12.4% of residents of Sandusky speak English at home.
30.7% of residents speak Spanish at home 87 87.9% Speak English very well12 12.1% Speak English less than very well56.2% of residents speak other language at home 110 60.8% Speak English very well71 39.2% Speak English less than very well
White (Caucasian) - Speak only English Native:
97.2% (14,890)Foreign-born:
84.8% (32)
White (Caucasian) - Speak another language Native:
2.8% (426)Foreign-born:
21.7% (8)
Black or African American - Speak only English Native:
99.4% (5,150)Foreign-born:
5.6% (6)
Black or African American - Speak another language Native:
0.4% (21)Foreign-born:
92.3% (96)
Other race - Speak another language Native:
19.5% (103)Foreign-born:
100.0% (81)
Two or more races - Speak only English Native:
94.7% (1,763)Foreign-born:
3.7% (1)
Two or more races - Speak another language Native:
4.7% (87)Foreign-born:
99.0% (32)
White alone - Speak only English Native:
98.3% (14,645)Foreign-born:
96.0% (33)
White alone - Speak another language Native:
1.7% (254)Foreign-born:
5.5% (2)
Hispanic or Latino - Speak only English Native:
73.3% (1,028)Foreign-born:
1.0% (1)
Hispanic or Latino - Speak another language Native:
26.2% (367)Foreign-born:
99.5% (104)
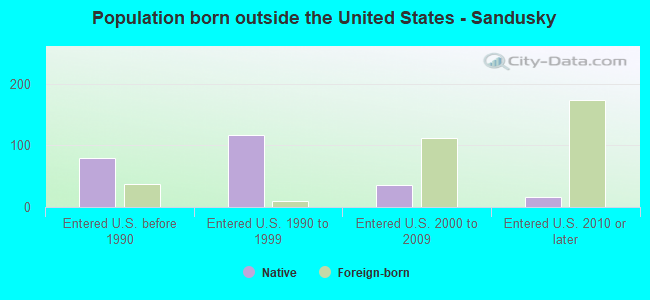
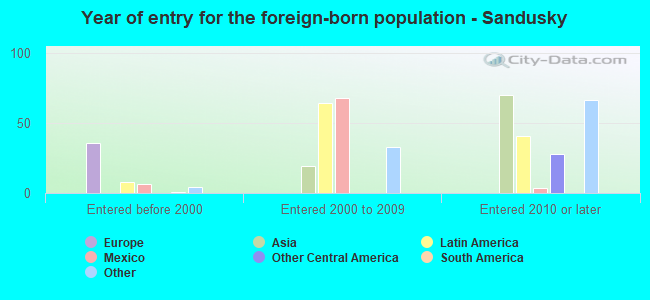
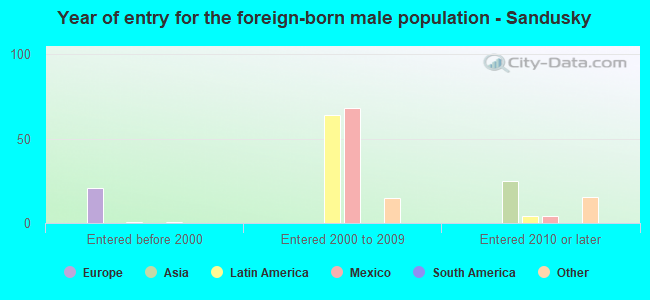
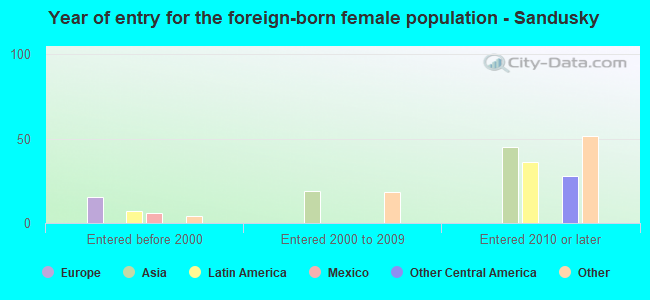
Foreign-born residents in Sandusky 322 residents are foreign born
Marital status for residents in Sandusky Marital status - White (Caucasian) population 15 years and over
Males 42.0% Never married41.7% Now married1.1% Separated3.8% Widowed11.4% DivorcedFemales 36.9% Never married35.6% Now married2.5% Separated8.9% Widowed16.1% DivorcedWomen who gave birth in the past 12 months Now married:
29.5% (105)Unmarried:
70.5% (252)
Women who did not give birth in the past 12 months Now married:
29.0% (939)Unmarried:
71.0% (2,300)
Marital status - Black or African American population 15 years and over
Males 63.1% Never married22.2% Now married0.0% Separated1.8% Widowed12.9% DivorcedFemales 54.3% Never married14.9% Now married0.2% Separated11.6% Widowed19.0% DivorcedWomen who gave birth in the past 12 months Now married:
0.0% (0)Unmarried:
100.0% (68)
Women who did not give birth in the past 12 months Now married:
7.5% (93)Unmarried:
92.5% (1,149)
Marital status - American Indian / Alaska Native population 15 years and over
Males 37.5% Never married62.5% Now married0.0% Separated0.0% Widowed0.0% DivorcedFemales 65.5% Never married21.4% Now married0.0% Separated0.0% Widowed13.1% DivorcedWomen who gave birth in the past 12 months Now married:
31.2% (6)Unmarried:
68.8% (13)
Women who did not give birth in the past 12 months Now married:
5.7% (2)Unmarried:
94.3% (40)
Marital status - Asian population 15 years and over
Males 0.0% Never married100.0% Now married0.0% Separated0.0% Widowed0.0% DivorcedFemales 53.4% Never married46.6% Now married0.0% Separated0.0% Widowed0.0% DivorcedWomen who did not give birth in the past 12 months Now married:
46.6% (61)Unmarried:
53.4% (70)
Marital status - Other race population 15 years and over
Males 34.4% Never married39.6% Now married7.0% Separated0.0% Widowed18.9% DivorcedFemales 42.9% Never married43.4% Now married0.0% Separated0.0% Widowed13.7% DivorcedWomen who did not give birth in the past 12 months Now married:
50.3% (104)Unmarried:
49.7% (103)
Marital status - Two or more races population 15 years and over
Males 50.4% Never married23.2% Now married0.0% Separated0.0% Widowed26.5% DivorcedFemales 56.3% Never married14.8% Now married0.0% Separated8.6% Widowed20.3% DivorcedWomen who did not give birth in the past 12 months Now married:
17.3% (103)Unmarried:
82.7% (493)
Marital status - White alone, not Hispanic / Latino population 15 years and over
Males 42.1% Never married41.5% Now married1.1% Separated3.9% Widowed11.3% DivorcedFemales 36.0% Never married35.8% Now married2.4% Separated9.3% Widowed16.5% DivorcedWomen who gave birth in the past 12 months Now married:
29.5% (108)Unmarried:
70.5% (259)
Women who did not give birth in the past 12 months Now married:
28.5% (878)Unmarried:
71.5% (2,208)
Marital status - Hispanic or Latino population 15 years and over
Males 33.8% Never married32.1% Now married3.1% Separated0.0% Widowed31.0% DivorcedFemales 47.2% Never married41.2% Now married2.7% Separated2.4% Widowed6.5% DivorcedWomen who gave birth in the past 12 months Now married:
100.0% (5)Unmarried:
0.0% (0)
Women who did not give birth in the past 12 months Now married:
41.4% (210)Unmarried:
58.6% (297)
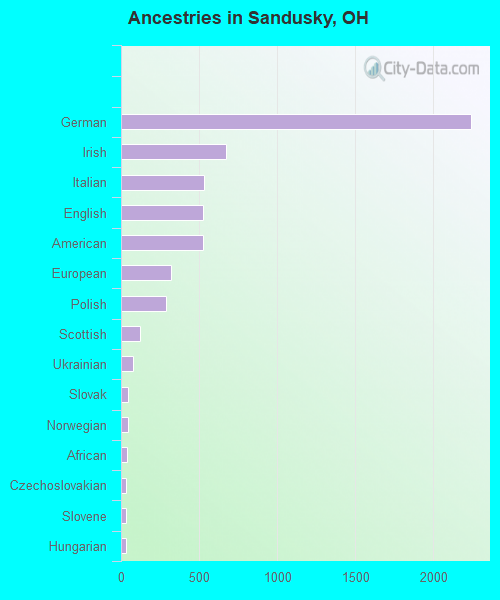
Ancestries in Sandusky
2,246 20.3% German672 6.1% Irish534 4.8% Italian527 4.8% English523 4.7% American320 2.9% European288 2.6% Polish122 1.1% Scottish79 0.7% Ukrainian47 0.4% Slovak42 0.4% Norwegian38 0.3% African34 0.3% Czechoslovakian31 0.3% Slovene30 0.3% Hungarian19 0.2% Czech19 0.2% Greek17 0.2% Canadian16 0.1% Swedish15 0.1% West Indian14 0.1% Swiss11 0.10% French Canadian10 0.09% Pennsylvania German8 0.07% Yugoslavian7 0.06% Scotch-Irish5 0.05% Lithuanian4 0.04% Welsh3 0.03% Ethiopian
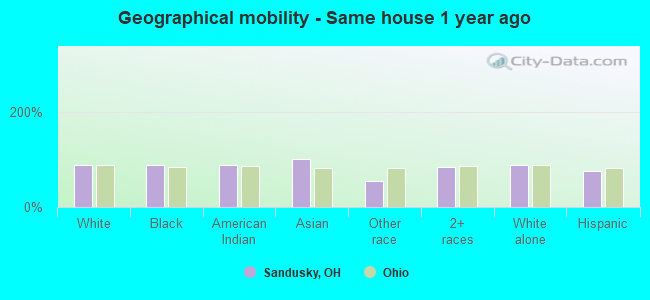
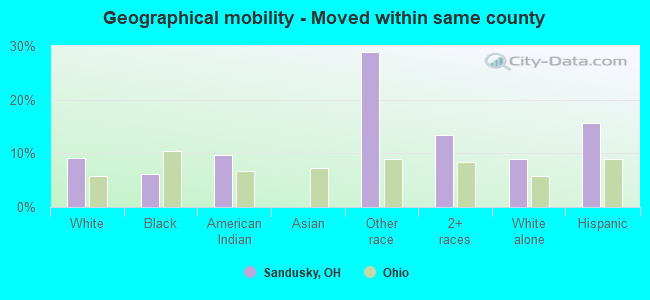
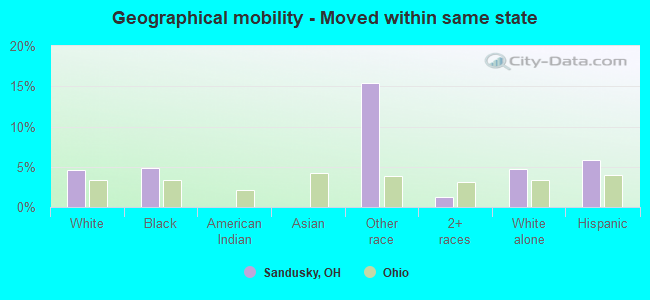
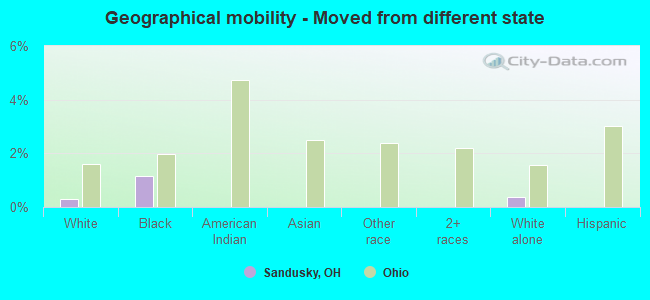
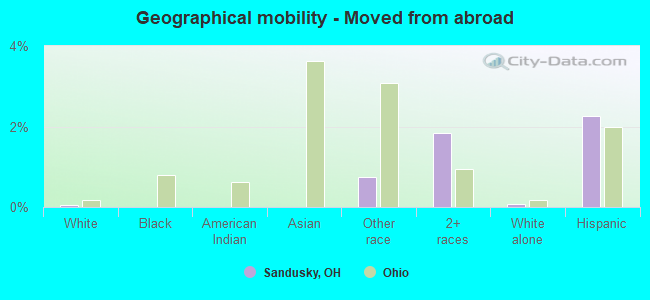
Geographical mobility in Sandusky Same house 1 year ago 13,792 86.6% White (Caucasian)4,915 88.2% Black or African American104 88.4% American Indian / Alaska Native164 100.0% Asian470 54.2% Other race2,006 83.2% Two or more races13,506 86.8% White alone, not Hispanic / Latino1,276 75.4% Hispanic or LatinoMoved within same county 1,466 9.2% White / Caucasian347 6.2% Black or African American11 9.7% American Indian / Alaska Native251 29.0% Other race323 13.4% Two or more races1,399 9.0% White alone, not Hispanic / Latino264 15.6% Hispanic or LatinoMoved within same state 742 4.7% White / Caucasian272 4.9% Black or African American134 15.5% Other race29 1.2% Two or more races727 4.7% White alone, not Hispanic / Latino98 5.8% Hispanic or LatinoMoved from different state 47 0.3% White / Caucasian65 1.2% Black or African American56 0.4% White alone, not Hispanic / LatinoMoved from abroad 10 0.1% White7 0.8% Other race44 1.8% Two or more races11 0.1% White alone, not Hispanic / Latino38 2.3% Hispanic or Latino
Children Nativity (place of birth) in Sandusky
Children under 6 years - Living with two parents Both parents native 414 100.0% NativeBoth parents foreign-born 55 100.0% NativeChildren under 6 years - Living with one parent Native parent 1,451 100.0% Native
Children 6 to 17 years - Living with two parents Both parents native 828 100.0% NativeChildren 6 to 17 years - Living with one parent Native parent 2,197 100.0% Native
Grandparents responsible for own grandchildren in Sandusky
Grandparents (30 to 59 years) White / Caucasian 7 23.2% Responsible for grandchildren23 76.8% Not responsible for grandchildrenBlack or African American 23 100.0% Not responsible for grandchildrenAmerican Indian / Alaska Native 7 100.0% Responsible for grandchildrenWhite alone, not Hispanic / Latino 7 22.7% Responsible for grandchildren24 77.3% Not responsible for grandchildrenHispanic or Latino 7 100.0% Responsible for grandchildrenGrandparents (60 years and over) White / Caucasian 99 53.3% Responsible for grandchildren87 46.7% Not responsible for grandchildrenBlack or African American 37 23.4% Responsible for grandchildren119 76.6% Not responsible for grandchildrenWhite alone, not Hispanic / Latino 91 54.2% Responsible for grandchildren77 45.8% Not responsible for grandchildrenHispanic or Latino 6 32.2% Responsible for grandchildren12 67.8% Not responsible for grandchildren