Races in Sanford, North Carolina (NC) Detailed Stats
Data:
Races - White alone (%)
Races - White alone (% change since 2000)
Races - Black alone (%)
Races - Black alone (% change since 2000)
Races - American Indian alone (%)
Races - American Indian alone (% change since 2000)
Races - Asian alone (%)
Races - Asian alone (% change since 2000)
Races - Hispanic (%)
Races - Hispanic (% change since 2000)
Races - Native Hawaiian and Other Pacific Islander alone (%)
Races - Native Hawaiian and Other Pacific Islander alone (% change since 2000)
Races - Two or more races(%)
Races - Two or more races(% change since 2000)
Races - Other race alone (%)
Races - Other race alone (% change since 2000)
Racial diversity
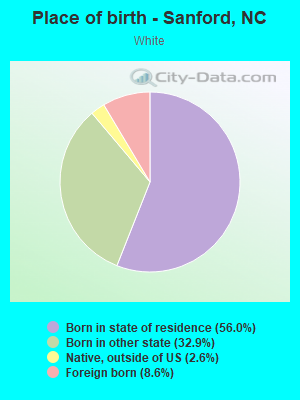
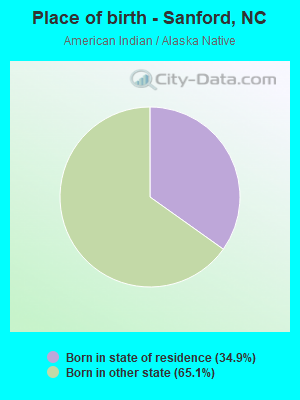
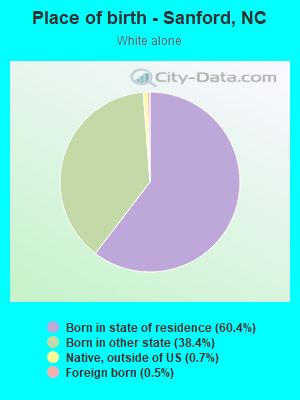
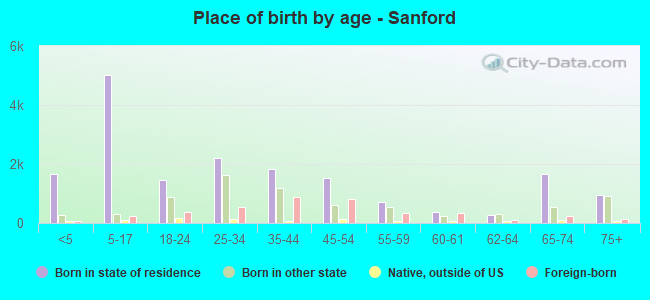
Place of birth - Born in state of residence (%)
Place of birth - Born in state of residence (%) - White
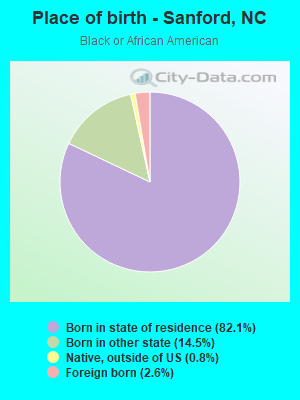
Place of birth - Born in state of residence (%) - Black or African American
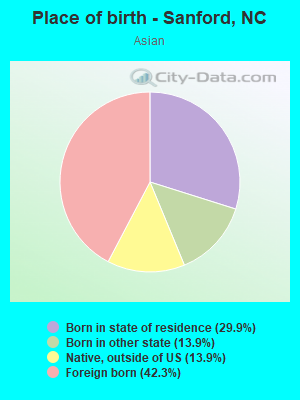
Place of birth - Born in state of residence (%) - Asian
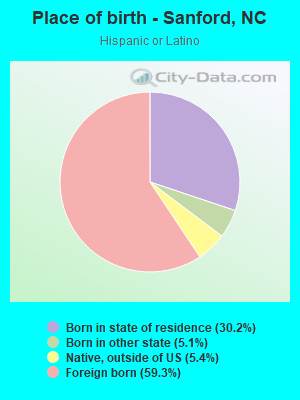
Place of birth - Born in state of residence (%) - Hispanic or Latino
Place of birth - Born in state of residence (%) - American Indian and Alaska Native
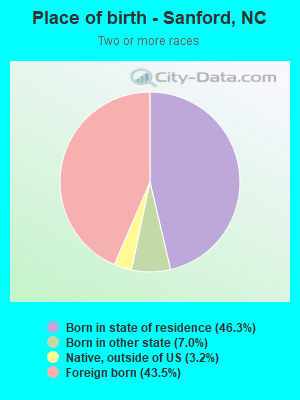
Place of birth - Born in state of residence (%) - Multirace
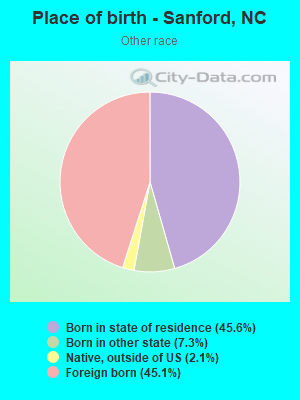
Place of birth - Born in state of residence (%) - Other Race
Place of birth - Born in other state (%)
Place of birth - Born in other state (%) - White
Place of birth - Born in other state (%) - Black or African American
Place of birth - Born in other state (%) - Asian
Place of birth - Born in other state (%) - Hispanic or Latino
Place of birth - Born in other state (%) - American Indian and Alaska Native
Place of birth - Born in other state (%) - Multirace
Place of birth - Born in other state (%) - Other Race
Place of birth - Native, outside of US (%)
Place of birth - Native, outside of US (%) - White
Place of birth - Native, outside of US (%) - Black or African American
Place of birth - Native, outside of US (%) - Asian
Place of birth - Native, outside of US (%) - Hispanic or Latino
Place of birth - Native, outside of US (%) - American Indian and Alaska Native
Place of birth - Native, outside of US (%) - Multirace
Place of birth - Native, outside of US (%) - Other Race
Place of birth - Foreign born (%)
Place of birth - Foreign born (%) - White
Place of birth - Foreign born (%) - Black or African American
Place of birth - Foreign born (%) - Asian
Place of birth - Foreign born (%) - Hispanic or Latino
Place of birth - Foreign born (%) - American Indian and Alaska Native
Place of birth - Foreign born (%) - Multirace
Place of birth - Foreign born (%) - Other Race
Residents speaking English at home (%)
Residents speaking English at home - Born in the United States (%)
Residents speaking English at home - Native, born elsewhere (%)
Residents speaking English at home - Foreign born (%)
Residents speaking Spanish at home (%)
Residents speaking Spanish at home - Born in the United States (%)
Residents speaking Spanish at home - Native, born elsewhere (%)
Residents speaking Spanish at home - Foreign born (%)
Residents speaking other language at home (%)
Residents speaking other language at home - Born in the United States (%)
Residents speaking other language at home - Native, born elsewhere (%)
Residents speaking other language at home - Foreign born (%)
Marital status - Never married (%)
Marital status - Now married (%)
Marital status - Separated (%)
Marital status - Widowed (%)
Marital status - Divorced (%)
Ancestries Reported - Arab (%)
Ancestries Reported - Czech (%)
Ancestries Reported - Danish (%)
Ancestries Reported - Dutch (%)
Ancestries Reported - English (%)
Ancestries Reported - French (%)
Ancestries Reported - French Canadian (%)
Ancestries Reported - German (%)
Ancestries Reported - Greek (%)
Ancestries Reported - Hungarian (%)
Ancestries Reported - Irish (%)
Ancestries Reported - Italian (%)
Ancestries Reported - Lithuanian (%)
Ancestries Reported - Norwegian (%)
Ancestries Reported - Polish (%)
Ancestries Reported - Portuguese (%)
Ancestries Reported - Russian (%)
Ancestries Reported - Scotch-Irish (%)
Ancestries Reported - Scottish (%)
Ancestries Reported - Slovak (%)
Ancestries Reported - Subsaharan African (%)
Ancestries Reported - Swedish (%)
Ancestries Reported - Swiss (%)
Ancestries Reported - Ukrainian (%)
Ancestries Reported - United States (%)
Ancestries Reported - Welsh (%)
Ancestries Reported - West Indian (%)
Ancestries Reported - Other (%)
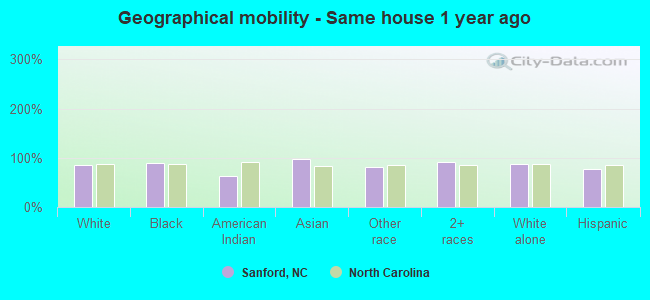
Geographical mobility - Same house 1 year ago (%)
Geographical mobility - Same house 1 year ago (%) - White
Geographical mobility - Same house 1 year ago (%) - Black or African American
Geographical mobility - Same house 1 year ago (%) - Asian
Geographical mobility - Same house 1 year ago (%) - Hispanic or Latino
Geographical mobility - Same house 1 year ago (%) - American Indian and Alaska Native
Geographical mobility - Same house 1 year ago (%) - Multirace
Geographical mobility - Same house 1 year ago (%) - Other Race
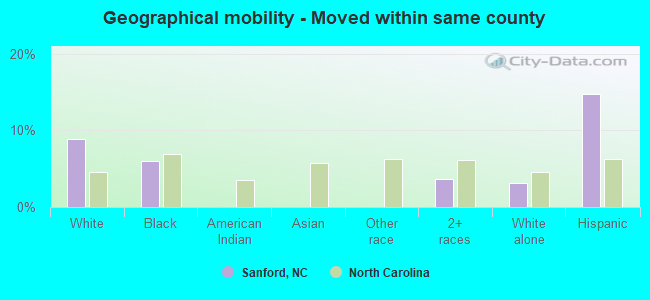
Geographical mobility - Moved within same county (%)
Geographical mobility - Moved within same county (%) - White
Geographical mobility - Moved within same county (%) - Black or African American
Geographical mobility - Moved within same county (%) - Asian
Geographical mobility - Moved within same county (%) - Hispanic or Latino
Geographical mobility - Moved within same county (%) - American Indian and Alaska Native
Geographical mobility - Moved within same county (%) - Multirace
Geographical mobility - Moved within same county (%) - Other Race
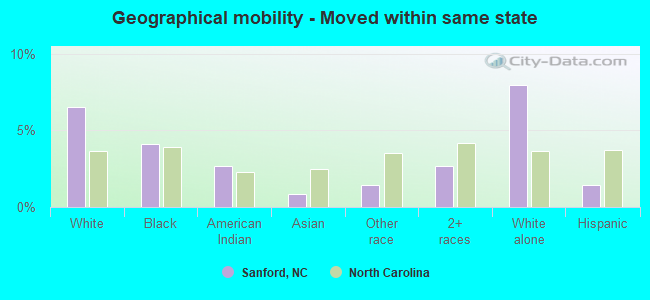
Geographical mobility - Moved from different county within same state (%)
Geographical mobility - Moved from different county within same state (%) - White
Geographical mobility - Moved from different county within same state (%) - Black or African American
Geographical mobility - Moved from different county within same state (%) - Asian
Geographical mobility - Moved from different county within same state (%) - Hispanic or Latino
Geographical mobility - Moved from different county within same state (%) - American Indian and Alaska Native
Geographical mobility - Moved from different county within same state (%) - Multirace
Geographical mobility - Moved from different county within same state (%) - Other Race
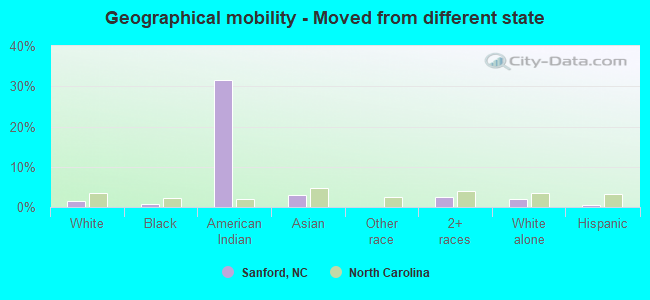
Geographical mobility - Moved from different state (%)
Geographical mobility - Moved from different state (%) - White
Geographical mobility - Moved from different state (%) - Black or African American
Geographical mobility - Moved from different state (%) - Asian
Geographical mobility - Moved from different state (%) - Hispanic or Latino
Geographical mobility - Moved from different state (%) - American Indian and Alaska Native
Geographical mobility - Moved from different state (%) - Multirace
Geographical mobility - Moved from different state (%) - Other Race
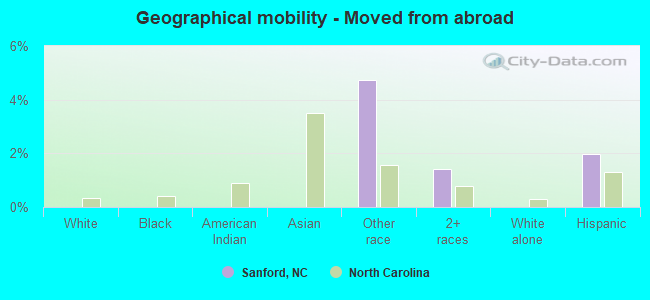
Geographical mobility - Moved from abroad (%)
Geographical mobility - Moved from abroad (%) - White
Geographical mobility - Moved from abroad (%) - Black or African American
Geographical mobility - Moved from abroad (%) - Asian
Geographical mobility - Moved from abroad (%) - Hispanic or Latino
Geographical mobility - Moved from abroad (%) - American Indian and Alaska Native
Geographical mobility - Moved from abroad (%) - Multirace
Geographical mobility - Moved from abroad (%) - Other Race
Place of birth for the foreign-born population - Ireland (%)
Place of birth for the foreign-born population - Denmark (%)
Place of birth for the foreign-born population - Norway (%)
Place of birth for the foreign-born population - Sweden (%)
Place of birth for the foreign-born population - United Kingdom (%)
Place of birth for the foreign-born population - England (%)
Place of birth for the foreign-born population - Scotland (%)
Place of birth for the foreign-born population - Other Northern Europe (%)
Place of birth for the foreign-born population - Austria (%)
Place of birth for the foreign-born population - Belgium (%)
Place of birth for the foreign-born population - France (%)
Place of birth for the foreign-born population - Germany (%)
Place of birth for the foreign-born population - Netherlands (%)
Place of birth for the foreign-born population - Switzerland (%)
Place of birth for the foreign-born population - Other Western Europe (%)
Place of birth for the foreign-born population - Greece (%)
Place of birth for the foreign-born population - Italy (%)
Place of birth for the foreign-born population - Portugal (%)
Place of birth for the foreign-born population - Spain (%)
Place of birth for the foreign-born population - Other Southern Europe (%)
Place of birth for the foreign-born population - Albania (%)
Place of birth for the foreign-born population - Belarus (%)
Place of birth for the foreign-born population - Bosnia and Herzegovina (%)
Place of birth for the foreign-born population - Bulgaria (%)
Place of birth for the foreign-born population - Croatia (%)
Place of birth for the foreign-born population - Czechoslovakia (%)
Place of birth for the foreign-born population - Hungary (%)
Place of birth for the foreign-born population - Latvia (%)
Place of birth for the foreign-born population - Lithuania (%)
Place of birth for the foreign-born population - North Macedonia (Macedonia) (%)
Place of birth for the foreign-born population - Moldova (%)
Place of birth for the foreign-born population - Poland (%)
Place of birth for the foreign-born population - Romania (%)
Place of birth for the foreign-born population - Russia (%)
Place of birth for the foreign-born population - Serbia (%)
Place of birth for the foreign-born population - Ukraine (%)
Place of birth for the foreign-born population - Other Eastern Europe (%)
Place of birth for the foreign-born population - China (%)
Place of birth for the foreign-born population - Hong Kong (%)
Place of birth for the foreign-born population - Taiwan (%)
Place of birth for the foreign-born population - Japan (%)
Place of birth for the foreign-born population - Korea (%)
Place of birth for the foreign-born population - Other Eastern Asia (%)
Place of birth for the foreign-born population - Afghanistan (%)
Place of birth for the foreign-born population - Bangladesh (%)
Place of birth for the foreign-born population - India (%)
Place of birth for the foreign-born population - Iran (%)
Place of birth for the foreign-born population - Kazakhstan (%)
Place of birth for the foreign-born population - Nepal (%)
Place of birth for the foreign-born population - Pakistan (%)
Place of birth for the foreign-born population - Sri Lanka (%)
Place of birth for the foreign-born population - Uzbekistan (%)
Place of birth for the foreign-born population - Other South Central Asia (%)
Place of birth for the foreign-born population - Burma (%)
Place of birth for the foreign-born population - Cambodia (%)
Place of birth for the foreign-born population - Indonesia (%)
Place of birth for the foreign-born population - Laos (%)
Place of birth for the foreign-born population - Malaysia (%)
Place of birth for the foreign-born population - Philippines (%)
Place of birth for the foreign-born population - Singapore (%)
Place of birth for the foreign-born population - Thailand (%)
Place of birth for the foreign-born population - Vietnam (%)
Place of birth for the foreign-born population - Other South Eastern Asia (%)
Place of birth for the foreign-born population - Armenia (%)
Place of birth for the foreign-born population - Iraq (%)
Place of birth for the foreign-born population - Israel (%)
Place of birth for the foreign-born population - Jordan (%)
Place of birth for the foreign-born population - Kuwait (%)
Place of birth for the foreign-born population - Lebanon (%)
Place of birth for the foreign-born population - Saudi Arabia (%)
Place of birth for the foreign-born population - Syria (%)
Place of birth for the foreign-born population - Turkey (%)
Place of birth for the foreign-born population - Yemen (%)
Place of birth for the foreign-born population - Other Western Asia (%)
Place of birth for the foreign-born population - Eritrea (%)
Place of birth for the foreign-born population - Ethiopia (%)
Place of birth for the foreign-born population - Kenya (%)
Place of birth for the foreign-born population - Somalia (%)
Place of birth for the foreign-born population - Uganda (%)
Place of birth for the foreign-born population - Zimbabwe (%)
Place of birth for the foreign-born population - Other Eastern Africa (%)
Place of birth for the foreign-born population - Cameroon (%)
Place of birth for the foreign-born population - Congo (%)
Place of birth for the foreign-born population - Democratic Republic of Congo (Zaire) (%)
Place of birth for the foreign-born population - Other Middle Africa (%)
Place of birth for the foreign-born population - Egypt (%)
Place of birth for the foreign-born population - Morocco (%)
Place of birth for the foreign-born population - Sudan (%)
Place of birth for the foreign-born population - Other Northern Africa (%)
Place of birth for the foreign-born population - South Africa (%)
Place of birth for the foreign-born population - Other Southern Africa (%)
Place of birth for the foreign-born population - Cabo Verde (%)
Place of birth for the foreign-born population - Ghana (%)
Place of birth for the foreign-born population - Liberia (%)
Place of birth for the foreign-born population - Nigeria (%)
Place of birth for the foreign-born population - Senegal (%)
Place of birth for the foreign-born population - Sierra Leone (%)
Place of birth for the foreign-born population - Other Western Africa (%)
Place of birth for the foreign-born population - Australia (%)
Place of birth for the foreign-born population - New Zealand (%)
Place of birth for the foreign-born population - Fiji (%)
Place of birth for the foreign-born population - Micronesia (%)
Place of birth for the foreign-born population - Bahamas (%)
Place of birth for the foreign-born population - Barbados (%)
Place of birth for the foreign-born population - Cuba (%)
Place of birth for the foreign-born population - Dominica (%)
Place of birth for the foreign-born population - Dominican Republic (%)
Place of birth for the foreign-born population - Grenada (%)
Place of birth for the foreign-born population - Haiti (%)
Place of birth for the foreign-born population - Jamaica (%)
Place of birth for the foreign-born population - St. Vincent and the Grenadines (%)
Place of birth for the foreign-born population - Trinidad and Tobago (%)
Place of birth for the foreign-born population - West Indies (%)
Place of birth for the foreign-born population - Other Caribbean (%)
Place of birth for the foreign-born population - Belize (%)
Place of birth for the foreign-born population - Costa Rica (%)
Place of birth for the foreign-born population - El Salvador (%)
Place of birth for the foreign-born population - Guatemala (%)
Place of birth for the foreign-born population - Honduras (%)
Place of birth for the foreign-born population - Mexico (%)
Place of birth for the foreign-born population - Nicaragua (%)
Place of birth for the foreign-born population - Panama (%)
Place of birth for the foreign-born population - Other Central America (%)
Place of birth for the foreign-born population - Argentina (%)
Place of birth for the foreign-born population - Bolivia (%)
Place of birth for the foreign-born population - Brazil (%)
Place of birth for the foreign-born population - Chile (%)
Place of birth for the foreign-born population - Colombia (%)
Place of birth for the foreign-born population - Ecuador (%)
Place of birth for the foreign-born population - Guyana (%)
Place of birth for the foreign-born population - Peru (%)
Place of birth for the foreign-born population - Uruguay (%)
Place of birth for the foreign-born population - Venezuela (%)
Place of birth for the foreign-born population - Other South America (%)
Place of birth for the foreign-born population - Canada (%)
Place of birth for the foreign-born population - Other Northern America (%)
Place of birth for the foreign-born population - Other (%)
Latest news about races in Sanford, NC collected exclusively by city-data.com from local newspapers, TV, and radio stations
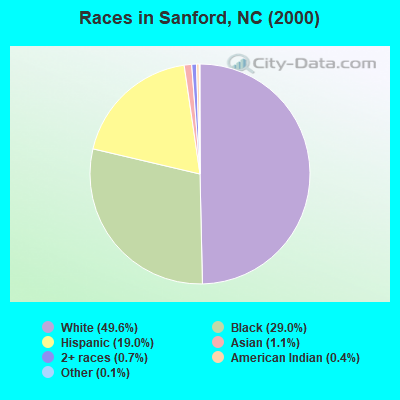
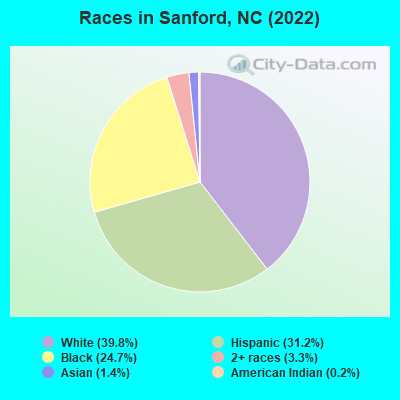
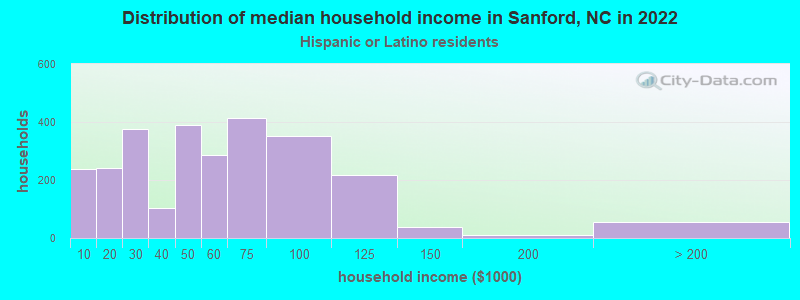
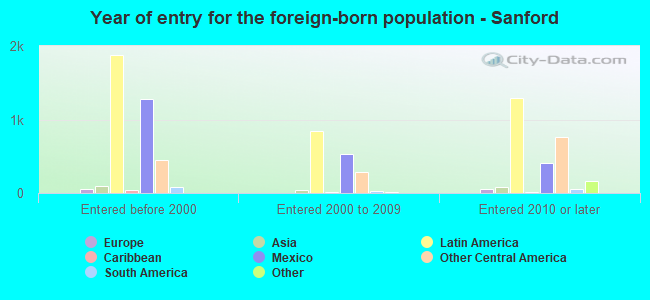
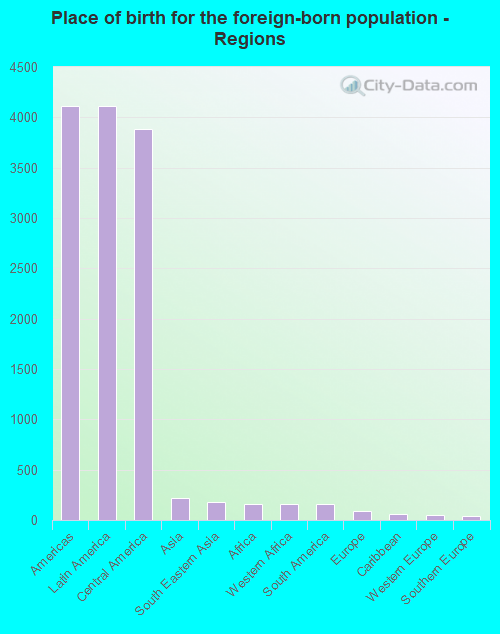
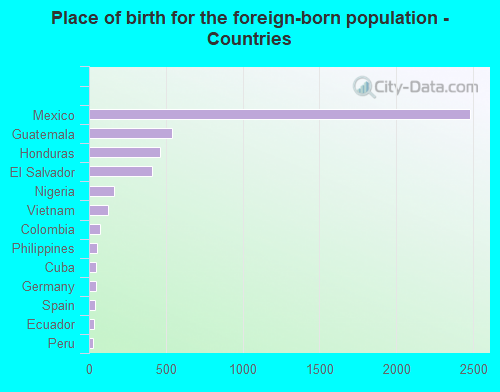
According to 2022 data, the most numerous races in Sanford, NC are White alone (12,347 residents), Black alone (7,651 residents), and Hispanic (9,695 residents). 70.6% of Sanford residents speak English at home. 14.6% of Sanford, NC residents are foreign-born (12.8% born in Latin America), which is 45.3% greater than the foreign-born rate of 8.0% across the entire state of North Carolina.
Race distribution in Sanford
2000 2022
5,647,155 70.2% White alone 1,723,301 21.4% Black alone 378,963 4.7% Hispanic 112,416 1.4% Asian alone 95,333 1.2% American Indian alone 79,965 1.0% Two or more races 9,015 0.1% Other race alone 3,165 0.04% Native Hawaiian and Other
6,497,519 60.7% White alone 2,155,650 20.1% Black alone 1,114,799 10.4% Hispanic 438,061 4.1% Two or more races 341,052 3.2% Asian alone 91,758 0.9% American Indian alone 50,180 0.5% Other race alone 9,954 0.09% Native Hawaiian and Other
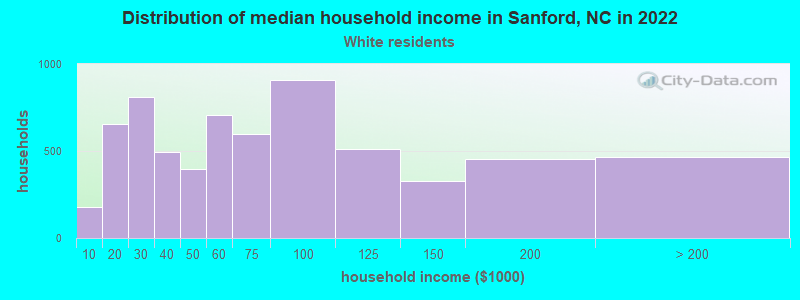
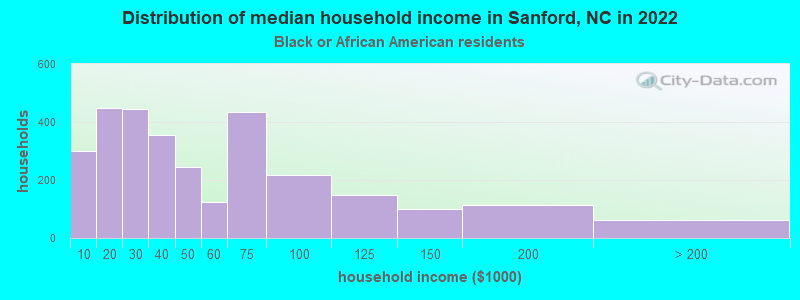
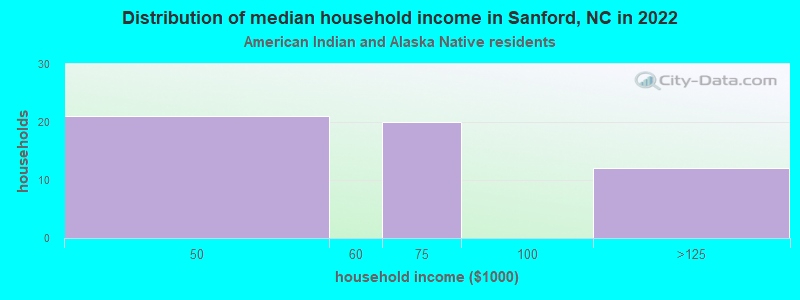
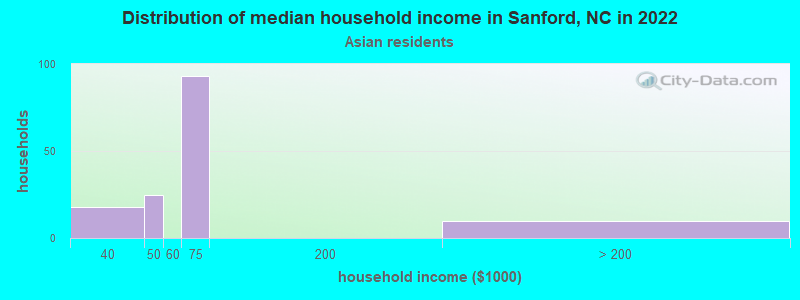
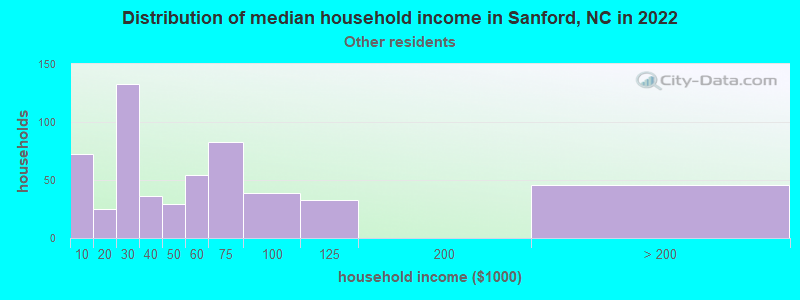
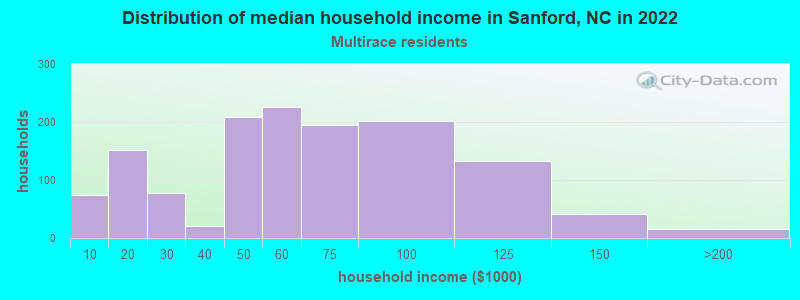
Income and house value in Sanford Median household income in 2022 $66,144 White non-Hispanic householders$34,057 Black householders$68,936 American Indian and Alaska Native householders$74,135 Asian householders$27,190 Some other race householders$52,977 Two or more races householders$51,383 Hispanic or Latino race householdersMedian 2022 house value $293,179 White Non-Hispanic householders$182,024 Black or African American householders$230,250 American Indian or Alaska Native householders $376,692 Asian householders$210,842 Some other race householders$200,549 Hispanic or Latino householders
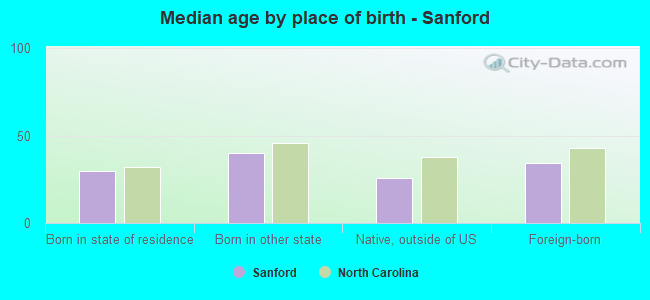
Median age by race in Sanford
39.7 Median age for White residents39.5 40.9 31.8 Median age for Black or African American residents29.7 33.7 42.1 Median age for American Indian / Alaska Native residents36.0 -682,971,013.8 35.8 Median age for Asian residents43.0 35.9 -666,666,666.0 Median age for Native Hawaiian / Pacific Islander residents-666,666,666.0 -666,666,666.0 28.7 Median age for Other race residents26.8 34.3 19.7 Median age for Two or more races residents21.4 17.9 42.4 Median age for White alone residents39.4 45.5 26.6 Median age for Hispanic or Latino residents25.2 28.3
Owner/renter occupied households by race in Sanford
House owners and renters - White residents 4,017 61.0% Owner occupied2,568 39.0% Renter occupiedHouse owners and renters - Black or African American residents 871 27.5% Owner occupied2,296 72.5% Renter occupiedHouse owners and renters - American Indian / Alaska Native residents 15 27.4% Owner occupied40 72.6% Renter occupiedHouse owners and renters - Asian residents 102 72.5% Owner occupied39 27.5% Renter occupiedHouse owners and renters - Other race residents 357 62.0% Owner occupied219 38.0% Renter occupiedHouse owners and renters - Two or more races residents 294 26.3% Owner occupied822 73.7% Renter occupiedHouse owners and renters - White alone residents 3,775 65.6% Owner occupied1,981 34.4% Renter occupiedHouse owners and renters - Hispanic or Latino residents 753 32.0% Owner occupied1,596 68.0% Renter occupied
Language usage in Sanford
English speakers - Total 70.6% of residents of Sanford speak English at home.
28.9% of residents speak Spanish at home 2,125 25.1% Speak English very well6,326 74.9% Speak English less than very well2.6% of residents speak other language at home 572 76.5% Speak English very well176 23.5% Speak English less than very well
English speakers - Born in the United States 91.4% of residents of Sanford speak English at home.
11.6% of residents speak Spanish at home 623 76.7% Speak English very well189 23.3% Speak English less than very well0.7% of residents speak other language at home 51 100.0% Speak English very well
English speakers - Native, born elsewhere 14.6% of residents of Sanford speak English at home.
67.0% of residents speak Spanish at home 281 57.3% Speak English very well209 42.7% Speak English less than very well12.3% of residents speak other language at home 90 100.0% Speak English less than very well
English speakers - Foreign-born 2.3% of residents of Sanford speak English at home.
98.1% of residents speak Spanish at home 329 5.6% Speak English very well5,522 94.4% Speak English less than very well6.6% of residents speak other language at home 291 74.4% Speak English very well100 25.6% Speak English less than very well
White (Caucasian) - Speak only English Native:
88.9% (12,270)Foreign-born:
4.2% (57)
White (Caucasian) - Speak another language Native:
9.5% (1,317)Foreign-born:
81.0% (1,100)
Black or African American - Speak another language Native:
3.7% (265)Foreign-born:
99.2% (184)
Asian - Speak only English Native:
32.4% (79)Foreign-born:
15.3% (33)
Asian - Speak another language Native:
67.8% (165)Foreign-born:
84.7% (183)
Other race - Speak only English Native:
27.4% (296)Foreign-born:
5.2% (64)
Other race - Speak another language Native:
69.9% (757)Foreign-born:
94.9% (1,181)
Two or more races - Speak only English Native:
39.3% (993)Foreign-born:
0.7% (11)
Two or more races - Speak another language Native:
66.4% (1,677)Foreign-born:
100.0% (1,550)
White alone - Speak only English Native:
98.9% (11,691)Foreign-born:
5.6% (3)
White alone - Speak another language Native:
1.0% (120)Foreign-born:
94.4% (54)
Hispanic or Latino - Speak only English Native:
23.6% (805)Foreign-born:
4.3% (251)
Hispanic or Latino - Speak another language Native:
73.9% (2,518)Foreign-born:
96.0% (5,591)
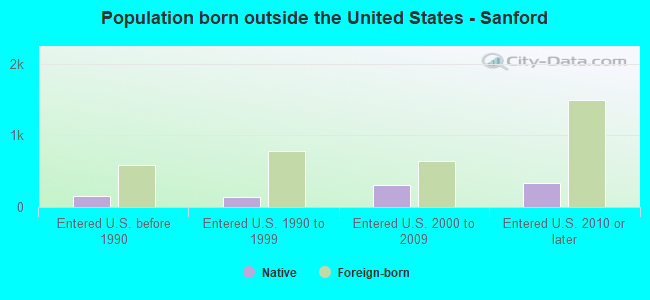
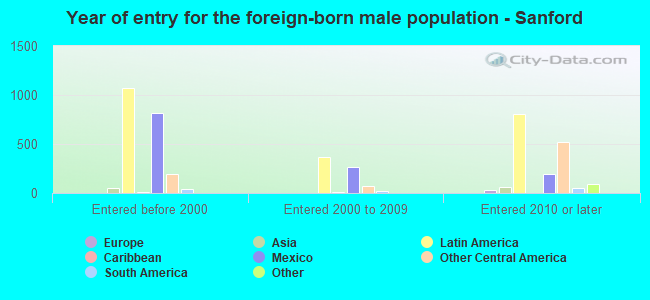
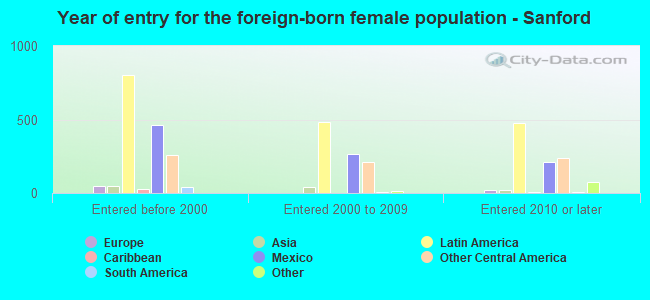
Foreign-born residents in Sanford 4,578 residents are foreign born (12.8% Latin America ).
This city:
14.6%North Carolina:
8.3%
Marital status for residents in Sanford Marital status - White (Caucasian) population 15 years and over
Males 32.1% Never married51.2% Now married1.0% Separated3.8% Widowed11.9% DivorcedFemales 24.2% Never married46.3% Now married1.6% Separated12.0% Widowed15.9% DivorcedWomen who gave birth in the past 12 months Now married:
40.7% (35)Unmarried:
59.3% (52)
Women who did not give birth in the past 12 months Now married:
50.6% (1,751)Unmarried:
49.4% (1,708)
Marital status - Black or African American population 15 years and over
Males 53.5% Never married31.8% Now married1.9% Separated3.5% Widowed9.3% DivorcedFemales 48.9% Never married21.7% Now married2.9% Separated8.2% Widowed18.4% DivorcedWomen who gave birth in the past 12 months Now married:
22.6% (61)Unmarried:
77.4% (209)
Women who did not give birth in the past 12 months Now married:
25.2% (451)Unmarried:
74.8% (1,340)
Marital status - American Indian / Alaska Native population 15 years and over
Males 83.6% Never married16.4% Now married0.0% Separated0.0% Widowed0.0% DivorcedFemales 0.0% Never married100.0% Now married0.0% Separated0.0% Widowed0.0% DivorcedWomen who gave birth in the past 12 months Now married:
100.0% (3)Unmarried:
0.0% (0)
Marital status - Asian population 15 years and over
Males 0.0% Never married84.5% Now married0.0% Separated0.0% Widowed15.5% DivorcedFemales 25.2% Never married74.8% Now married0.0% Separated0.0% Widowed0.0% DivorcedWomen who did not give birth in the past 12 months Now married:
75.1% (168)Unmarried:
24.9% (56)
Marital status - Other race population 15 years and over
Males 48.8% Never married50.7% Now married0.5% Separated0.0% Widowed0.0% DivorcedFemales 51.1% Never married38.0% Now married2.8% Separated1.5% Widowed6.6% DivorcedWomen who gave birth in the past 12 months Now married:
36.0% (12)Unmarried:
64.0% (22)
Women who did not give birth in the past 12 months Now married:
34.8% (207)Unmarried:
65.2% (388)
Marital status - Two or more races population 15 years and over
Males 43.6% Never married52.8% Now married1.9% Separated0.0% Widowed1.7% DivorcedFemales 35.2% Never married47.3% Now married5.3% Separated5.0% Widowed7.2% DivorcedWomen who gave birth in the past 12 months Now married:
100.0% (116)Unmarried:
0.0% (0)
Women who did not give birth in the past 12 months Now married:
39.0% (393)Unmarried:
61.0% (613)
Marital status - White alone, not Hispanic / Latino population 15 years and over
Males 30.4% Never married55.0% Now married0.9% Separated4.4% Widowed9.3% DivorcedFemales 21.2% Never married47.6% Now married2.0% Separated14.1% Widowed15.1% DivorcedWomen who gave birth in the past 12 months Now married:
13.2% (7)Unmarried:
86.8% (48)
Women who did not give birth in the past 12 months Now married:
54.4% (1,469)Unmarried:
45.6% (1,233)
Marital status - Hispanic or Latino population 15 years and over
Males 42.0% Never married45.4% Now married1.4% Separated1.0% Widowed10.2% DivorcedFemales 42.5% Never married40.5% Now married2.7% Separated3.8% Widowed10.6% DivorcedWomen who gave birth in the past 12 months Now married:
61.9% (42)Unmarried:
38.1% (26)
Women who did not give birth in the past 12 months Now married:
38.5% (870)Unmarried:
61.5% (1,391)
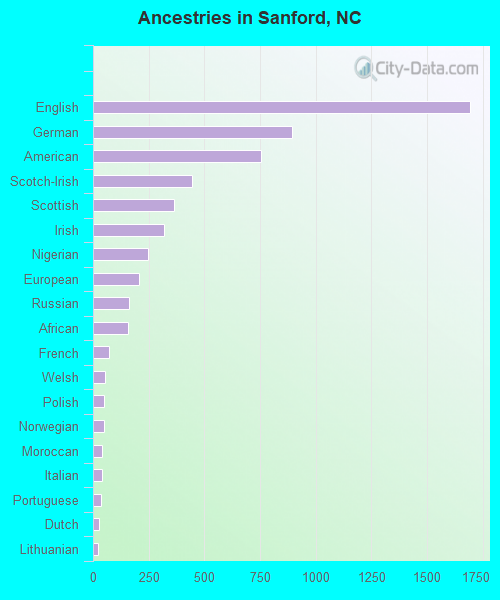
Ancestries in Sanford
1,694 8.5% English896 4.5% German756 3.8% American446 2.2% Scotch-Irish365 1.8% Scottish321 1.6% Irish247 1.2% Nigerian205 1.0% European162 0.8% Russian156 0.8% African70 0.3% French56 0.3% Welsh51 0.3% Polish49 0.2% Norwegian39 0.2% Moroccan39 0.2% Italian34 0.2% Portuguese27 0.1% Dutch24 0.1% Lithuanian14 0.07% Hungarian13 0.06% Danish11 0.05% British8 0.04% Australian8 0.04% Greek8 0.04% Latvian7 0.03% Eastern European7 0.03% Finnish3 0.01% French Canadian
Geographical mobility in Sanford Same house 1 year ago 13,383 86.4% White (Caucasian)6,950 89.3% Black or African American55 63.6% American Indian / Alaska Native508 97.4% Asian3,609 81.3% Other race4,021 90.5% Two or more races11,027 88.2% White alone, not Hispanic / Latino7,465 77.4% Hispanic or LatinoMoved within same county 1,380 8.9% White / Caucasian469 6.0% Black or African American1 0.0% Other race161 3.6% Two or more races398 3.2% White alone, not Hispanic / Latino1,424 14.8% Hispanic or LatinoMoved within same state 1,005 6.5% White / Caucasian318 4.1% Black or African American2 2.7% American Indian / Alaska Native4 0.8% Asian64 1.4% Other race118 2.6% Two or more races992 7.9% White alone, not Hispanic / Latino137 1.4% Hispanic or LatinoMoved from different state 227 1.5% White / Caucasian53 0.7% Black or African American27 31.5% American Indian / Alaska Native15 2.9% Asian112 2.5% Two or more races235 1.9% White alone, not Hispanic / Latino45 0.5% Hispanic or LatinoMoved from abroad 209 4.7% Other race64 1.4% Two or more races190 2.0% Hispanic or Latino
Children Nativity (place of birth) in Sanford
Children under 6 years - Living with two parents Both parents native 861 100.0% NativeBoth parents foreign-born 222 100.0% NativeOne native, one foreign-born parent 129 100.0% NativeChildren under 6 years - Living with one parent Native parent 785 100.0% NativeForeign-born parent 376 93.1% Native28 6.9% Foreign-bornChildren 6 to 17 years - Living with two parents Both parents native 2,063 100.0% NativeBoth parents foreign-born 637 83.0% Native130 17.0% Foreign-bornOne native, one foreign-born parent 199 100.0% NativeChildren 6 to 17 years - Living with one parent Native parent 1,635 100.0% NativeForeign-born parent 697 55.0% Native570 45.0% Foreign-born
Grandparents responsible for own grandchildren in Sanford
Grandparents (30 to 59 years) White / Caucasian 118 100.0% Not responsible for grandchildrenBlack or African American 22 100.0% Responsible for grandchildrenOther race 57 100.0% Not responsible for grandchildrenHispanic or Latino 20 7.9% Responsible for grandchildren234 92.1% Not responsible for grandchildrenGrandparents (60 years and over) White / Caucasian 26 40.4% Responsible for grandchildren39 59.6% Not responsible for grandchildrenBlack or African American 12 9.3% Responsible for grandchildren119 90.7% Not responsible for grandchildrenOther race 24 100.0% Not responsible for grandchildrenHispanic or Latino 81 100.0% Not responsible for grandchildren