Races in Scarsdale, New York (NY) Detailed Stats
Data:
Races - White alone (%)
Races - White alone (% change since 2000)
Races - Black alone (%)
Races - Black alone (% change since 2000)
Races - American Indian alone (%)
Races - American Indian alone (% change since 2000)
Races - Asian alone (%)
Races - Asian alone (% change since 2000)
Races - Hispanic (%)
Races - Hispanic (% change since 2000)
Races - Native Hawaiian and Other Pacific Islander alone (%)
Races - Native Hawaiian and Other Pacific Islander alone (% change since 2000)
Races - Two or more races(%)
Races - Two or more races(% change since 2000)
Races - Other race alone (%)
Races - Other race alone (% change since 2000)
Racial diversity
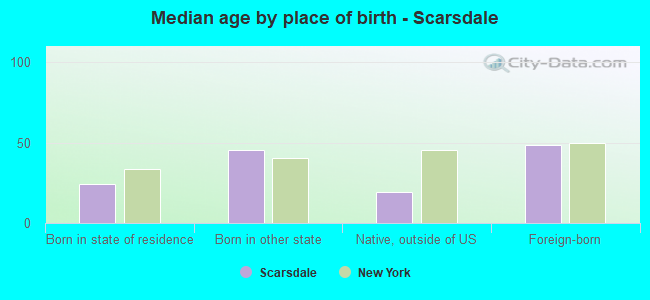
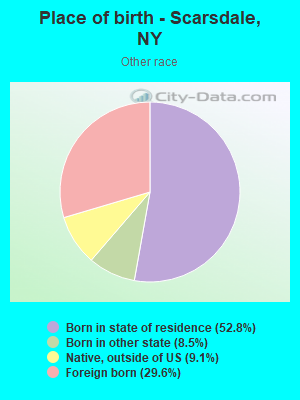
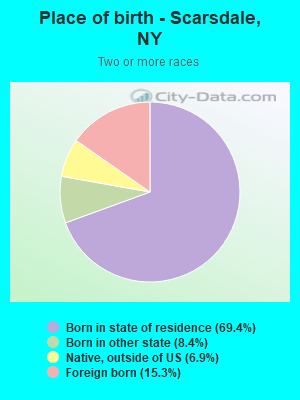
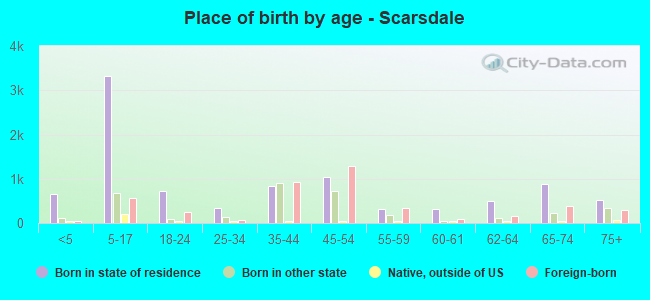
Place of birth - Born in state of residence (%)
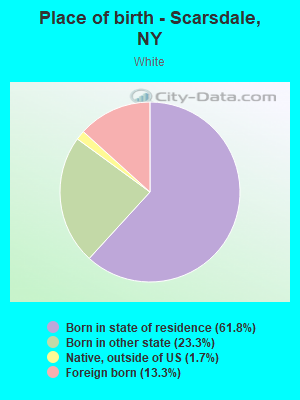
Place of birth - Born in state of residence (%) - White
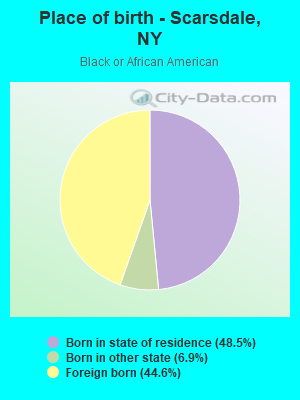
Place of birth - Born in state of residence (%) - Black or African American
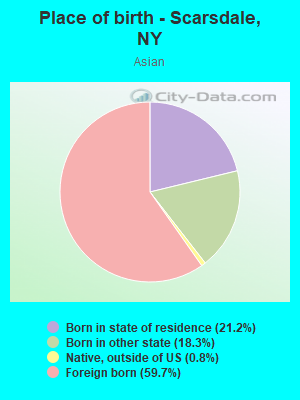
Place of birth - Born in state of residence (%) - Asian
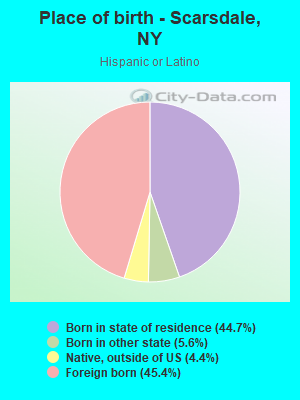
Place of birth - Born in state of residence (%) - Hispanic or Latino
Place of birth - Born in state of residence (%) - American Indian and Alaska Native
Place of birth - Born in state of residence (%) - Multirace
Place of birth - Born in state of residence (%) - Other Race
Place of birth - Born in other state (%)
Place of birth - Born in other state (%) - White
Place of birth - Born in other state (%) - Black or African American
Place of birth - Born in other state (%) - Asian
Place of birth - Born in other state (%) - Hispanic or Latino
Place of birth - Born in other state (%) - American Indian and Alaska Native
Place of birth - Born in other state (%) - Multirace
Place of birth - Born in other state (%) - Other Race
Place of birth - Native, outside of US (%)
Place of birth - Native, outside of US (%) - White
Place of birth - Native, outside of US (%) - Black or African American
Place of birth - Native, outside of US (%) - Asian
Place of birth - Native, outside of US (%) - Hispanic or Latino
Place of birth - Native, outside of US (%) - American Indian and Alaska Native
Place of birth - Native, outside of US (%) - Multirace
Place of birth - Native, outside of US (%) - Other Race
Place of birth - Foreign born (%)
Place of birth - Foreign born (%) - White
Place of birth - Foreign born (%) - Black or African American
Place of birth - Foreign born (%) - Asian
Place of birth - Foreign born (%) - Hispanic or Latino
Place of birth - Foreign born (%) - American Indian and Alaska Native
Place of birth - Foreign born (%) - Multirace
Place of birth - Foreign born (%) - Other Race
Residents speaking English at home (%)
Residents speaking English at home - Born in the United States (%)
Residents speaking English at home - Native, born elsewhere (%)
Residents speaking English at home - Foreign born (%)
Residents speaking Spanish at home (%)
Residents speaking Spanish at home - Born in the United States (%)
Residents speaking Spanish at home - Native, born elsewhere (%)
Residents speaking Spanish at home - Foreign born (%)
Residents speaking other language at home (%)
Residents speaking other language at home - Born in the United States (%)
Residents speaking other language at home - Native, born elsewhere (%)
Residents speaking other language at home - Foreign born (%)
Marital status - Never married (%)
Marital status - Now married (%)
Marital status - Separated (%)
Marital status - Widowed (%)
Marital status - Divorced (%)
Ancestries Reported - Arab (%)
Ancestries Reported - Czech (%)
Ancestries Reported - Danish (%)
Ancestries Reported - Dutch (%)
Ancestries Reported - English (%)
Ancestries Reported - French (%)
Ancestries Reported - French Canadian (%)
Ancestries Reported - German (%)
Ancestries Reported - Greek (%)
Ancestries Reported - Hungarian (%)
Ancestries Reported - Irish (%)
Ancestries Reported - Italian (%)
Ancestries Reported - Lithuanian (%)
Ancestries Reported - Norwegian (%)
Ancestries Reported - Polish (%)
Ancestries Reported - Portuguese (%)
Ancestries Reported - Russian (%)
Ancestries Reported - Scotch-Irish (%)
Ancestries Reported - Scottish (%)
Ancestries Reported - Slovak (%)
Ancestries Reported - Subsaharan African (%)
Ancestries Reported - Swedish (%)
Ancestries Reported - Swiss (%)
Ancestries Reported - Ukrainian (%)
Ancestries Reported - United States (%)
Ancestries Reported - Welsh (%)
Ancestries Reported - West Indian (%)
Ancestries Reported - Other (%)
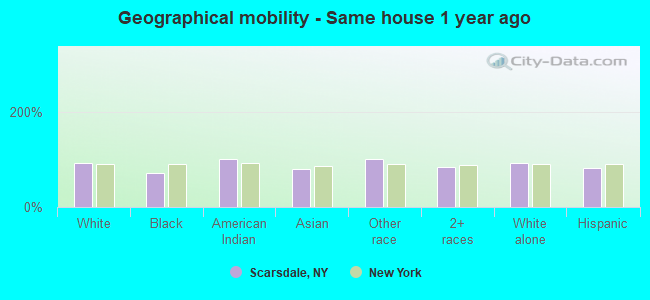
Geographical mobility - Same house 1 year ago (%)
Geographical mobility - Same house 1 year ago (%) - White
Geographical mobility - Same house 1 year ago (%) - Black or African American
Geographical mobility - Same house 1 year ago (%) - Asian
Geographical mobility - Same house 1 year ago (%) - Hispanic or Latino
Geographical mobility - Same house 1 year ago (%) - American Indian and Alaska Native
Geographical mobility - Same house 1 year ago (%) - Multirace
Geographical mobility - Same house 1 year ago (%) - Other Race
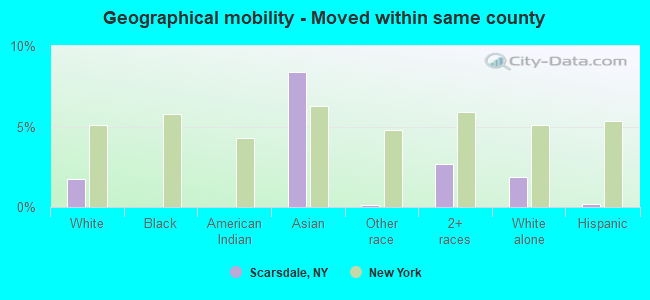
Geographical mobility - Moved within same county (%)
Geographical mobility - Moved within same county (%) - White
Geographical mobility - Moved within same county (%) - Black or African American
Geographical mobility - Moved within same county (%) - Asian
Geographical mobility - Moved within same county (%) - Hispanic or Latino
Geographical mobility - Moved within same county (%) - American Indian and Alaska Native
Geographical mobility - Moved within same county (%) - Multirace
Geographical mobility - Moved within same county (%) - Other Race
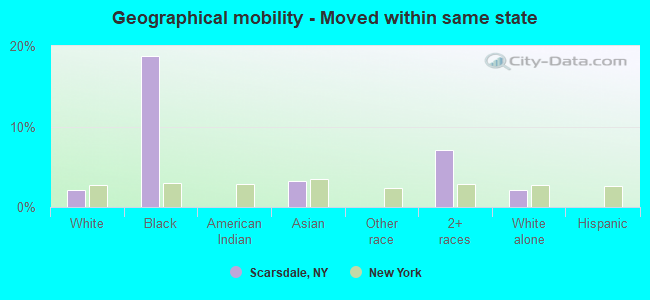
Geographical mobility - Moved from different county within same state (%)
Geographical mobility - Moved from different county within same state (%) - White
Geographical mobility - Moved from different county within same state (%) - Black or African American
Geographical mobility - Moved from different county within same state (%) - Asian
Geographical mobility - Moved from different county within same state (%) - Hispanic or Latino
Geographical mobility - Moved from different county within same state (%) - American Indian and Alaska Native
Geographical mobility - Moved from different county within same state (%) - Multirace
Geographical mobility - Moved from different county within same state (%) - Other Race
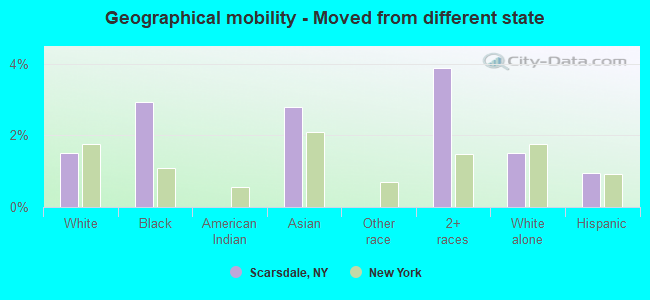
Geographical mobility - Moved from different state (%)
Geographical mobility - Moved from different state (%) - White
Geographical mobility - Moved from different state (%) - Black or African American
Geographical mobility - Moved from different state (%) - Asian
Geographical mobility - Moved from different state (%) - Hispanic or Latino
Geographical mobility - Moved from different state (%) - American Indian and Alaska Native
Geographical mobility - Moved from different state (%) - Multirace
Geographical mobility - Moved from different state (%) - Other Race
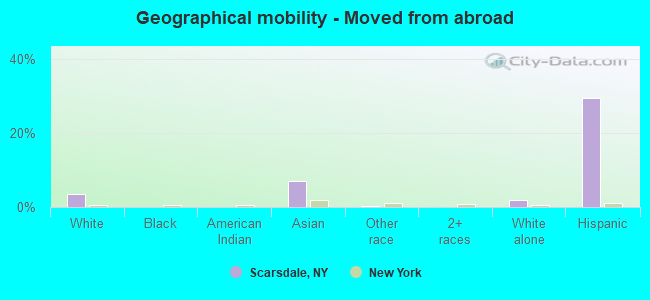
Geographical mobility - Moved from abroad (%)
Geographical mobility - Moved from abroad (%) - White
Geographical mobility - Moved from abroad (%) - Black or African American
Geographical mobility - Moved from abroad (%) - Asian
Geographical mobility - Moved from abroad (%) - Hispanic or Latino
Geographical mobility - Moved from abroad (%) - American Indian and Alaska Native
Geographical mobility - Moved from abroad (%) - Multirace
Geographical mobility - Moved from abroad (%) - Other Race
Place of birth for the foreign-born population - Ireland (%)
Place of birth for the foreign-born population - Denmark (%)
Place of birth for the foreign-born population - Norway (%)
Place of birth for the foreign-born population - Sweden (%)
Place of birth for the foreign-born population - United Kingdom (%)
Place of birth for the foreign-born population - England (%)
Place of birth for the foreign-born population - Scotland (%)
Place of birth for the foreign-born population - Other Northern Europe (%)
Place of birth for the foreign-born population - Austria (%)
Place of birth for the foreign-born population - Belgium (%)
Place of birth for the foreign-born population - France (%)
Place of birth for the foreign-born population - Germany (%)
Place of birth for the foreign-born population - Netherlands (%)
Place of birth for the foreign-born population - Switzerland (%)
Place of birth for the foreign-born population - Other Western Europe (%)
Place of birth for the foreign-born population - Greece (%)
Place of birth for the foreign-born population - Italy (%)
Place of birth for the foreign-born population - Portugal (%)
Place of birth for the foreign-born population - Spain (%)
Place of birth for the foreign-born population - Other Southern Europe (%)
Place of birth for the foreign-born population - Albania (%)
Place of birth for the foreign-born population - Belarus (%)
Place of birth for the foreign-born population - Bosnia and Herzegovina (%)
Place of birth for the foreign-born population - Bulgaria (%)
Place of birth for the foreign-born population - Croatia (%)
Place of birth for the foreign-born population - Czechoslovakia (%)
Place of birth for the foreign-born population - Hungary (%)
Place of birth for the foreign-born population - Latvia (%)
Place of birth for the foreign-born population - Lithuania (%)
Place of birth for the foreign-born population - North Macedonia (Macedonia) (%)
Place of birth for the foreign-born population - Moldova (%)
Place of birth for the foreign-born population - Poland (%)
Place of birth for the foreign-born population - Romania (%)
Place of birth for the foreign-born population - Russia (%)
Place of birth for the foreign-born population - Serbia (%)
Place of birth for the foreign-born population - Ukraine (%)
Place of birth for the foreign-born population - Other Eastern Europe (%)
Place of birth for the foreign-born population - China (%)
Place of birth for the foreign-born population - Hong Kong (%)
Place of birth for the foreign-born population - Taiwan (%)
Place of birth for the foreign-born population - Japan (%)
Place of birth for the foreign-born population - Korea (%)
Place of birth for the foreign-born population - Other Eastern Asia (%)
Place of birth for the foreign-born population - Afghanistan (%)
Place of birth for the foreign-born population - Bangladesh (%)
Place of birth for the foreign-born population - India (%)
Place of birth for the foreign-born population - Iran (%)
Place of birth for the foreign-born population - Kazakhstan (%)
Place of birth for the foreign-born population - Nepal (%)
Place of birth for the foreign-born population - Pakistan (%)
Place of birth for the foreign-born population - Sri Lanka (%)
Place of birth for the foreign-born population - Uzbekistan (%)
Place of birth for the foreign-born population - Other South Central Asia (%)
Place of birth for the foreign-born population - Burma (%)
Place of birth for the foreign-born population - Cambodia (%)
Place of birth for the foreign-born population - Indonesia (%)
Place of birth for the foreign-born population - Laos (%)
Place of birth for the foreign-born population - Malaysia (%)
Place of birth for the foreign-born population - Philippines (%)
Place of birth for the foreign-born population - Singapore (%)
Place of birth for the foreign-born population - Thailand (%)
Place of birth for the foreign-born population - Vietnam (%)
Place of birth for the foreign-born population - Other South Eastern Asia (%)
Place of birth for the foreign-born population - Armenia (%)
Place of birth for the foreign-born population - Iraq (%)
Place of birth for the foreign-born population - Israel (%)
Place of birth for the foreign-born population - Jordan (%)
Place of birth for the foreign-born population - Kuwait (%)
Place of birth for the foreign-born population - Lebanon (%)
Place of birth for the foreign-born population - Saudi Arabia (%)
Place of birth for the foreign-born population - Syria (%)
Place of birth for the foreign-born population - Turkey (%)
Place of birth for the foreign-born population - Yemen (%)
Place of birth for the foreign-born population - Other Western Asia (%)
Place of birth for the foreign-born population - Eritrea (%)
Place of birth for the foreign-born population - Ethiopia (%)
Place of birth for the foreign-born population - Kenya (%)
Place of birth for the foreign-born population - Somalia (%)
Place of birth for the foreign-born population - Uganda (%)
Place of birth for the foreign-born population - Zimbabwe (%)
Place of birth for the foreign-born population - Other Eastern Africa (%)
Place of birth for the foreign-born population - Cameroon (%)
Place of birth for the foreign-born population - Congo (%)
Place of birth for the foreign-born population - Democratic Republic of Congo (Zaire) (%)
Place of birth for the foreign-born population - Other Middle Africa (%)
Place of birth for the foreign-born population - Egypt (%)
Place of birth for the foreign-born population - Morocco (%)
Place of birth for the foreign-born population - Sudan (%)
Place of birth for the foreign-born population - Other Northern Africa (%)
Place of birth for the foreign-born population - South Africa (%)
Place of birth for the foreign-born population - Other Southern Africa (%)
Place of birth for the foreign-born population - Cabo Verde (%)
Place of birth for the foreign-born population - Ghana (%)
Place of birth for the foreign-born population - Liberia (%)
Place of birth for the foreign-born population - Nigeria (%)
Place of birth for the foreign-born population - Senegal (%)
Place of birth for the foreign-born population - Sierra Leone (%)
Place of birth for the foreign-born population - Other Western Africa (%)
Place of birth for the foreign-born population - Australia (%)
Place of birth for the foreign-born population - New Zealand (%)
Place of birth for the foreign-born population - Fiji (%)
Place of birth for the foreign-born population - Micronesia (%)
Place of birth for the foreign-born population - Bahamas (%)
Place of birth for the foreign-born population - Barbados (%)
Place of birth for the foreign-born population - Cuba (%)
Place of birth for the foreign-born population - Dominica (%)
Place of birth for the foreign-born population - Dominican Republic (%)
Place of birth for the foreign-born population - Grenada (%)
Place of birth for the foreign-born population - Haiti (%)
Place of birth for the foreign-born population - Jamaica (%)
Place of birth for the foreign-born population - St. Vincent and the Grenadines (%)
Place of birth for the foreign-born population - Trinidad and Tobago (%)
Place of birth for the foreign-born population - West Indies (%)
Place of birth for the foreign-born population - Other Caribbean (%)
Place of birth for the foreign-born population - Belize (%)
Place of birth for the foreign-born population - Costa Rica (%)
Place of birth for the foreign-born population - El Salvador (%)
Place of birth for the foreign-born population - Guatemala (%)
Place of birth for the foreign-born population - Honduras (%)
Place of birth for the foreign-born population - Mexico (%)
Place of birth for the foreign-born population - Nicaragua (%)
Place of birth for the foreign-born population - Panama (%)
Place of birth for the foreign-born population - Other Central America (%)
Place of birth for the foreign-born population - Argentina (%)
Place of birth for the foreign-born population - Bolivia (%)
Place of birth for the foreign-born population - Brazil (%)
Place of birth for the foreign-born population - Chile (%)
Place of birth for the foreign-born population - Colombia (%)
Place of birth for the foreign-born population - Ecuador (%)
Place of birth for the foreign-born population - Guyana (%)
Place of birth for the foreign-born population - Peru (%)
Place of birth for the foreign-born population - Uruguay (%)
Place of birth for the foreign-born population - Venezuela (%)
Place of birth for the foreign-born population - Other South America (%)
Place of birth for the foreign-born population - Canada (%)
Place of birth for the foreign-born population - Other Northern America (%)
Place of birth for the foreign-born population - Other (%)
Latest news about races in Scarsdale, NY collected exclusively by city-data.com from local newspapers, TV, and radio stations
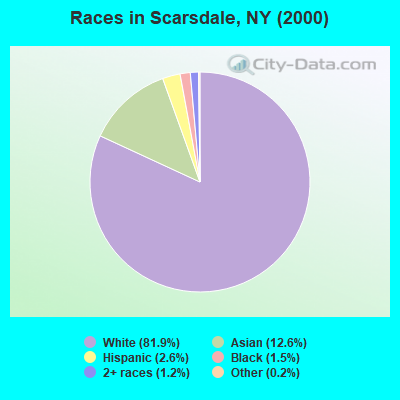
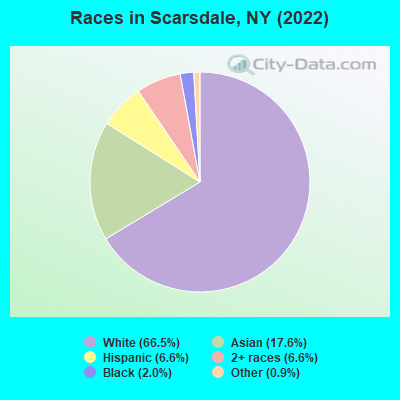
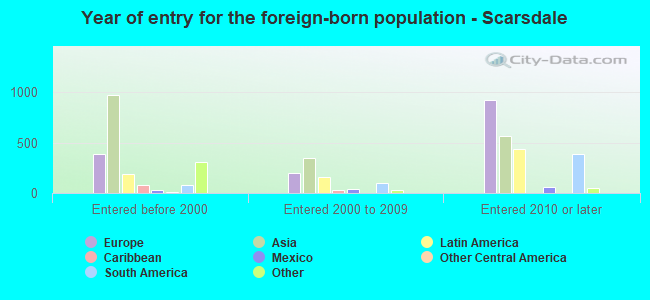
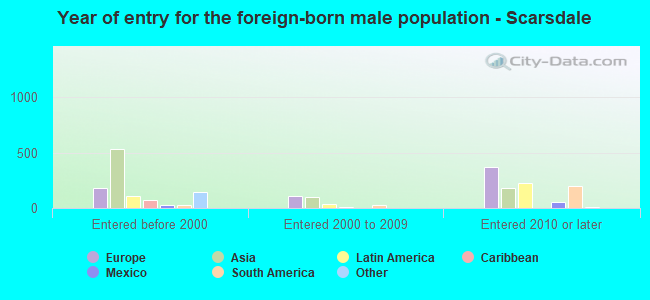
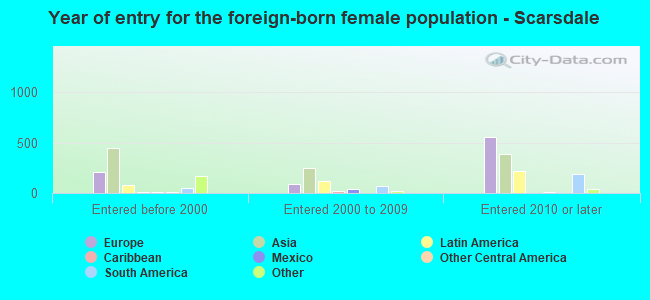
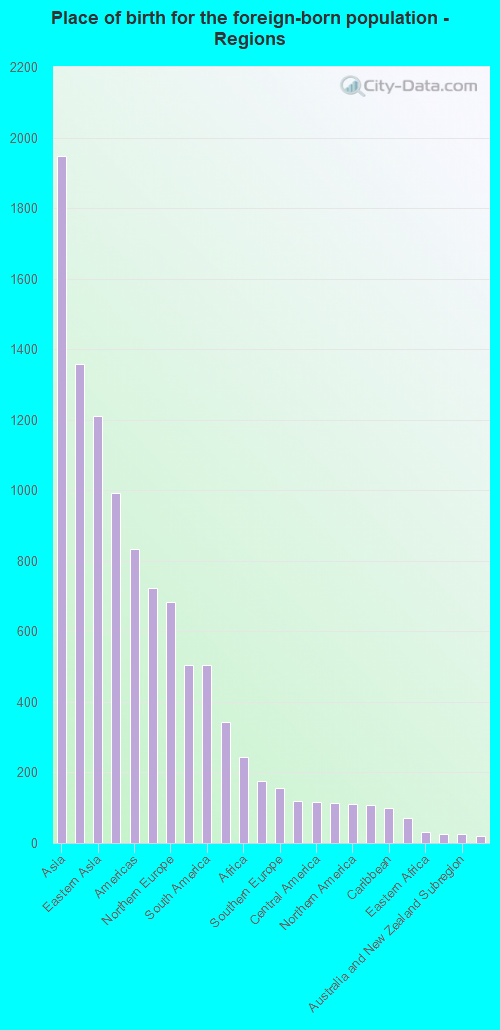
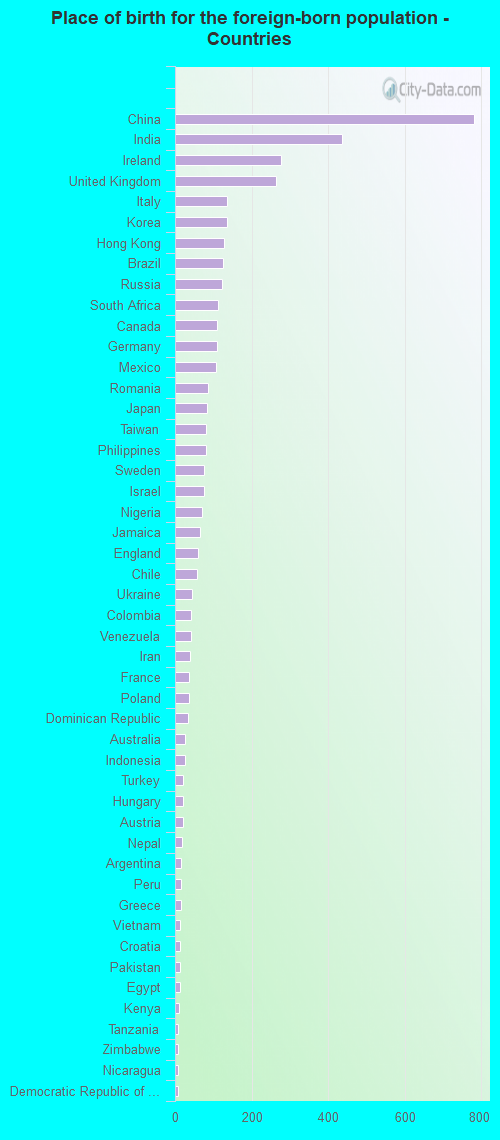
According to 2022 data, the most numerous races in Scarsdale, NY are White alone (11,923 residents), Hispanic (1,191 residents), and Black alone (352 residents). 74.4% of Scarsdale residents speak English at home. 24.6% of Scarsdale, NY residents are foreign-born (10.9% born in Asia, 7.6% born in Europe, 4.0% born in Latin America), which is 10.6% greater than the foreign-born rate of 22.0% across the entire state of New York.
Race distribution in Scarsdale
2000 2022
11,760,981 62.0% White alone 2,867,583 15.1% Hispanic 2,812,623 14.8% Black alone 1,035,926 5.5% Asian alone 366,116 1.9% Two or more races 75,499 0.4% Other race alone 52,499 0.3% American Indian alone 5,230 0.03% Native Hawaiian and Other
10,408,933 52.9% White alone 3,867,299 19.7% Hispanic 2,633,840 13.4% Black alone 1,776,286 9.0% Asian alone 732,670 3.7% Two or more races 216,110 1.1% Other race alone 35,082 0.2% American Indian alone 6,931 0.04% Native Hawaiian and Other
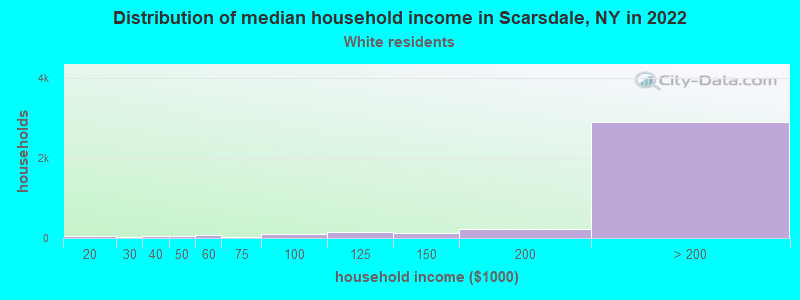
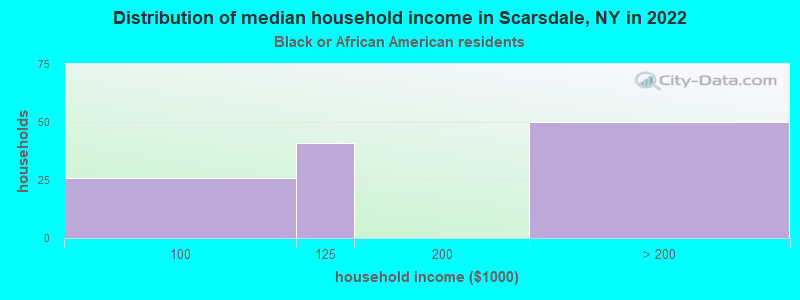
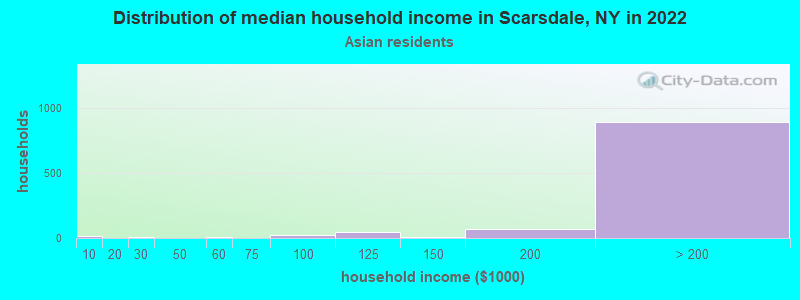
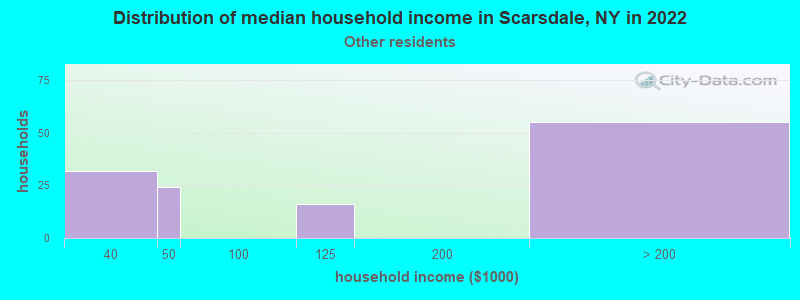
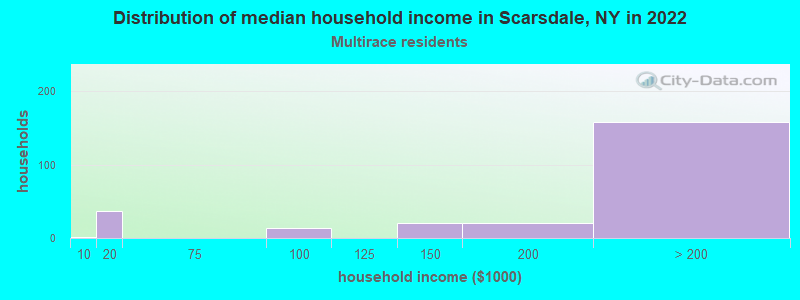
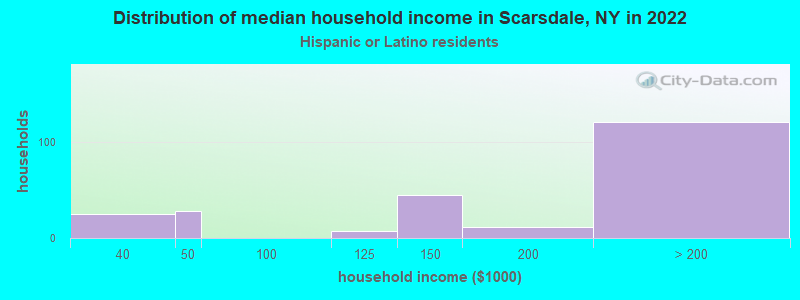
Income and house value in Scarsdale Median household income in 2022 over $200,000 White non-Hispanic householdersover $200,000 Asian householdersover $200,000 Two or more races householders$196,130 Hispanic or Latino race householdersMedian 2022 house value over $1,000,000 White Non-Hispanic householdersover $1,000,000 Black or African American householders$782,780 American Indian or Alaska Native householders over $1,000,000 Asian householdersover $1,000,000 Some other race householdersover $1,000,000 Two or more races householdersover $1,000,000 Hispanic or Latino householders
Median age by race in Scarsdale
44.4 Median age for White residents43.0 45.3 42.2 Median age for Black or African American residents41.4 51.7 -641,441,440.8 Median age for American Indian / Alaska Native residents-664,804,468.6 -554,999,999.4 44.7 Median age for Asian residents45.8 43.1 -487,992,314.6 Median age for Native Hawaiian / Pacific Islander residents-477,502,295.2 -666,666,666.0 19.2 Median age for Other race residents55.9 16.8 15.0 Median age for Two or more races residents14.4 15.2 44.3 Median age for White alone residents42.4 45.7 18.9 Median age for Hispanic or Latino residents40.2 17.4
Owner/renter occupied households by race in Scarsdale
House owners and renters - White residents 3,580 91.7% Owner occupied324 8.3% Renter occupiedHouse owners and renters - Black or African American residents 125 100.0% Owner occupiedHouse owners and renters - Asian residents 1,071 94.3% Owner occupied65 5.7% Renter occupiedHouse owners and renters - Other race residents 72 54.1% Owner occupied61 45.9% Renter occupiedHouse owners and renters - Two or more races residents 255 100.0% Owner occupiedHouse owners and renters - White alone residents 3,648 92.2% Owner occupied309 7.8% Renter occupiedHouse owners and renters - Hispanic or Latino residents 140 55.4% Owner occupied113 44.6% Renter occupied
Language usage in Scarsdale
English speakers - Total 74.4% of residents of Scarsdale speak English at home.
5.0% of residents speak Spanish at home 622 72.1% Speak English very well241 27.9% Speak English less than very well19.6% of residents speak other language at home 2,645 78.7% Speak English very well717 21.3% Speak English less than very well
English speakers - Born in the United States 90.4% of residents of Scarsdale speak English at home.
0.6% of residents speak Spanish at home 16 84.2% Speak English very well3 15.8% Speak English less than very well9.7% of residents speak other language at home 333 100.0% Speak English very well
English speakers - Native, born elsewhere 44.3% of residents of Scarsdale speak English at home.
11.2% of residents speak Spanish at home 44 100.0% Speak English very well35.4% of residents speak other language at home 135 97.1% Speak English very well4 2.9% Speak English less than very well
English speakers - Foreign-born 40.0% of residents of Scarsdale speak English at home.
12.6% of residents speak Spanish at home 364 64.8% Speak English very well198 35.2% Speak English less than very well48.7% of residents speak other language at home 1,561 71.7% Speak English very well615 28.3% Speak English less than very well
White (Caucasian) - Speak only English Native:
94.0% (9,017)Foreign-born:
57.8% (891)
White (Caucasian) - Speak another language Native:
6.7% (641)Foreign-born:
49.4% (762)
Black or African American - Speak only English Native:
71.8% (142)Foreign-born:
53.5% (85)
Black or African American - Speak another language Native:
23.5% (46)Foreign-born:
45.2% (72)
Asian - Speak only English Native:
59.3% (675)Foreign-born:
31.7% (602)
Asian - Speak another language Native:
40.6% (462)Foreign-born:
69.3% (1,315)
Other race - Speak only English Native:
54.2% (212)Foreign-born:
2.7% (5)
Other race - Speak another language Native:
40.0% (156)Foreign-born:
95.0% (160)
Two or more races - Speak only English Native:
89.2% (1,114)Foreign-born:
29.5% (77)
Two or more races - Speak another language Native:
12.1% (151)Foreign-born:
68.8% (180)
White alone - Speak only English Native:
92.4% (9,119)Foreign-born:
58.0% (902)
White alone - Speak another language Native:
7.5% (743)Foreign-born:
45.3% (704)
Hispanic or Latino - Speak another language Native:
34.4% (206)Foreign-born:
98.3% (530)
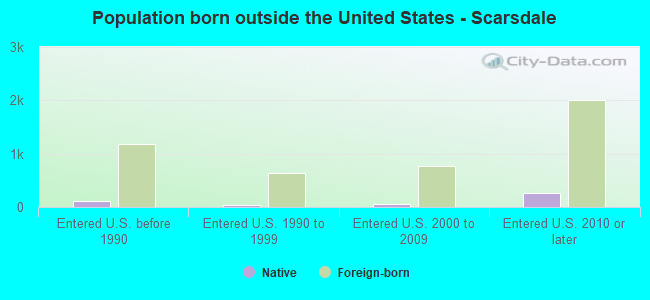
Foreign-born residents in Scarsdale 4,410 residents are foreign born (10.9% Asia , 7.6% Europe , 4.0% Latin America ).
This city:
24.6%New York:
22.6%
Marital status for residents in Scarsdale Marital status - White (Caucasian) population 15 years and over
Males 23.0% Never married75.6% Now married0.1% Separated0.9% Widowed0.4% DivorcedFemales 21.5% Never married68.3% Now married1.2% Separated4.6% Widowed4.3% DivorcedWomen who gave birth in the past 12 months Now married:
100.0% (52)Unmarried:
0.0% (0)
Women who did not give birth in the past 12 months Now married:
58.3% (1,334)Unmarried:
41.7% (953)
Marital status - Black or African American population 15 years and over
Males 27.3% Never married72.7% Now married0.0% Separated0.0% Widowed0.0% DivorcedFemales 19.1% Never married73.6% Now married0.0% Separated0.0% Widowed7.3% DivorcedWomen who did not give birth in the past 12 months Now married:
48.8% (19)Unmarried:
51.2% (20)
Marital status - Asian population 15 years and over
Males 12.5% Never married84.7% Now married0.0% Separated1.3% Widowed1.6% DivorcedFemales 16.9% Never married75.4% Now married0.1% Separated4.6% Widowed3.1% DivorcedWomen who gave birth in the past 12 months Now married:
100.0% (15)Unmarried:
0.0% (0)
Women who did not give birth in the past 12 months Now married:
72.0% (610)Unmarried:
28.0% (237)
Marital status - Other race population 15 years and over
Males 33.3% Never married27.9% Now married0.0% Separated0.0% Widowed38.8% DivorcedFemales 52.9% Never married19.5% Now married13.8% Separated13.8% Widowed0.0% DivorcedWomen who did not give birth in the past 12 months Now married:
34.3% (66)Unmarried:
65.7% (126)
Marital status - Two or more races population 15 years and over
Males 41.0% Never married56.5% Now married0.0% Separated0.0% Widowed2.5% DivorcedFemales 34.9% Never married61.7% Now married0.0% Separated0.7% Widowed2.7% DivorcedWomen who did not give birth in the past 12 months Now married:
43.4% (100)Unmarried:
56.6% (130)
Marital status - White alone, not Hispanic / Latino population 15 years and over
Males 22.4% Never married76.2% Now married0.1% Separated0.9% Widowed0.4% DivorcedFemales 20.6% Never married69.1% Now married1.2% Separated4.8% Widowed4.3% DivorcedWomen who gave birth in the past 12 months Now married:
100.0% (56)Unmarried:
0.0% (0)
Women who did not give birth in the past 12 months Now married:
59.1% (1,356)Unmarried:
40.9% (939)
Marital status - Hispanic or Latino population 15 years and over
Males 24.9% Never married63.6% Now married0.0% Separated0.0% Widowed11.5% DivorcedFemales 47.2% Never married37.1% Now married6.8% Separated6.8% Widowed2.1% DivorcedWomen who did not give birth in the past 12 months Now married:
40.7% (138)Unmarried:
59.3% (201)
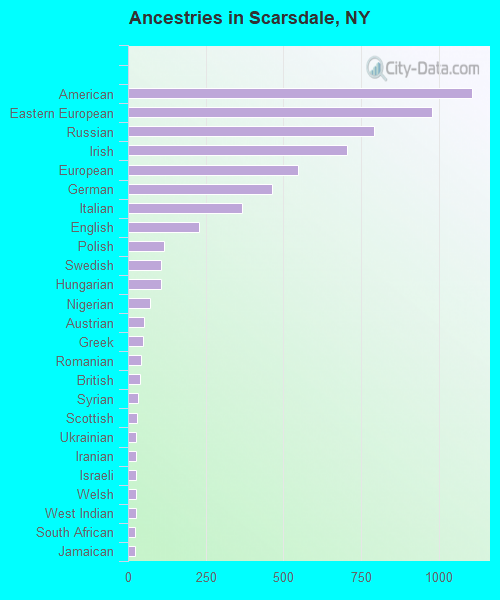
Ancestries in Scarsdale
1,106 11.1% American979 9.8% Eastern European790 7.9% Russian703 7.0% Irish547 5.5% European462 4.6% German366 3.7% Italian230 2.3% English115 1.1% Polish106 1.1% Swedish106 1.1% Hungarian70 0.7% Nigerian52 0.5% Austrian48 0.5% Greek42 0.4% Romanian39 0.4% British32 0.3% Syrian29 0.3% Scottish27 0.3% Ukrainian26 0.3% Iranian26 0.3% Israeli26 0.3% Welsh25 0.2% West Indian23 0.2% South African23 0.2% Jamaican20 0.2% Canadian17 0.2% Norwegian14 0.1% Estonian14 0.1% Portuguese12 0.1% Scotch-Irish12 0.1% Brazilian9 0.09% French9 0.09% Dutch9 0.09% Armenian8 0.08% Northern European7 0.07% Lithuanian6 0.06% Croatian3 0.03% Lebanese2 0.02% Guyanese
Children Nativity (place of birth) in Scarsdale
Children under 6 years - Living with two parents Both parents native 554 99.9% Native1 0.1% Foreign-bornBoth parents foreign-born 184 89.0% Native23 11.0% Foreign-bornOne native, one foreign-born parent 229 100.0% NativeChildren under 6 years - Living with one parent Native parent 7 100.0% NativeForeign-born parent 9 100.0% NativeChildren 6 to 17 years - Living with two parents Both parents native 2,059 100.0% NativeBoth parents foreign-born 771 65.6% Native404 34.4% Foreign-bornOne native, one foreign-born parent 764 100.0% NativeChildren 6 to 17 years - Living with one parent Native parent 289 100.0% NativeForeign-born parent 174 51.8% Native163 48.2% Foreign-born
Grandparents responsible for own grandchildren in Scarsdale
Grandparents (30 to 59 years) Asian 9 100.0% Not responsible for grandchildrenGrandparents (60 years and over) Asian 8 5.8% Responsible for grandchildren125 94.2% Not responsible for grandchildren